
Validity and reliability of carotid-toe pulse wave velocity as a measure of arterial stiffness in healthy individuals: Comparison to carotid-femoral pulse wave velocity
- DOI
- 10.1016/j.artres.2018.07.001How to use a DOI?
- Keywords
- Arterial stiffness; Carotid-toe pulse wave velocity; Carotid-femoral pulse wave velocity; Validity; Reliability; Tonometry
- Abstract
Purpose: The present investigation evaluated the validity and reliability of carotid-toe PWV (ctPWV) as a non-intrusive measure of systemic arterial stiffness in healthy young adults.
Methods: The Validity Trial examined the association and agreement between cfPWV and ctPWV in 33 adults (24 ± 2 years; 14 females), while the Reliability Trial assessed the variability in cfPWV and ctPWV in 13 adults (22 ± 2 years; 5 females) over repeat visits. Proximal pulse waves were acquired (applanation tonometry) from the left common carotid (CCA) for both measures, while distal pulse waves were acquired from the left femoral artery (applanation tonometry) and the second left toe (pulse oximeter) for cfPWV and ctPWV, respectively.
Results: cfPWV (5.3 ± 0.7, 3.9–6.5 m/s) and ctPWV (5.4 ± 0.5, 4.6–6.3 m/s) demonstrated a moderate-to-strong positive linear correlation (r = 0.79, P < 0.01) and a strong intra-class correlation (ICC; ICC = 0.86, P < 0.01). The Bland–Altman plot demonstrated agreement between cfPWV and ctPWV with no fixed bias (0.1 m/s, ± 2SD: −0.8 to 0.9 m/s, P > 0.05) and all data points falling within ±2 SD of the mean difference between measures. cfPWV and ctPWV demonstrated reliability across visits as evidenced by low coefficients of variation (cfPWV: 3.4 ± 2.6%, ctPWV: 2.6 ± 2.5%) and strong ICCs (cfPWV: ICC = 0.91, ctPWV: ICC = 0.84, both P < 0.01).
Conclusions: Through comparison with cfPWV, this study provides evidence to suggest that ctPWV yields a valid and reliable index of arterial stiffness in healthy young adults.
- Copyright
- © 2018 Association for Research into Arterial Structure and Physiology. Published by Elsevier B.V. All rights reserved.
- Open Access
- This is an open access article distributed under the CC BY-NC license.
Introduction
Cardiovascular diseases (CVD) are the leading cause of mortality globally.1,2 Central arterial stiffening is a critical mechanism in the pathogenesis of CVD as reduced compliance of the proximal aorta results in augmented myocardial workload and ischemia, as well as pathological ventricular modifications.3 Using non-invasive techniques (e.g., measurement of aortic pulse wave velocity or carotid artery ultrasound), clinicians can detect early arterial alterations to implement either lifestyle modifications or pharmacological strategies to prevent progression to CVD, while researchers are able to use these tools to identify novel factors associated with adverse arterial modifications such as exposure to microgravity in spaceflight or adverse childhood experiences.4,5
Carotid-femoral PWV (cfPWV) is regarded as the gold-standard for non-invasively measuring arterial stiffness6 and detects arterial modifications accompanying aging,7 hypertension,8 and aerobic exercise interventions.9 Importantly, cfPWV (or aortic PWV) predicts cardiovascular events in both healthy and patient populations, independent of traditional cardiovascular risk factors.10–12 While cfPWV demonstrates prognostic utility, its value may be limited in some populations due to its reliance on pulse wave acquisition at the superficial femoral artery which is technically challenging and difficult to obtain in individuals with excessive adipose tissue. Also, cfPWV may be considered intrusive (e.g., by children or their parents), or may be impractical in a clinical setting. To address these issues, investigators have developed measures of arterial stiffness that rely on pulse wave acquisition at sites distal to the femoral artery. For example, brachial-ankle13 and finger-toe14 PWV both allow for the relatively simple acquisition of peripheral pulse waveforms to quantify arterial mechanics and are associated with measures of cfPWV. Importantly, while these measures include the peripheral vasculature, some evidence suggests they may predict CVD risk.15,16
Likewise, carotid-toe PWV (ctPWV) describes a novel measure of systemic arterial stiffness that circumvents femoral pulse wave acquisition by collecting distal pulse waves from the digital arteries of the toe rather than the femoral artery. ctPWV offers advantages for both researchers and clinicians as it incorporates the carotid-femoral arterial segment, while in comparison to cfPWV provides a technically simple and less intrusive measure of arterial stiffness that may be performed in large populations, including those that may not be comfortable with femoral pulse wave palpation. Therefore, this study aimed to evaluate the validity of ctPWV using cfPWV as a reference standard and assess its reliability across days, in healthy young adults. This study tested the hypothesis that ctPWV yields reliable stiffness measurements comparable to cfPWV.
Materials and methods
Participants were young, non-smoking, normotensive adults, free from overt CVD or CVD risk factors and not currently taking medications known to affect blood pressure (BP) or autonomic activity. Both oral contraceptive using and non-using females were included.
This study was part of a larger investigation17 and therefore the validity and reliability features were assessed in two phases, referred to as Validity and Reliability Trials. The Validity Trial (n = 33) used a cross-sectional design where measures of cfPWV and ctPWV were performed. Following the Validity Trial, we conducted the Reliability Trial where we tested participants (n = 13), four to seven days apart (referred to as Visit One and Visit Two). Two individuals (both male) from the Validity Trial participated in the Reliability Trial. The testing protocols were identical for both trials.
All testing sessions were performed in the Human Hemodynamics Laboratory at Brock University. On their first visit, participants filled out a medical history questionnaire, in addition to reviewing and signing the informed consent form approved by the Brock University Research Ethics Board. Participants refrained from caffeine and alcohol consumption as well as exercise for 12 h prior to all testing sessions. Participants voided their bladder prior to data collection to prevent the effect of bladder distension on arterial BP.18 Following anthropometric measurement, participants rested for 15 min in the supine position to stabilize hemodynamic variables. Participants were instrumented with a single 3-lead ECG and a photoplethysmographic finger cuff (Nexfin, BMEYE, Amsterdam, the Netherlands) for continuous heart rate (HR) and blood pressure (BP) measurement, respectively. Prior to data collection, laboratory personnel performed three manual BP measurements. All data were collected in the supine position using an online data analysis and acquisition system (Powerlab and Chart 7, ADInstruments) at 1000 Hz, providing a resolution of 1 ms.
Laboratory personnel non-invasively measured PWV using pulse wave contours collected at the left common carotid artery (CCA) and left femoral artery using a hand-held applanation tonometer (Millar Instruments, Texas, USA) and from the digital arteries of the second left toe using a photoplethysmographic pulse oximeter (Nellcor N-200 Tyco Healthcare Group LP, Pleasanton, CA, USA). Pulse wave contours were collected over ∼15 consecutive cardiac cycles at each site. The time corresponding to the foot of the pulse wave (i.e., the onset of the sharp systolic upstroke of the forward pulse wave) was used as the pulse wave time.9,19 A bandpass filter (5–30 Hz) enabled accurate detection of the foot of the pulse waves obtained with tonometry, while data collected with the pulse oximeter was not filtered. For each site (i.e., CCA, left femoral artery, and second left toe) the timing of the foot of the pressure wave was registered relative to the R-wave of the ECG. Transit time was recorded as the time difference between the R-wave and the foot of the pressure wave for each site. Distances were measured using an inelastic tape from the suprasternal notch to the site of pulse wave collection (i.e., left CCA, left femoral artery, and second left toe). PWV was calculated using the formula20:
Data are presented as mean ± SD. Pearson’s tests of correlation and intra-class coefficient (ICC; two-way random effects, absolute agreement) assessed the relationship and agreement, respectively, between cfPWV and ctPWV. A Bland–Altman plot assessed agreement between cfPWV and ctPWV. These statistics were also employed to test the day-to-day reliability of cfPWV and ctPWV. Paired sample t-tests assessed whether variables were different between visits in the Reliability Trial. Coefficient of variation ((SD/mean)•100%) assessed the variability across visits for cfPWV and ctPWV. Analyses were performed using SPSS (v23; SPSS Inc. Chicago, Illinois, USA). All tests were two tailed; α = 0.05.
Results
Thirty-three individuals participated in the Validity Trial (n = 14 females, 24 ± 2 years, 20–28 years, 1.74 ± 0.08 m, 70.8 ± 11.5 kg, 23.2 ± 2.5 kg/m2, 57 ± 8 bpm, MAP: 84 ± 6 mmHg), while 13 individuals participated in the Reliability Trial (n = 5 females, 22 ± 2 years, 20–25 years, 1.73 ± 0.08 m, 68.3 ± 8.5 kg, 22.8 ± 2.1 kg/m2).
Table 1 presents the pulse wave velocity and transit time data for the Validity Trial and both visits of the Reliability Trial. In the Validity Trial, carotid-toe transit time and carotid-femoral transit time demonstrated a moderate linear correlation (r = 0.64, P < 0.01; not shown). Also, the mean cfPWV (5.3 ± 0.7, 3.9–6.5 m/s) and ctPWV (5.4 ± 0.5, 4.6–6.3 m/s) in the Validity Trial were similar (mean difference: 0.1 ± 0.4 m/s; P > 0.05). cfPWV and ctPWV demonstrated a moderate-to-strong linear correlation (r = 0.79, P < 0.01, Power = 1.00; Fig. 1A) and strong absolute agreement, as assessed by ICC (ICC = 0.86, P < 0.01). Inspection of the Bland–Altman plot of agreement (Fig. 1B) indicated agreement between ctPWV and cfPWV. The plot demonstrated no fixed bias as small differences existed between methods over the range of mean values. Also, the scatter of differences was consistent over the range of mean values and all differences fell within ±2 SD of the mean (0.1 m/s, ± 2SD: −0.8 to 0.9 m/s). However, when testing proportional bias by regressing the difference between methods (ctPWV-cfPWV) on the mean ((cfPWV+ ctPWV)/2), a negative relationship was found, suggesting that ctPWV may overestimate cfPWV at lesser values and underestimate cfPWV at greater values in the current sample (b = −0.38, P < 0.01). For this reason, hyperbolic confidence limits were plotted for the regression line fit to the difference versus the mean (Fig. 1B).21 All data points fell within the hyperbolic confidence limits.
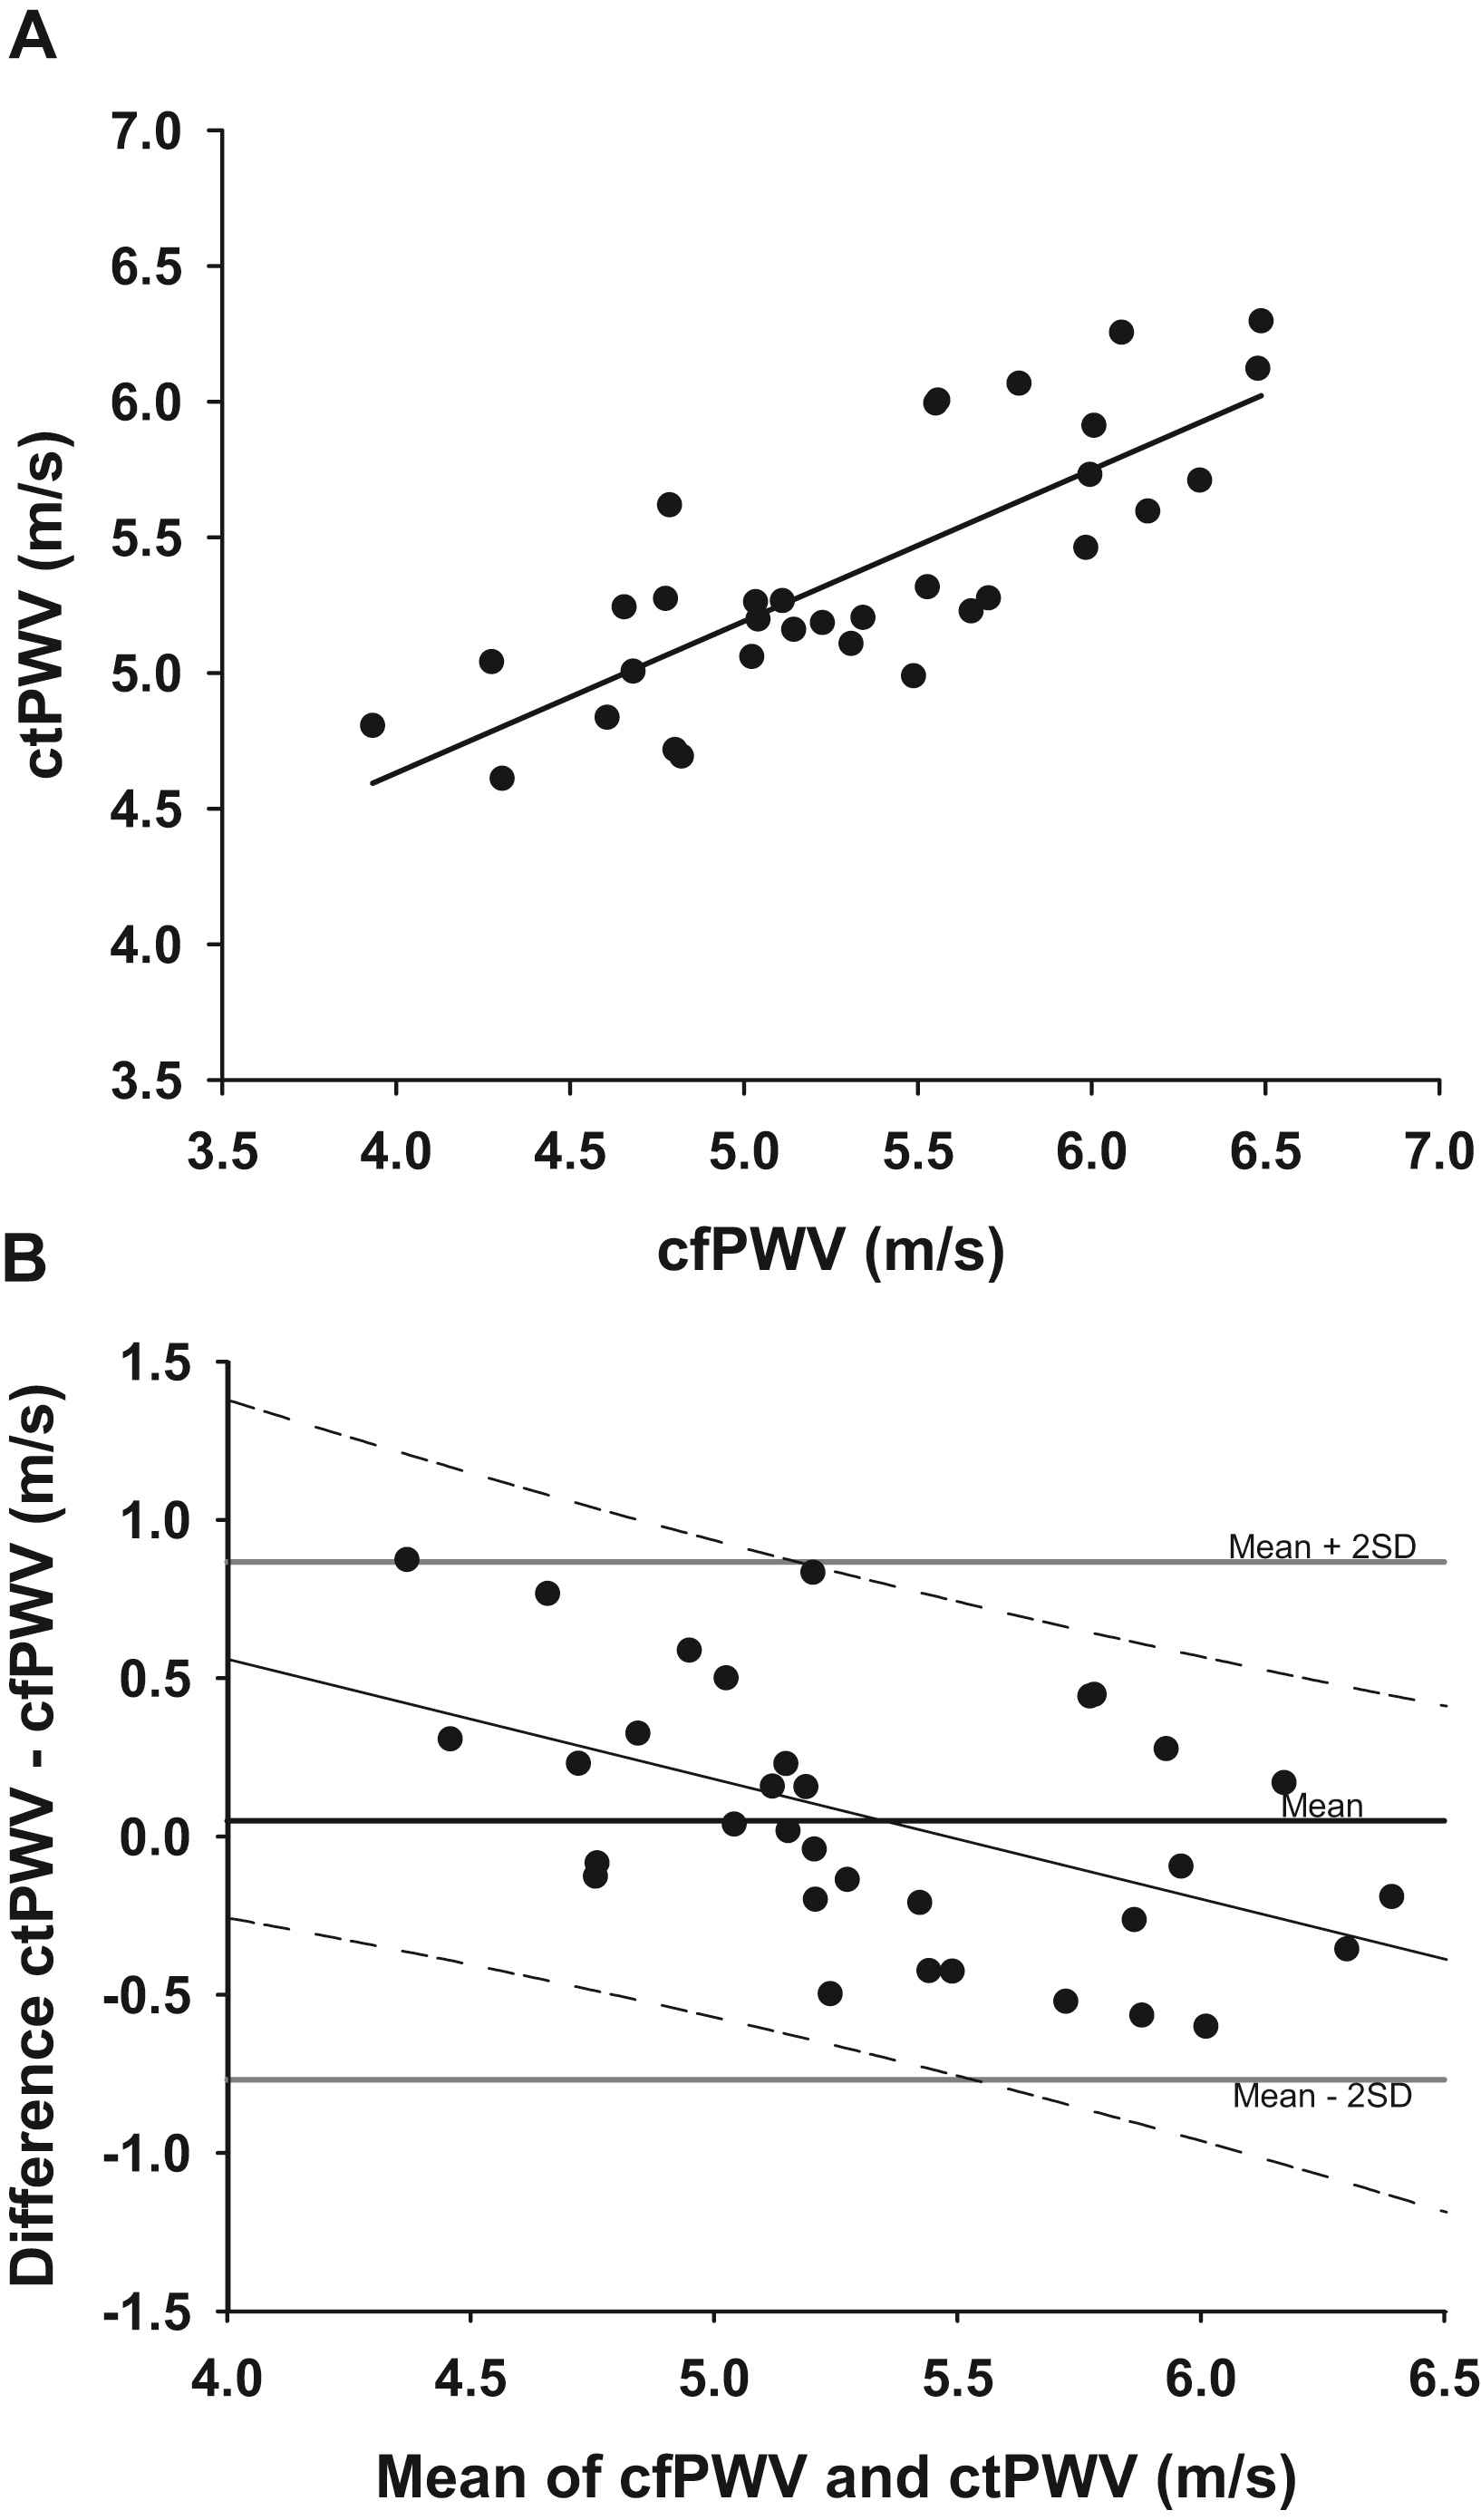
The relationship between carotid-femoral pulse wave velocity (cfPWV) and carotid-toe pulse wave velocity (ctPWV) in the Validity Trial. Pearson’s test of correlation was employed (r = 0.79, P < 0.01, n = 33) (Fig. 1A). Bland–Altman plot of agreement displaying the difference between methods as a function of the mean of the methods in the Validity Trial. The mean difference (0.1 m/s; solid black line denoted by mean) and confidence limits of the mean difference (±2 SD: −0.8 to 0.9 m/s; solid gray lines) are plotted. The regression line (y = −0.38x + 2.07, r2 = 0.24, P < 0.01; solid black line) fitted to the difference between methods versus the mean of methods and the hyperbolic confidence limits (dashed black lines) of this regression line are plotted (Fig. 1B).
| Visit one | Visit two | |
|---|---|---|
| Validity trial | ||
| cfPWV, m/s | 5.3 (0.7) | – |
| cfTT, ms | 90.1 (9.7) | – |
| ctPWV, m/s | 5.4 (0.5) | – |
| ctTT, ms | 253.0 (17.8) | – |
| Reliability trial | ||
| cfPWV, m/s | 5.4 (0.6) | 5.3 (0.5) |
| cfTT, ms | 92.1 (9.5) | 92.6 (7.1) |
| ctPWV, m/s | 5.4 (0.4) | 5.3 (0.3) |
| ctTT, ms | 254.9 (29.1) | 256.3 (24.4) |
Values are mean (±SD). cfPWV, carotid-femoral pulse wave velocity; cfTT, carotid-femoral transit time; ctPWV, carotid-toe pulse wave velocity; ctTT, carotid-toe transit time. No significant differences were detected.
Pulse wave velocity data.
MAP was consistent across visits (Visit One: 79 ± 6, Visit Two: 77 ± 6 mmHg; P > 0.05), while HR was lower during Visit Two (Visit One: 63 ± 6, Visit Two 60 ± 10 bpm; P < 0.05) of the Reliability Trial. cfPWV (Visit One: 5.4 ± 0.6 m/s, Visit Two: 5.3 ± 0.5 m/s) and ctPWV (Visit One: 5.4 ± 0.4 m/s, Visit Two: 5.3 ± 0.3 m/s) demonstrated low variability across visits, as the coefficients of variation were 3.4 ± 2.6% and 2.6 ± 2.5% (P > 0.05), respectively. Both cfPWV (ICC = 0.91, r = 0.85, both P < 0.01) and ctPWV (ICC = 0.84, r = 0.72, both P < 0.01) reliably measured arterial stiffness across visits in the Reliability Trial. Bland–Altman plots demonstrated agreement between visits for cfPWV (Fig. 2) and ctPWV (Fig. 3). Neither method demonstrated fixed (cfPWV: −0.1 m/s ±2 SD: −0.7 to 0.6 m/s; ctPWV: −0.04 m/s, ±2 SD: −0.6 to 0.5 m/s; both P > 0.05) nor proportional bias (cfPWV: b = −0.30; ctPWV: b = −0.22; both P > 0.05) across visits. Further, over the range of mean values, the differences between visits were small with consistent scatters for both cfPWV and ctPWV. For both cfPWV and ctPWV, one datum point, representing the difference between visits existed beyond ±2 SD of the mean difference (Figs. 2B and 3B). Across visits, transit times for carotid-femoral (ICC = 0.88, r = 0.80; both P < 0.01) and carotid-toe (ICC = 0.96, r = 0.92; both P < 0.01) measures exhibited strong correlations and agreement. Bland–Altman plots (not shown) showed strong agreement for carotid-femoral (mean difference: 0.5 ± 5.7 ms, P > 0.05) and carotid-toe (mean difference: 1.4 ± 12 ms, P > 0.05) transit times across visits with no fixed bias and the scatter of differences falling within ±2 SD of the mean (carotid-femoral: −10.9 to 11.9 ms; carotid-toe: −21.5 to 24.2 ms). Also, transit time did not exhibit proportional bias for either measure (carotid-femoral: b = −0.31; carotid-toe: b = −0.18; both P > 0.05).
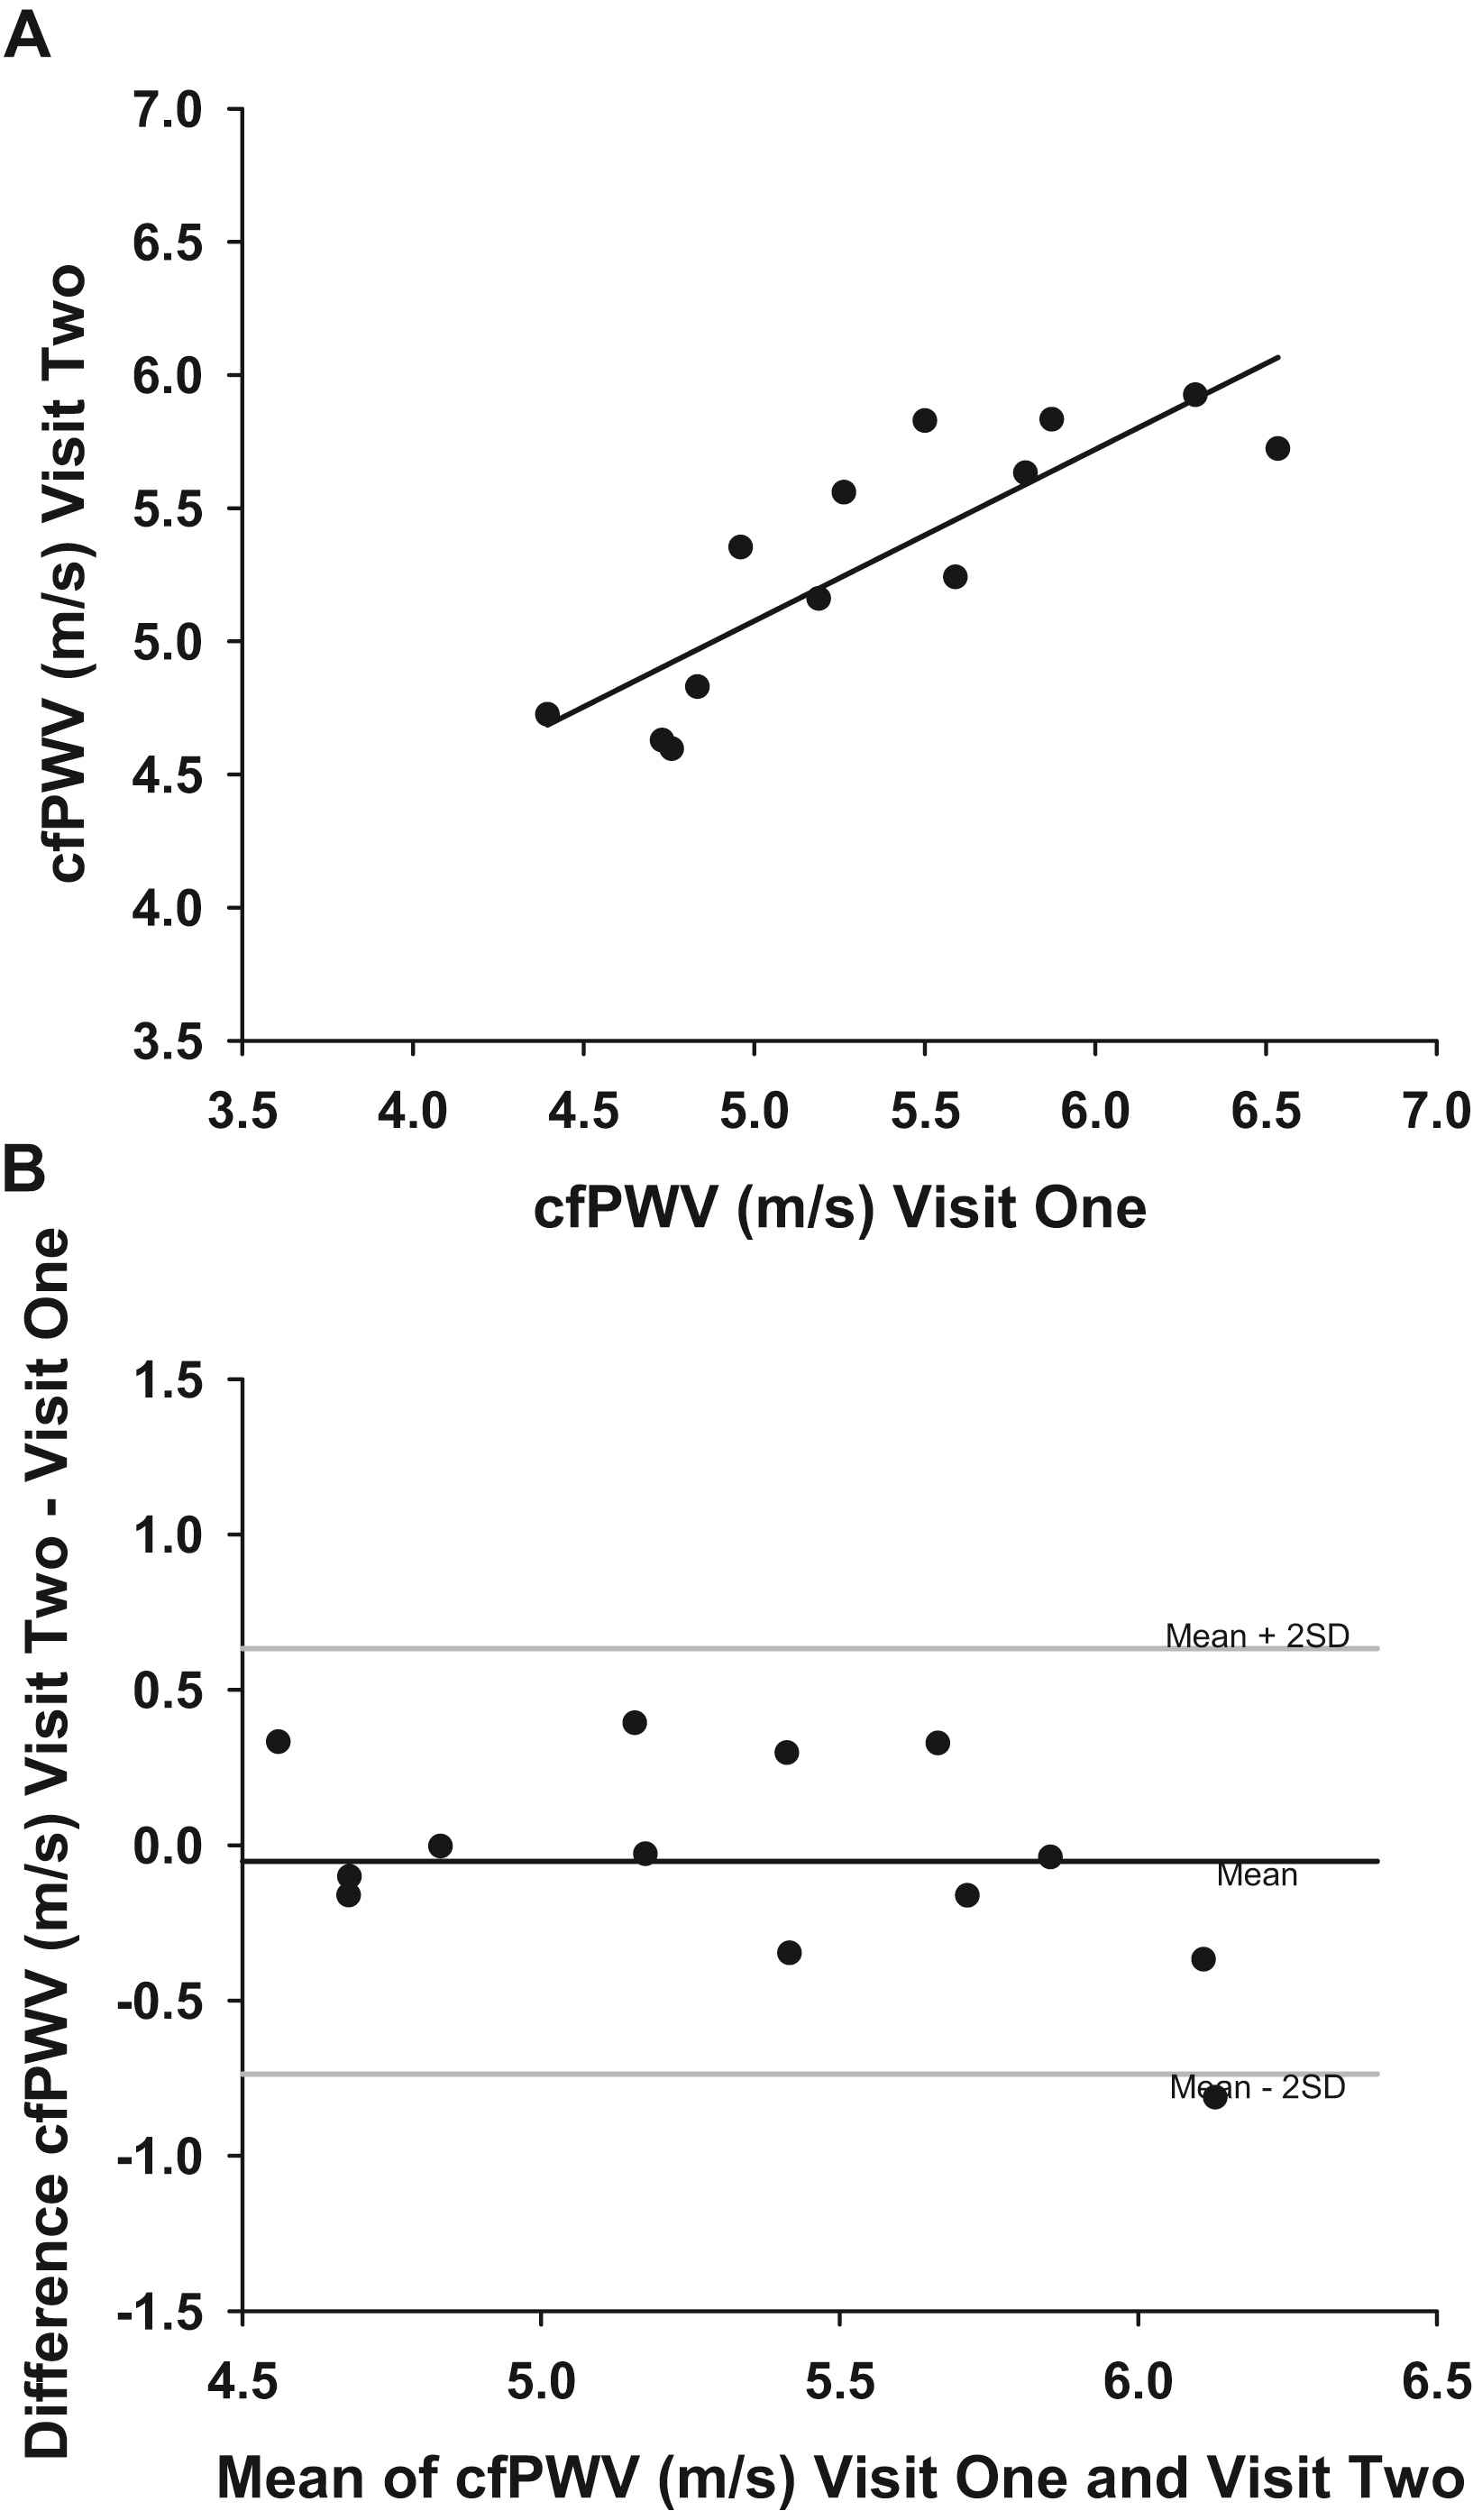
The relationship between carotid-femoral pulse wave velocity (cfPWV) measured at Visits One and Two in the Reliability Trial. Pearson’s test of correlation was employed (r = 0.85, P < 0.01, n = 13) (Fig. 2A). Bland–Altman plot of agreement displaying the difference in cfPWV between visits as a function of the mean of cfPWV across visits in the Reliability Trial. The mean difference between visits (−0.1 m/s; solid black line denoted by mean) and confidence limits of the mean difference (±2 SD: −0.7 to 0.6 m/s; solid gray lines) are plotted (Fig. 2B).
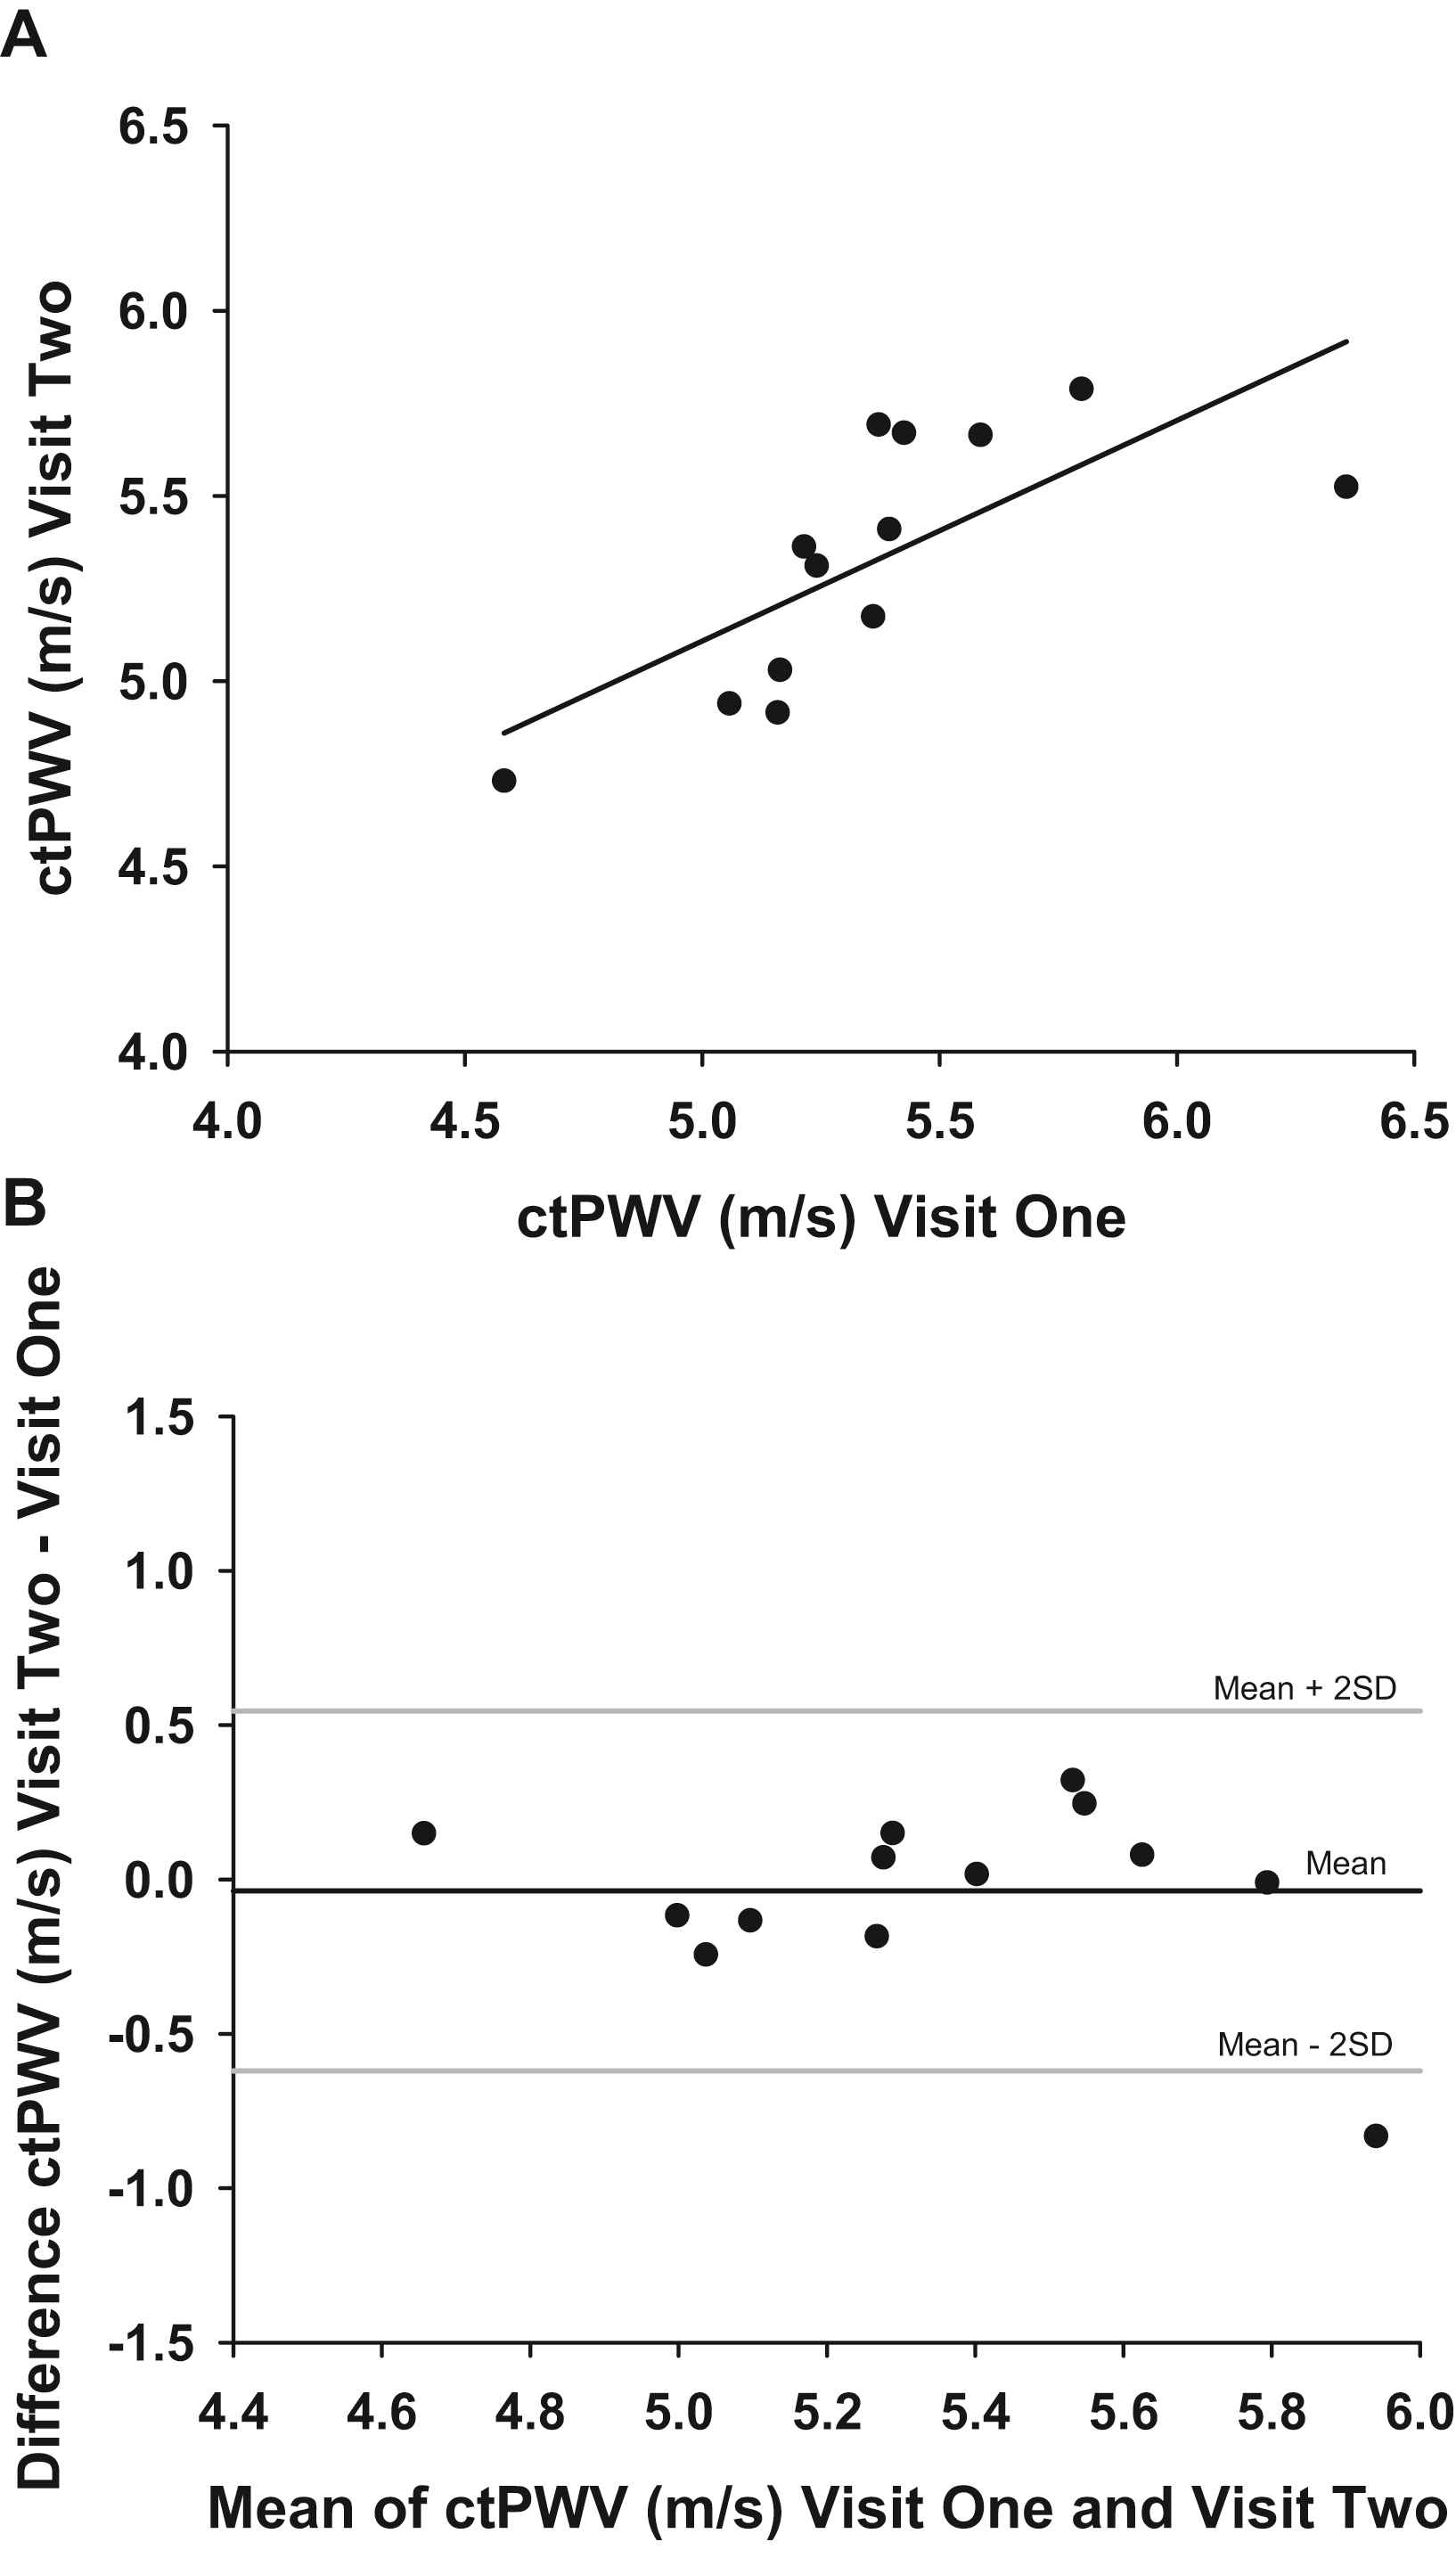
The relationship between carotid-toe pulse wave velocity (ctPWV) measured at Visits One and Two in the Reliability Trial. Pearson’s test of correlation was employed (r = 0.72, P < 0.01, n = 13) (Fig. 3A). Bland–Altman plot of agreement displaying the difference in ctPWV between visits as a function of the mean of ctPWV across visits in the Reliability Trial. The mean difference between visits (−0.04 m/s; solid black line denoted by mean) and confidence limits of the mean difference (±2 SD: −0.6 to 0.5 m/s; solid gray lines) are plotted (Fig. 3B).
Discussion
The current study provides novel data indicating the validity and day-to-day reliability of ctPWV as a measure of systemic arterial stiffness in healthy young adults. Specifically, this investigation identified that 1) ctPWV demonstrated a moderate-to-strong relationship and agreement with cfPWV (i.e., the gold-standard of central arterial stiffness)6 in healthy young individuals, and 2) as indexed by ICC and coefficient of variation, ctPWV reliably assessed arterial stiffness during baseline conditions across days, similar to cfPWV. These findings were supported by inspecting the agreement plots generated using the technique described by Bland and Altman.22 Therefore, in our hands, ctPWV has utility as a measure of systemic arterial stiffness in young, healthy males and females.
To our knowledge, no study has examined the validity of ctPWV as a measure of arterial stiffness, though a previous investigation by our laboratory23 assessed the vascular health of children with a developmental disability using this technique. While differences in study populations prevent comparison, Phillips et al.23 highlighted an important feature of ctPWV: ctPWV can be employed to assess arterial stiffness in populations where palpation of the femoral pressure pulse may induce participant discomfort. In the current study, we extend the utility of ctPWV by quantifying its agreement with cfPWV as well its day-to-day reliability.
To investigate whether ctPWV accurately measures arterial stiffness in healthy young adults, we compared PWV values generated by the carotid-toe method with the gold-standard, cfPWV.6 Three pieces of evidence indicate that ctPWV provided a valid measure of arterial stiffness: 1) ctPWV demonstrated a moderate-to-strong linear relationship with cfPWV (r = 0.79, P < 0.01), 2) ctPWV exhibited a strong ICC (ICC = 0.86, P < 0.01) with cfPWV, and 3) the Bland–Altman plot demonstrated agreement between measures, with the caveat that cfPWV and ctPWV demonstrated proportional bias. Although stiffness estimates produced by ctPWV reflect systemic arterial properties, these findings likely stem from both measures sharing the central arterial path. Indeed, finger-toe PWV demonstrated agreement with an estimate of cfPWV14 and linear correlations yielded a relationship between brachial-ankle PWV and cfPWV.9 Although Pearson’s correlation statistics were calculated for the ctPWV–cfPWV relationship in this study and others investigating similar methodologies, the correlation coefficient should be interpreted with caution as this measure quantifies how tightly the data fall along any line and does not assess absolute agreement.22 However, two additional measures, the ICC and the Bland–Altman agreement plot, both suggested that PWV values generated by the carotid-femoral and carotid-toe methods were comparable. Importantly, our reference standard produced stiffness estimates that were consistent with population representative values.24–26 For example, the participants in the Validity Trial (5.3 ± 0.7 m/s) exhibit similar cfPWV (mean (±2 SD): 6.1 m/s (4.6–7.5 m/s)) as those collected in a sample of 896 young normotensive individuals.26 Therefore, the current findings suggest that ctPWV may provide valid estimates of arterial stiffness in a healthy cohort.
As with any measure of arterial stiffness that circumvents femoral pulse wave acquisition (e.g., ctPWV, brachial-ankle PWV, finger-toe PWV)13,14,27 the peripheral vasculature impacts the estimate obtained. For example, additional analysis in the current study demonstrated a correlation between femoral-toe PWV and ctPWV (r = 0.88, P < 0.01). Similarly, a previous study9 indicated a linear association between brachial-ankle PWV and leg PWV (r = 0.76), suggesting that these measures of stiffness are impacted by the properties of the peripheral vessels. In conjunction with our finding that ctPWV and cfPWV exhibit agreement, these observations support the concept that ctPWV provides an index of systemic arterial stiffness, reflecting the mechanics of the central elastic arteries, as well as the peripheral vasculature of the leg and foot. However, while this composite measure of PWV enables researchers to identify adverse vasculature modifications (at clinical or sub-clinical levels) in populations where femoral pulse wave collection cannot be performed, ctPWV prevents researchers from determining the precise location of arterial modifications in cases where only the central or peripheral vessels are impacted (e.g., some forms of exercise28 and aging8). Also, as this study was performed in young healthy individuals it remains unclear whether populations exhibiting central arterial stiffness such as older individuals and patients with CVD or CVD risk factors will demonstrate agreement between carotid-femoral and ctPWV. Some insight may be gained from the observation that brachial-ankle PWV exhibited a moderate–strong relationship with aortic PWV in a sample of both young and older individuals.9 Moreover, in patients with acute coronary syndrome and community-dwelling older adults, brachial-ankle PWV predicted adverse cardiovascular outcomes and mortality, independent of traditional risk factors.15,16 Further studies are required to examine the cfPWV–ctPWV agreement in patients and older individuals as well as the predictive capacity of this measure.
This study also investigated ctPWV reliability, a critical feature when assessing the validity of a method.29 Importantly, in our hands, ctPWV demonstrated strong reliability, as evidenced by the Bland–Altman plot demonstrating agreement between testing days as well as the day-to-day coefficient of variation and strong ICC. These measures likely underestimate the true reliability of both ctPWV and cfPWV in our hands, as repeated measures were performed across days allowing for external factors (e.g., diet, stress, hydration status) to introduce both hemodynamic and arterial variability. Regardless, the reliability statistics for ctPWV are similar to those reported for finger-toe PWV (coefficient of variation = 4.52%)14 as well as a PWV method that calculates transit time using the ECG R-wave and the pressure waveform at the dorsalis pedis artery (coefficient of variation = 3.5%, ICC = 0.76).27 Importantly, we found the carotid-toe and carotid-femoral measures to demonstrate similar variability across days. Therefore, this measure may be employed by researchers and clinicians as a simple technique to detect arterial modifications, provided other studies demonstrate the reliability of ctPWV.
The current data indicate that ctPWV accurately measured systemic arterial stiffness and consistently assessed vascular properties across days. These conclusions are based on a relatively small sample size of young healthy individuals with normal BP and no history of CVD (discussed above). Due to limitations in equipment availability, CCA and femoral artery tonometry were not performed simultaneously, which may have resulted in the systematic underestimation of cfPWV–ctPWV agreement. However, as no marked changes in HR or BP were observed during the transition from CCA to femoral artery tonometry, we do not regard this as a source of error in our study. Also, while pulse wave transit times were measured accurately, the inability to directly measure pulse wave travel distances likely resulted in either an over- or under-estimation of PWV in this study and others.6 To minimize the potential impact of the distance measurement on variability in this study, standardized measurement protocols were employed. Given that various methods of distance measurement for PWV calculation are often used (e.g., the total distance between proximal and distal pulse wave acquisition sites), the PWV values obtained here may differ from other studies.
Perspectives and significance
This study provides novel evidence to suggest that ctPWV produces a valid and reliable estimate of systemic arterial stiffness that minimizes participant discomfort and eliminates the technical difficulty associated with femoral pulse wave acquisition. This technique may enable researchers to identify novel factors contributing to arterial stiffening, along with new therapies that attenuate deleterious arterial changes in populations where cfPWV cannot be performed. Future research should examine the capacity of ctPWV to measure arterial stiffness at baseline as well as during acute cardiovascular stressors (e.g., orthostatic stress) and/or chronic interventions (e.g., physical exercise) in populations comprised of a wide age-range of healthy individuals and patients with CVD.
Conflict of interest statement
The authors report no conflict of interest.
Acknowledgments
Stephen A. Klassen and Kylie S. Dempster contributed equally to this work. Stephen A. Klassen was supported by the
References
Cite this article
TY  - JOUR
AU  - Stephen A. Klassen
AU  - Kylie S. Dempster
AU  - Daniele Chirico
AU  - Deborah D. O’Leary
PY  - 2018
DA  - 2018/07/28
TI  - Validity and reliability of carotid-toe pulse wave velocity as a measure of arterial stiffness in healthy individuals: Comparison to carotid-femoral pulse wave velocity
JO  - Artery Research
SP  - 32
EP  - 38
VL  - 23
IS  - C
SN  - 1876-4401
UR  - https://doi.org/10.1016/j.artres.2018.07.001
DO  - 10.1016/j.artres.2018.07.001
ID  - Klassen2018
ER  -