
Model-Based Filtering via Finite Skew Normal Mixture for Stock Data
- DOI
- 10.2991/jsta.d.200827.001How to use a DOI?
- Keywords
- Stock of banks and credit institutions; Mixture model; Clustering time series; Multivariate skew normal; GAS model
- Abstract
This paper proposes a flexible finite mixture model framework using multivariate skew normal distribution for banking and credit institutions’ stock data in Iran. This method clusters time series stocks data of Iranian banks and credit institutions to filter those data into four groups. The proposed model estimates matrices of time-varying parameter for skew normal distribution mixture using EM algorithm, updating the estimated parameters via generalized autoregressive score (GAS) model. Empirical studies are conducted to examine the effect of the proposed model in clustering, estimating, and updating parameters for real data from 12 sets of stocks. Our stock data were filtered in four trade clusters with best performance.
- Copyright
- © 2020 The Authors. Published by Atlantis Press B.V.
- Open Access
- This is an open access article distributed under the CC BY-NC 4.0 license (http://creativecommons.org/licenses/by-nc/4.0/).
1. INTRODUCTION
In recent years, clustering algorithms for time series data have found significance because of having a good quality in different kind of applications.
It is specifically useful in stock filtering performance where big databases gathered from market stocks. These data have regularities which can be clustered automatically.
Stock of banks and credit institutions are very diverse in terms of stock trading value, trading volume, growth rate, the first price, the first opening volume, last price, close prices, and the rate of difference between high and low price. Those features help us in clustering time series data representing from market stock. Thus understanding heterogeneous features is of interest and key important in clustering the groups reliably.
Clustering of stocks provides strategies which help the trader of market stocks identify type of banks and credit institution’s stock as the best candidates for buy, the best candidate for sell, as well as developing a watching list controlling for buy and sell.
In this study, we purpose a finite mixture model using Skew Normal Distribution for clustering high-dimensional time series data. The framework estimates a matrix of time-varying parameters and applies updates using score-driven approach proposed by Creal et al. [1], allowing us to robustly cluster the data into approximately homogenous groups.
The skew normal mixture distribution was considered in our proposed model. The main purpose of this model is to deal with data sets that may not be normal and our model is able to robustly cluster and with good performance the high-dimension data that may have an asymmetric- and/or heavy-tailed distribution.
Literature Review
Roengpitya et al. [2], Ayadi et al. [3], and Ayadi and Groen [4] illustrated cluster analysis to identify bank business models. Ahmadzadehgoli [5] proposed The LINEX Weighted k-Means Clustering and Andre Lucas(2017) introduced a finite mixture model for multivariate normal and t distribution which updated parameters using score-driven approach. Creal et al. [1] and Harvey [6] introduced generalized autoregressive score (GAS) model for updating time-varying parameters while Ayadi and Groen [4] explained static clustering methods with dynamic parameters. Catania [7] provided an example of dynamic clustering with dynamic parameters. He proposed a score-driven mixture model and used score-driven updates for all parameters that required a large number of observations.
Finally we applied our model to a multivariate panel of N = 12 stock data of banks and credit institutions for the period 2019/6- 2019/10, i.e., over T = 90 days in 18 week with P = 8 indicator variables for L groups of similar stock data of banks and credit institutions. We identified L = 4 trade model components and illustrated properties of each of group.
In addition, our study contributes to literature on statistic clustering of time series data for stocks (Roengpitya et al. [2], Ayadi et al. [3], and Ayadi and Groen [4]) by identifying stock trade model because we believe the properties of stock models are unlikely to switch their trade model over a short-term period (see, e.g., Ayadi and Groen [4]). This article is organized in 4 sections. In Section 2, we introduce the finite mixture model for skew normal distribution and estimate matrix of parameters using EM algorithm and updating parameters via GAS model through the score-driven approach. Section 3 explains an empirical study of stock data from banks and credit institutions in Iran, and a brief conclusion is presented in Section 4. Note that in this paper all of computations were run using R program.
2. INTRODUCING THE MODEL
2.1. Mixture Model
Let
It suffices to note that all observations were stacked into the matrix
To compute likelihood function by a standard prediction error we have
As is common in our model, we do not estimate
Since
In the E-Step, the hidden indicator probabilities are updated using
It is important to note that
2.2. Updating Dynamic Parameters
Now in this section we use the score-driven approach proposed by Creal [1] to formulate dynamic parameters
2.2.1. Mean
As explained above, we use the score-driven approach as discussed in Lucas and Zhang [12]:
Then we formulate updating mechanism as follows:
2.2.2. Covariance matrix
Using the same calculations and the score-driven approach, we have
As before
Then we formulate the updating mechanism as follows:
After updating parameters using equations (10) and (13), we compute
3. EMPIRICAL STUDY
3.1. Data
In this section we use an empirical example to examine the ability of our proposed model. The sample studied here contains N = 12 stocks of banks and credit institutions for the period 2019/6-2019/10. This covers T = 90 day. We accept that drivers in stocks trade model can be characterized by four dimensions as shown in Figure 1. The best candidate for buy, the best candidate for sell, the watching list controlling for buy and sell.
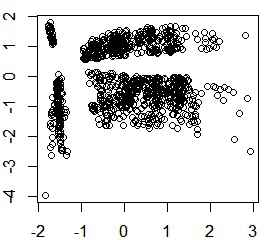
Real stock data of banks and credit institutions in Iran
We select a set of P = 8 features from these four categories. We consider stocks’ trading value, trading volume, growth rate, the first price, the first opening volume, last price, close prices, and the rate of difference between high and low price.
3.2. Model Selection
In this section, the number of clusters for our empirical analysis was selected using some of well-known criteria, i.e., Akaike information criterion (AIC), Bayesian information criterion (BIC), Davies-Bouldin index (DBI), and silhouette index (SI). The purpose of this criterion is to evaluate the structure of clusters created by clustering algorithms. Many criteria have been introduced to evaluate the accuracy of the clustering results.
These indices try to measure the similarity of members within the cluster and the similarity between the clusters. Therefore, the appropriate method is the one that results in the highest level of similarity within a cluster or the greatest differentiation between clusters.
As a likelihood-based model was utilized here, we used standard-likelihood-based criteria, including AIC and BIC, to determine the number of clusters (Hurvich and Tsai [14] and Bai and Ng [15]). The smaller are the values obtained for these two criteria, the more accurate will be the number of clusters. The silhouette index (SI, see de Amorim and Hennig [16] and Davies–Bouldin index (DBI, see Davies and Bouldin [17] criteria express the greatest similarity within a cluster, and larger values found for these two criteria indicate a better choice in terms of selecting the number of clusters. The results are presented in Table 1.
| Index | DBI | SI | AIC | BIC |
|---|---|---|---|---|
| L = 2 | 0.5769 | 0.5296 | 19.6562 | 1901.23 |
| L = 3 | 0.5615 | 0.4552 | 13.6587 | 2851.70 |
| L = 4 | 0.5831 | 0.5570 | 17.5505 | 1802.14 |
| L = 5 | 0.6683 | 0.6292 | 21.4242 | 4752.62 |
Table 1 presents likelihood-based (AIC, BIC) and distance-based (DBI, SI ) information criteria indices for different values of L = 2,…,5. The minimum value (AIC, BIC) and maximum value (DBI, SI ) of components suggested L = 4.
Information criteria.
3.2.1. Discussion of stock’ trade model
In this section, L = 4 different component densities are applied to different business models. We label a trade model on each cluster as illustrated in Figure 2 which plots the stock trade model for each feature characterization.
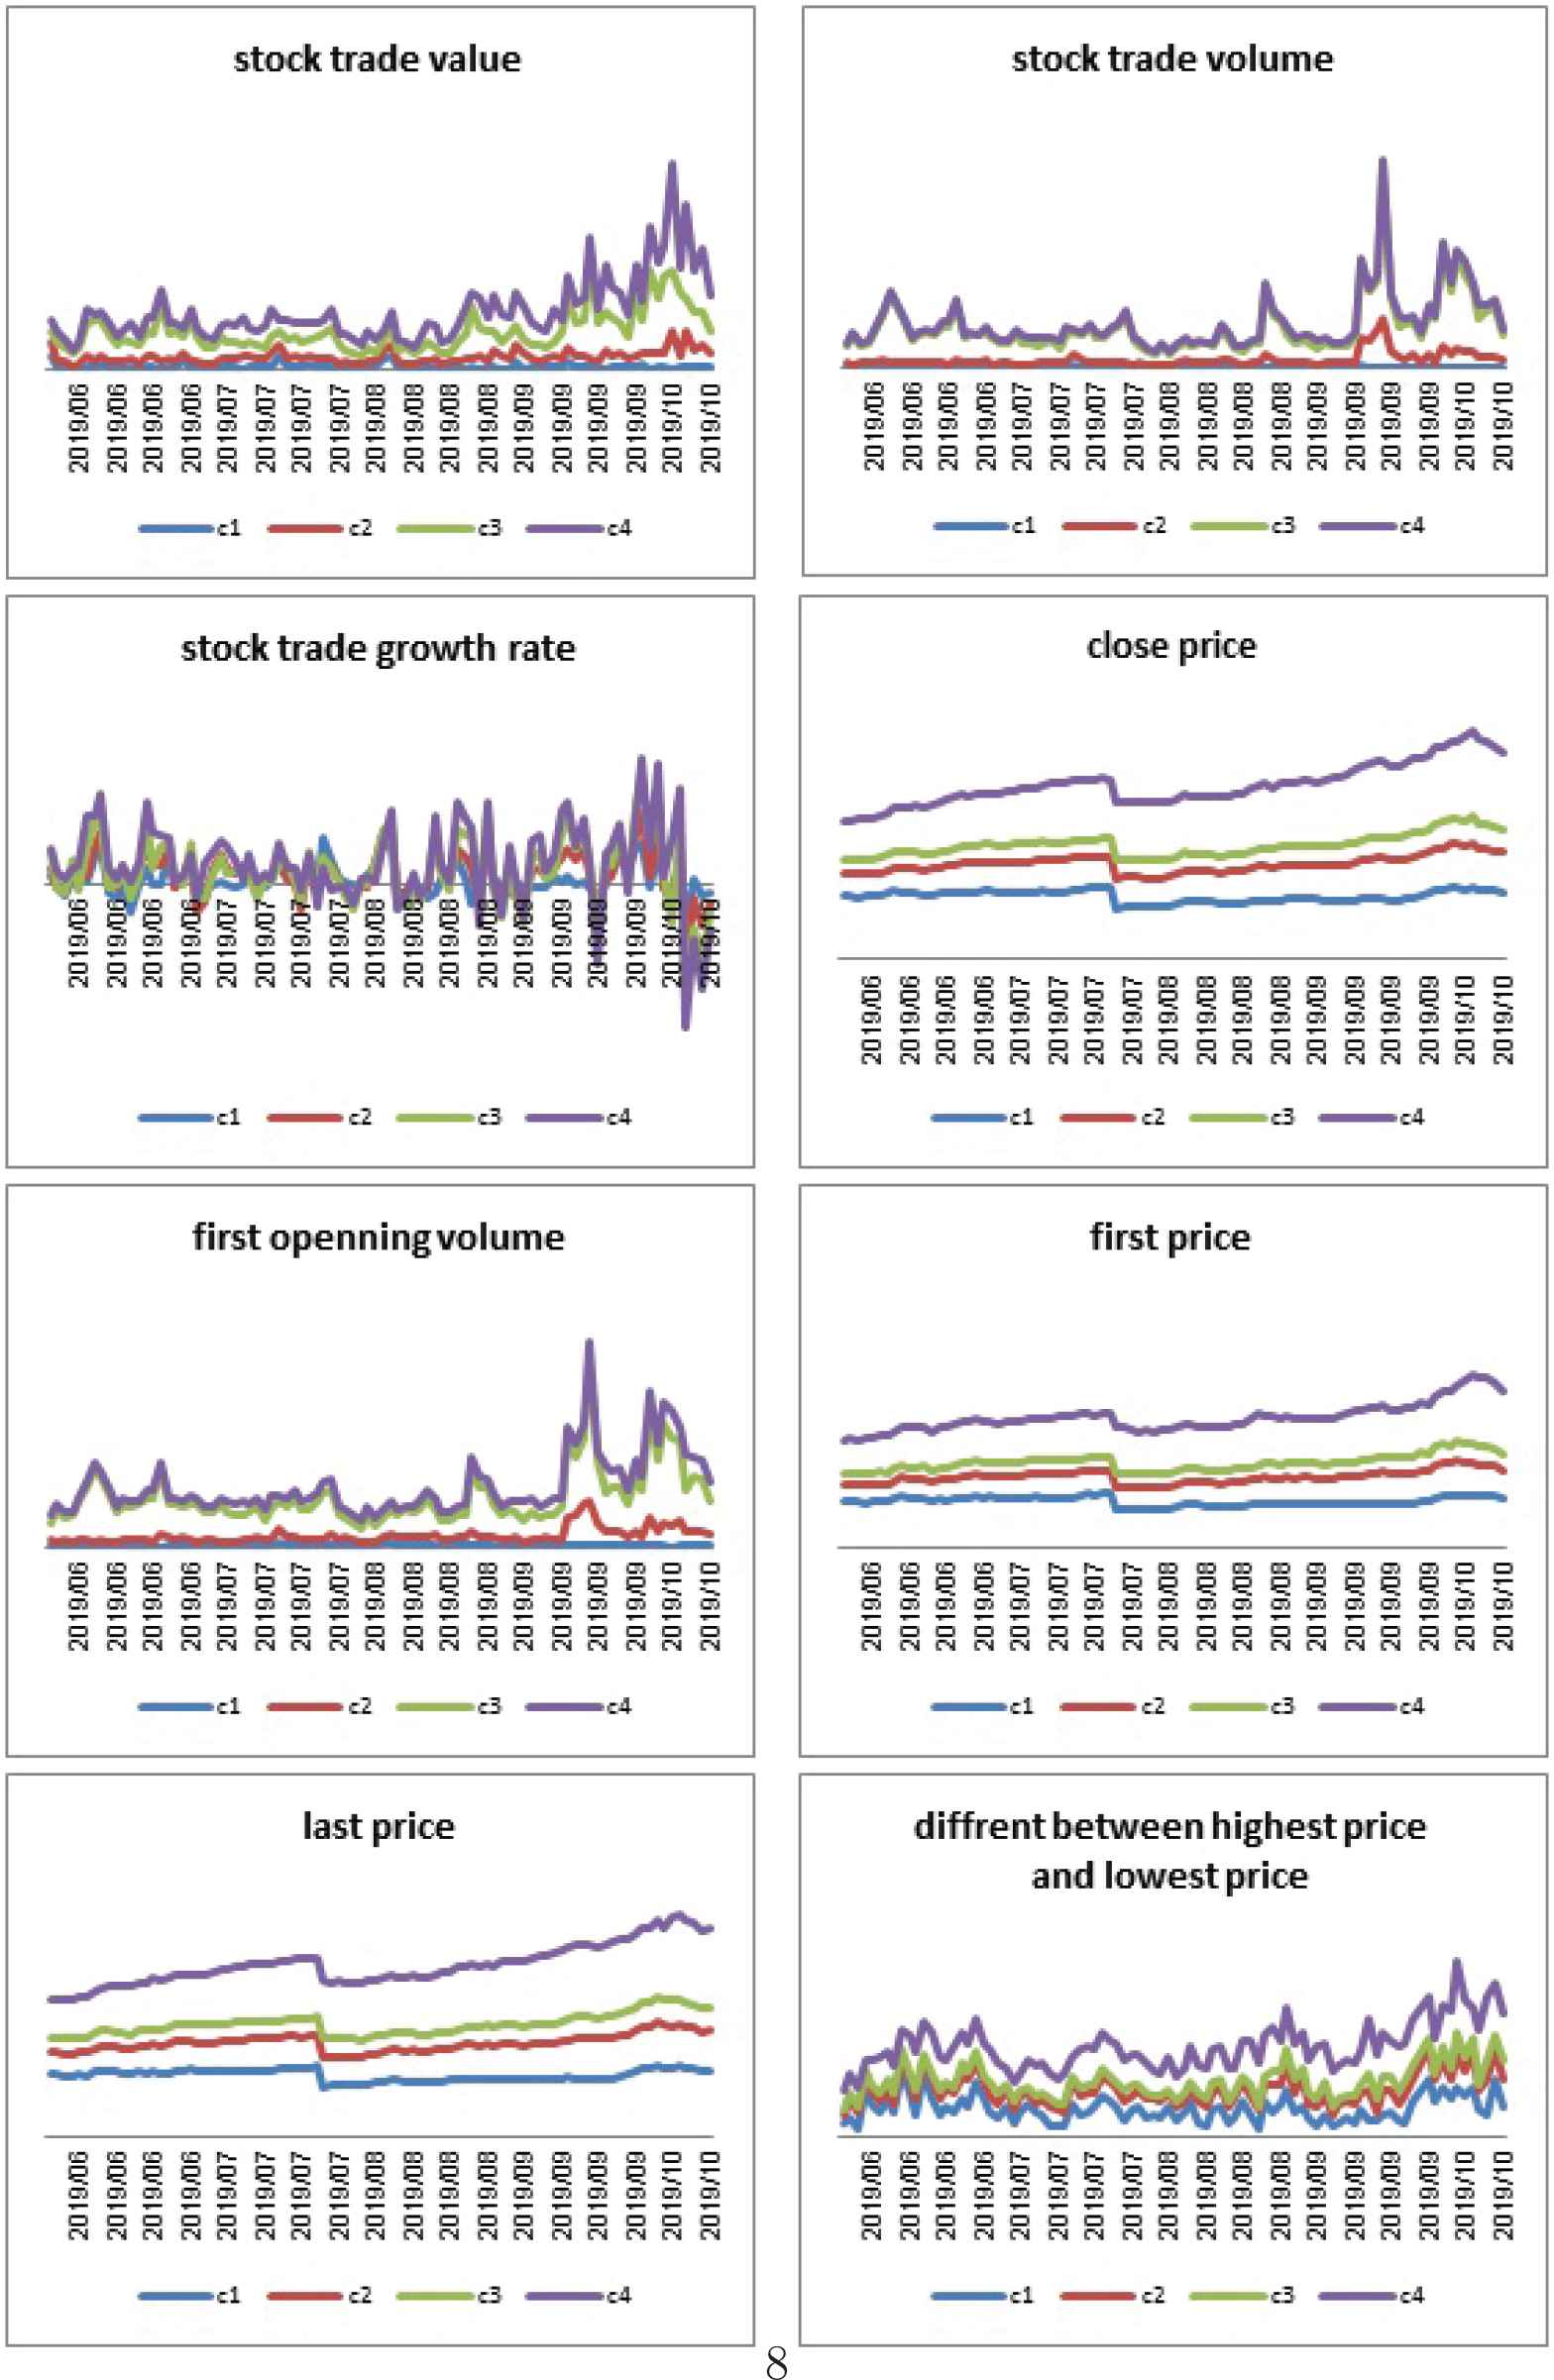
Time-varying component medians. C1: The best candidate for sell, C2: Watch list controlling for sell, C3: Watch list controlling for buy, C4: The best candidate for buy.
(C1) The best candidate for sell (8.33 of firms; e.g., Middle East Bank)
(C2) Watch list controlling for sell (41.66 of firms; e.g., Saderat Bank, Parsian Bank, Sina Bank, Karafarin Bank, Melal Credit Institution)
(C3) Watch list controlling for buy (16.67 of firms; e.g., Tejarat Bank, Pasargad Bank)
(C4) The best candidate for buy (33.34 of firms; e.g., Melat Bank, Eghtesad Novin Bank, Dey Bank, Post Bank)
The best candidate for sell (blue line): These stocks belong to banks and credit institutions that have the lowest trading volume, value of trade, and daily growth rate over a 90-day period. These stocks are the best choice for selling.
Watch list controlling for sell (red line): This cluster shows the stocks ranked as the second lowest in terms of volume, trading value, and daily growth rate over the same period. These stocks are best candidate on the watch list for sale.
Watch list controlling for buy (green line): These stocks belong to a category that ranks the second highest in terms of volume, trading value, and daily growth rate over the same period. These stocks are best placed on the watch list for purchase.
The best candidate for buy (Purple line): These banks and credit institutions have the highest trading volume, value of transactions, and daily growth rate over same time. These stocks are the best choice for buying.
4. CONCLUSION
We proposed a novel finite mixture model for studying stock data, constructing time-varying component parameters matrices, and providing a skew normal distribution mixture. The advantage of using this model over other models is its performance in robust clustering when dealing with any type of data. In an empirical example, we clustered 12 sets of stocks for Iranian banks and credit institutions into four trade model components. The result indicated clusters that recommend selling or buying and controlling for selling and buying.
ACKNOWLEDGMENTS
The authors acknowledge that this article is not in the “conflict of interest” and “author involvement” of others. There is also no “budget statement” for this article. We also appreciate from Referee and associate editor who led to a number of improvements.
REFERENCES
Cite this article
TY  - JOUR
AU  - Solmaz Yaghoubi
AU  - Rahman Farnoosh
PY  - 2020
DA  - 2020/09/08
TI  - Model-Based Filtering via Finite Skew Normal Mixture for Stock Data
JO  - Journal of Statistical Theory and Applications
SP  - 391
EP  - 396
VL  - 19
IS  - 3
SN  - 2214-1766
UR  - https://doi.org/10.2991/jsta.d.200827.001
DO  - 10.2991/jsta.d.200827.001
ID  - Yaghoubi2020
ER  -