
Years Lived with Disability due to Alzheimer’s Disease and Other Dementias in Asian and North African Countries: A Trend Analysis
- DOI
- 10.2991/jegh.k.190305.002How to use a DOI?
- Keywords
- Alzheimer; Africa; Asia; dementia; trend
- Abstract
In Asia, which has a rapidly aging population, dementia is the most prominent disease. This article presents an application of Latent Growth Mixture Model (LGMM) to identify classes of individual Alzheimer’s Disease (AD) and other dementias Years Lived with Disability (YLD) rates for Asian and North African countries based on the unobserved heterogeneity. The AD and other dementias YLD data for both sexes and age-standardized groups reported by the Global Burden of Disease (GBD) Study database during 1990–2015 for 55 Asian and North African countries were analyzed via LGMM. Findings of LGMMs identified four classes of YLD trajectories. Among the specified classes, a class was related to a single country (Turkey) with the highest starting point in 1990 (intercept of 218.52 per 100,000) and upward trend. Another class with increasing trend (a slope of 2.66 per 100,000) consisted of India, China, Singapore, Japan, and Egypt. Other countries in Asia and North Africa (Classes 3 and 4) had a downward trend of YLD rates. The upward trend for some parts of Asia and North Africa might be attributed to appropriate therapeutic strategies, higher levels of awareness, related medical cares, and increase in life expectancy in these countries.
- Copyright
- © 2019 Atlantis Press International B.V.
- Open Access
- This is an open access article distributed under the CC BY-NC 4.0 license (http://creativecommons.org/licenses/by-nc/4.0/).
1. INTRODUCTION
Dementia is caused when the brain is damaged by some diseases [1]. This disease is one of the major causes of disability as well as mortality and has a wide-ranging effect on individuals, their caregivers, health system, and society [2]. Based on the World Health Organization (WHO) report, the total number of new cases of dementia each year is about 7.7 million worldwide, which means one new case every 4 seconds [3,4]. Alzheimer’s Disease (AD) is the most common subtype of dementia, accounting for 50–75% of the total number of cases. These alarming reports indicate that AD has become a major public health concern throughout the world that requires large amounts of financial resources for providing healthcare efficiently [3,5]. AD patients in developing countries generally receive informal care at their homes, whereas in the developed world they routinely receive long-term care in special centers [6]. However, the necessity of persistent care and therapy for these patients imposes a heavy economic burden on patients, families, and the society in both developed and developing countries [7]. Thus, even only 1 year of delay in initiation of treatment for AD patients considerably increases the global burden of this disease [8].
According to previous publications, dementia Disability-adjusted Life Year (DALYs) increased by 113% for the period 1990–2010, which was the largest value in the world compared with other diseases (e.g., cardiovascular disease, diabetes, and cancer). Furthermore, according to the WHO, it has been estimated that dementia is the 11th leading cause of Years Lived with Disability (YLD), accounting for about 2.0% of the total global YLDs [9]. Nevertheless, epidemiological studies have rarely reported AD YLD rates in different regions of the world.
In Asia, the most populous of all continents, this trend of aging populations has led to an ever-increasing number of diseases, particularly dementia, over the past few decades. This is a special concern for longevity and poses major challenges to healthcare systems in this region. By reviewing the Global Burden of Disease (GBD) data, we could observe a significant variation in AD and other dementias YLD rates across different regions of Asia and North Africa from 1990 to 2015, which may lead to the appearance of latent subpopulations of YLD trajectories. This possibility is due in part to different demographic, education, genetics, and other unknown factors [10]. Although this study has gained access to a few valuable papers on AD and other dementias, there has not been any published article about assessing the trend of YLD for North African and different Asian regions. With this goal, we applied a Latent Growth Mixture Modeling (LGMM) approach to cluster these countries to describe the unobserved heterogeneity of their trend in AD and other dementias YLD rates during the 25-year period of 1990–2015.
2. MATERIALS AND METHODS
2.1. Data Source
The reported estimates from the GBD study, carried out by the Institute for Health Metrics and Evaluation (IHME), present the burden level of a wide range of diseases based on associated disability and mortality in different regions of the world during the past decades. These estimates are available as CSV files, presented separately for each world super-region, region, and country. The files contain relevant metadata about the input sources as suggested in the Guidelines for Accurate and Transparent Health Estimates Reporting (GATHER) [11]. Appendix 1 in Supplementary Files provides the GATHER checklist of 18 items that are essential for reporting global health estimates.
In this research, we used the registered AD and other dementias YLD data for both sexes and age-standardized groups from the GBD online database between 1990 and 2015 for 55 Asian and North African countries. According to these data sets, the Asian and North African countries were divided into six different regions based on their geographical and economic conditions: Central Asia (CA), High-income Asia Pacific (HIAP), North Africa and Middle East (NAME), South Asia (SA), Southeast Asia (SEA), and East Asia (EA). In this research, the main outcome under study was YLD for people living with AD and other dementias. To achieve the primary target of the study (assessing the overall pattern of changes in YLD rate), we used the Latent Growth Curve Modeling (LGCM) approach, separately for six described regions. In addition, to attain the second objective of the study (exploring clusters of countries according to their YLD rate trend), we utilized the LGMM technique.
2.2. Statistical Analysis
In recent years, LGMM as an extension of LGCM has become a popular approach for identifying multiple unobserved subpopulations (latent classes), and to assess longitudinal change within each latent class. In fact, in LGMM, individuals are classified into subpopulations using a latent variable based on unobserved heterogeneity. This heterogeneity is most often attributable to within-subject (intraindividual) and between-subject (interindividual) variations. Latent variables are not directly observed but are derived from measured or directly observed variables [12].
In this paper, LGMM explains the unobserved heterogeneity among countries in their longitudinal trend and classifies them according to the intercept and the slope of their trend [13]. In representation of LGMM, an individual has a certain trajectory class membership that changes over time. For an individual i in the latent categorical class k (k = 1, 2, …, K) at time t, the unconditional LGMM (i.e., without covariates) can be mathematically expressed as Equation (1):
In summary, we first applied six single-group models (non-mixture, LGCM) to determine the overall pattern of AD and other dementias YLD rates, separately for each of the regional levels over the study period. After that, multiple LGMMs with different number of latent classes were fitted for classifying the countries. To determine the final model with optimal number of latent class, some goodness-of-fit statistics such as Akaike Information Criteria (AIC), Bayesian Information Criterion (BIC), and also Lo–Mendell–Rubin Likelihood-ratio Test (LMR-LRT) were utilized. With regard to AIC and BIC, the lowest values represent the best fit. Likewise, a significant LMR-LRT for a particular number of classes (p < 0.05) indicates the model with the best fit. All analyses of data were implemented in Mplus version 6.12 (Muthén & Muthén, CA, USA, www.statmodel.com) and R version 3.1.2 software (www.R-project.org).
3. RESULTS
Generally, YLD rates (per 100,000 individuals) were studied for 55 countries from different regions of Asia and North Africa during 1990–2015. Figure 1 illustrates the trends in age-standardized YLD rates for each region over time. As shown, the YLD rates for SA have decreased slightly over time until 2000 and had a sharp increase from 2000 to 2015. Meanwhile, EA had a moderate decreasing trend till 1995 and then had a steep increment between 1995 and 2015. In HIAP, there was an upward trend, but not regularly over time. For other regions, the trend of YLD rates remained steady across the six time points: 1990, 1995, 2000, 2005, 2010, and 2015. Table 1 shows the YLD rates and 95% uncertainty intervals for each of the regions during the study period. Based on this table, the highest and lowest YLD rates in 1990 (starting point of the research) and 2015 (end of point of the research) could be respectively observed in NAME (177.66 and 177.25 per 100,000, respectively) and SA (89.54 and 99.86 per 100,000, respectively). Additionally, the last row of the table could provide general information about the trend in YLD rate for all regions. As observed in this row, the YLD rate had a sharp decrease until 2005, and then exhibited a nearly fixed trend between 2005 and 2015. Figure 2 displays maps of the age-standardized YLD rates in each of the 55 countries from 1990 to 2015. During this time, India, Japan, and Singapore showed the greatest change in YLD rate. Furthermore, Figure 3 shows the ranking of YLD rates in the studied regions. As seen, NAME, HIAP, SEA, and SA regions had a fixed rank in YLD rate during the studied period. In contrast, the rank of YLD rates for CA and EA regions showed changes between 1990 and 2015.
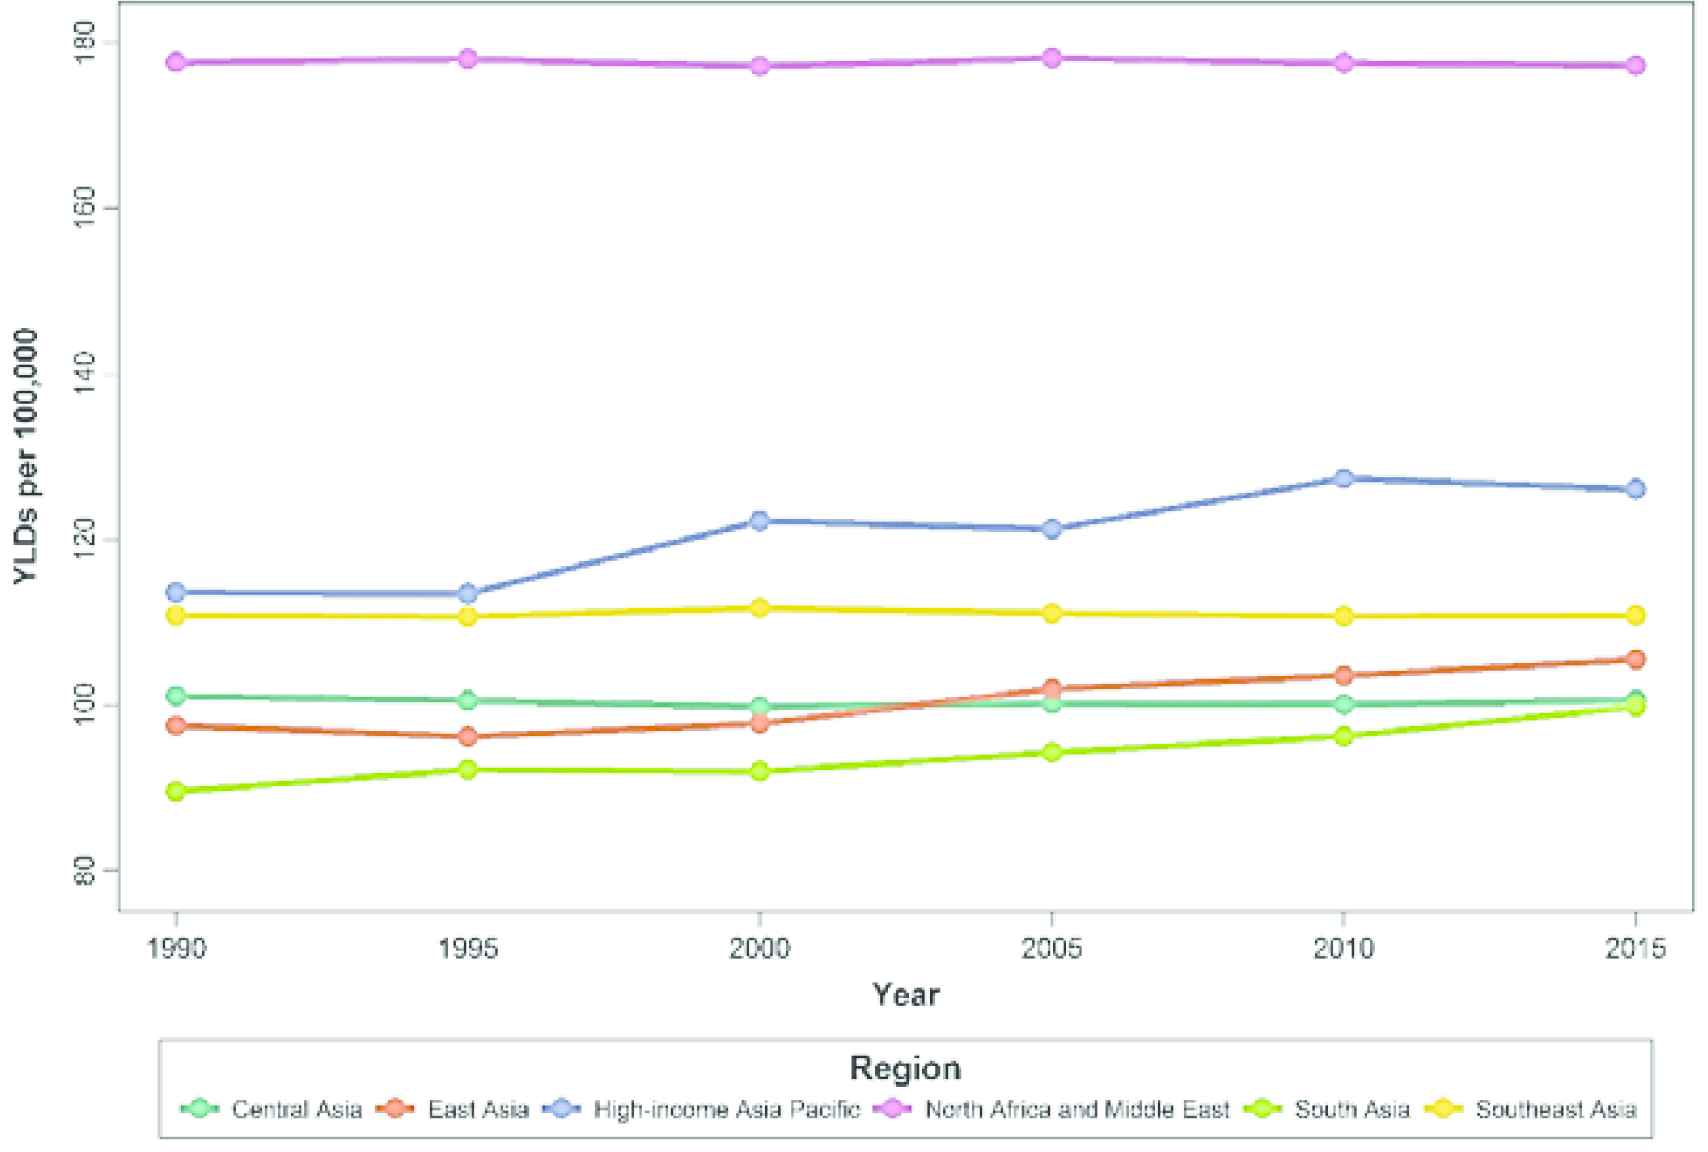
The trend of age-standardized YLD rates in each region from 1990 to 2015. YLD, years lived with disability.
| Region | Year | |||||
|---|---|---|---|---|---|---|
| 1990 | 1995 | 2000 | 2005 | 2010 | 2015 | |
| NAME | 177.66 (126.55, 236.48)a | 178.04 (127.20, 234.33) | 177.16 (126.64, 233.80) | 178.16 (126.50, 236.06) | 177.56 (126.21, 235.95) | 177.25 (125.99, 236.29) |
| HIAP | 113.57 (80.64, 151.08) | 113.43 (80.25, 151.09) | 122.26 (86.42, 161.85) | 121.27 (85.82, 160.67) | 127.36 (89.47, 169) | 126.08 (88.80, 168.41) |
| CA | 101.09 (71.46, 135.76) | 100.56 (70.60, 134.71) | 99.80 (70.09, 134.04) | 100.20 (70.64, 134.69) | 100.12 (70.57, 134.55) | 100.62 (71.09, 134.83) |
| SA | 89.54 (63.74, 119.23) | 92.20 (65.88, 123.18) | 91.97 (65.49, 122.64) | 94.27 (67.09, 125.43) | 96.22 (68.21, 128.91) | 99.86 (71.03, 133.74) |
| SEA | 110.81 (78.21, 149.08) | 110.70 (78.79, 149.57) | 111.74 (79.54, 151.48) | 111.09 (78.92, 149.17) | 110.71 (78.97, 149.66) | 110.82 (78.45, 149.28) |
| EA | 97.55 (68.87, 131.38) | 96.19 (67.65, 128.68) | 97.77 (69.32, 130.99) | 101.97 (72.17, 137.41) | 103.57 (73.16, 139.77) | 105.50 (74.14, 142.25) |
| All regions | 130.25 | 129.88 | 129.74 | 120.97 | 129.86 | 129.67 |
Data in parenthesis are the lower and upper bands of YLD rate.
CA, Central Asia; EA, East Asia; NAME, North Africa and Middle East; SA, South Asia; SEA, Southeast Asia; SE, standard error; YLD, years lived with disability.
Value of age-standardized Alzheimer’s disease and other dementias YLD rates per 100,000 persons
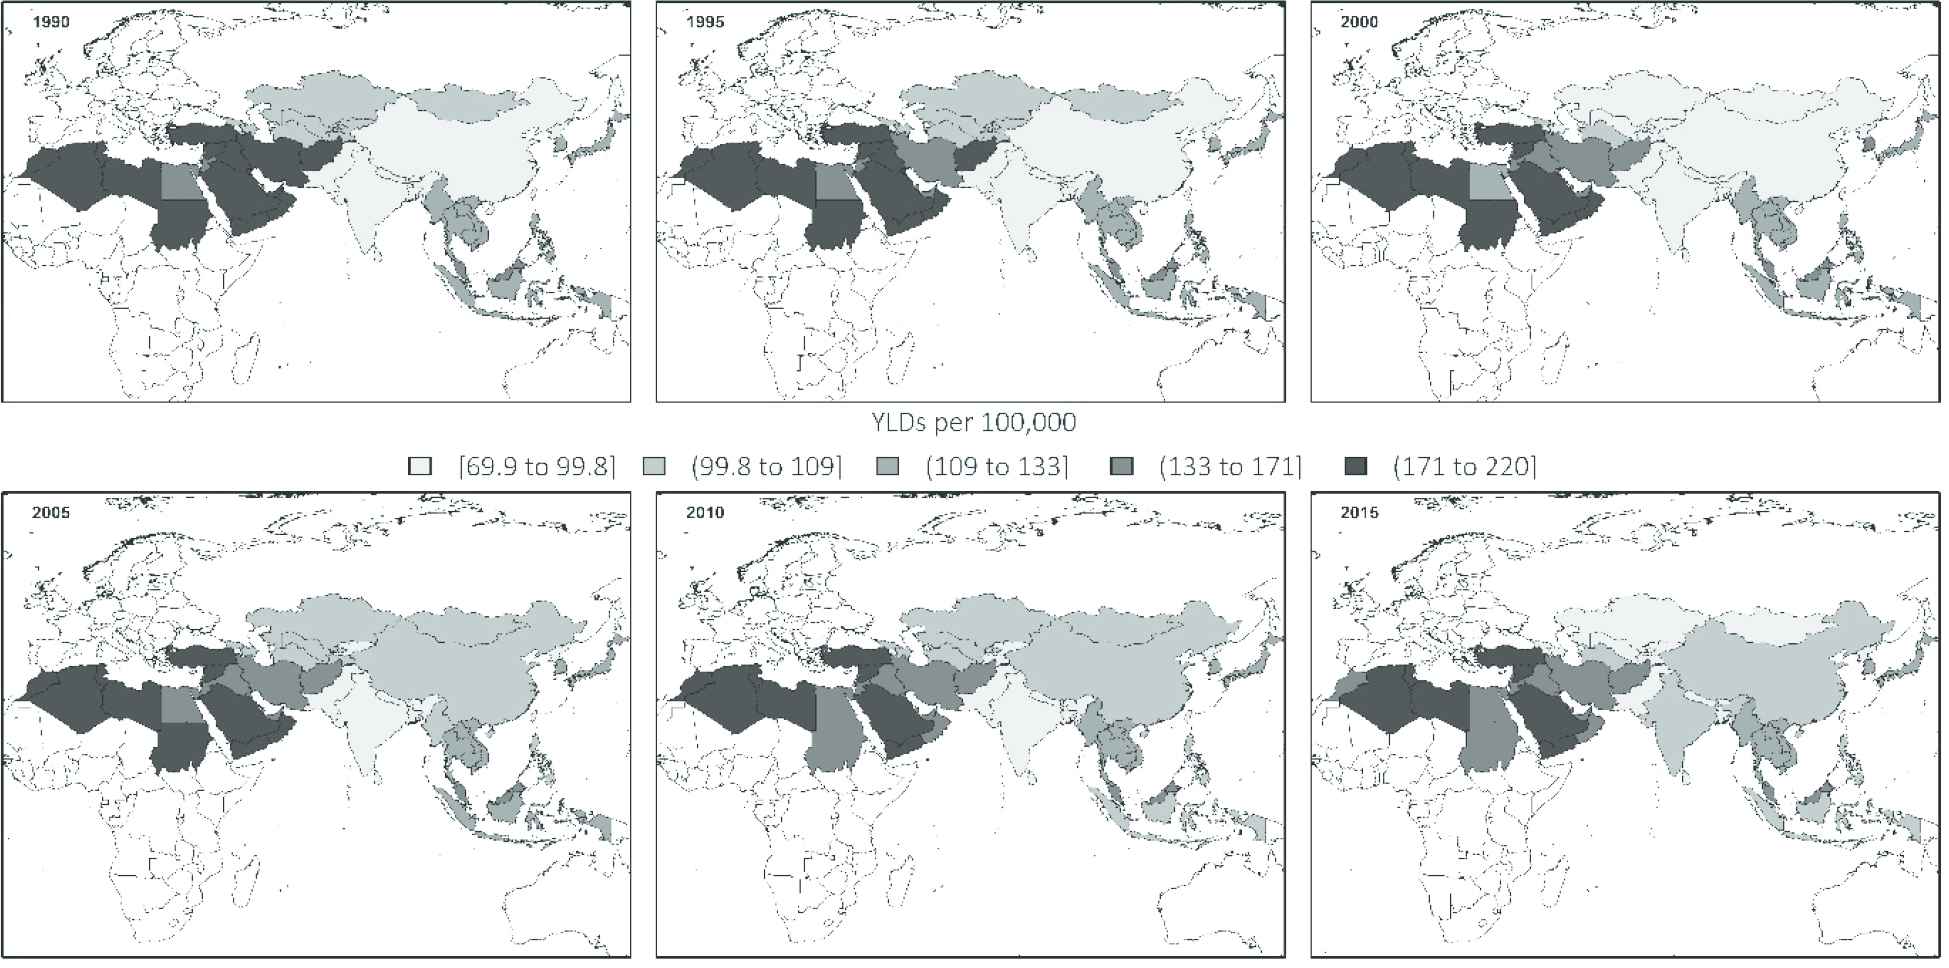
The geographical distribution of age-standardized YLD rate per 100,000 persons between 1990 and 2015. YLD, years lived with disability.
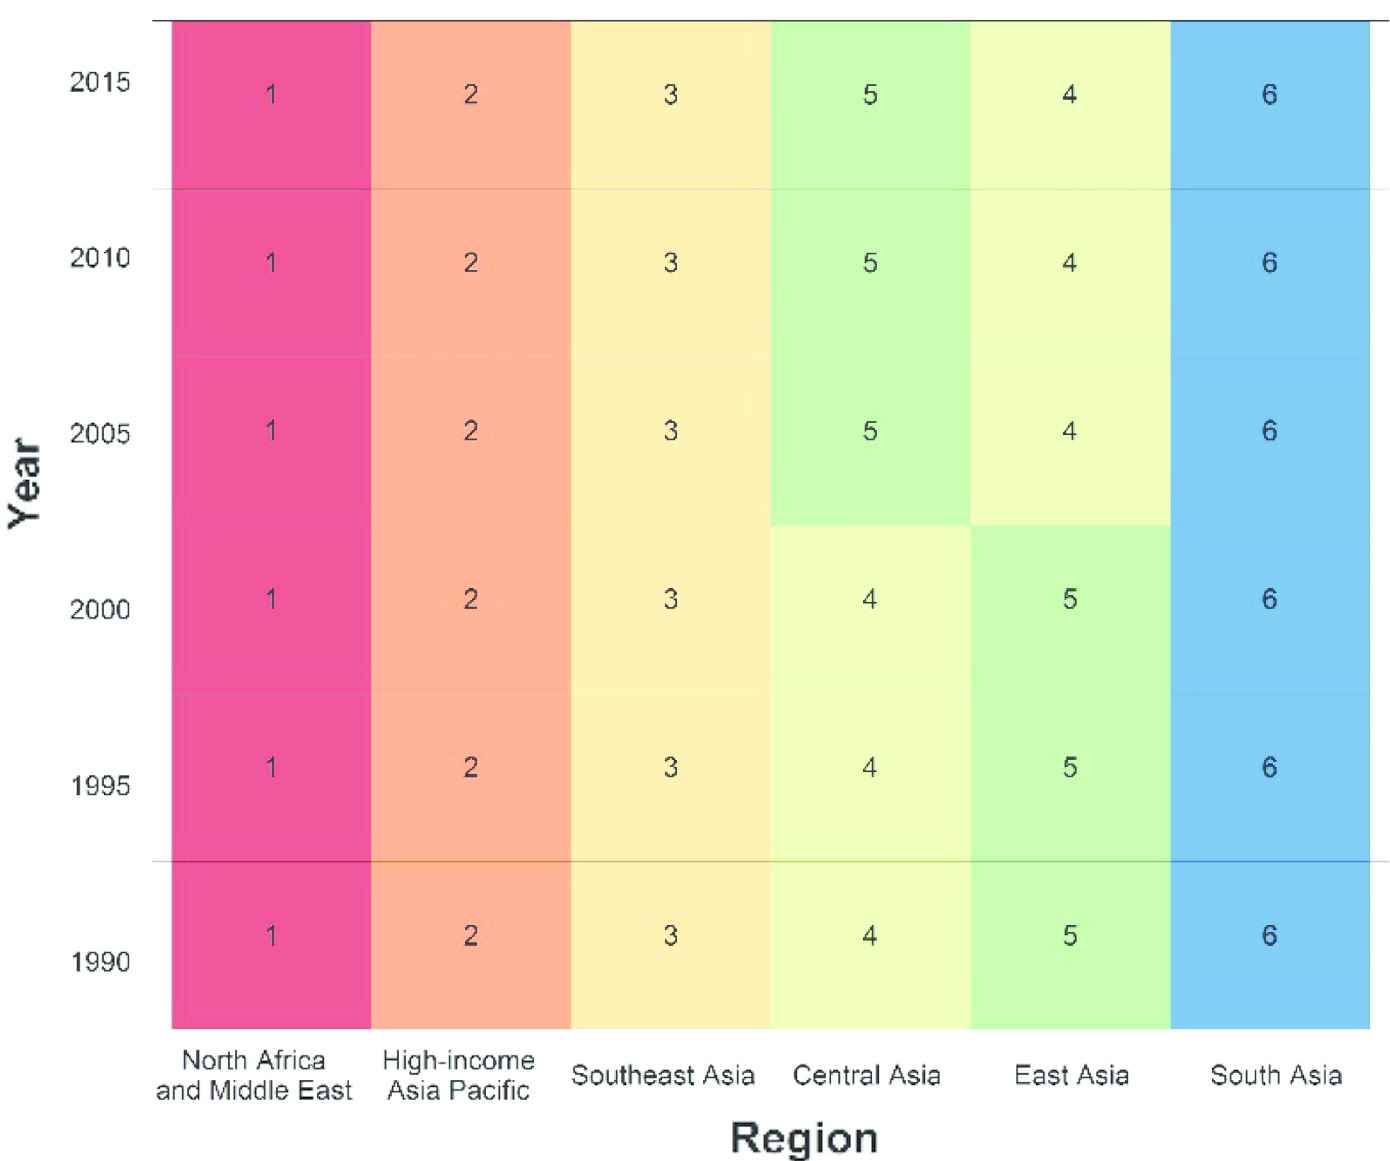
Ranking of age-standardized YLDs rate per 100,000 persons by the studied regions during 1990–2015. YLD, years lived with disability.
To summarize the results of fitting LGCM, the reported mean intercepts and slopes could be compared. Table 2 provides the regression path estimates of LGCM in selected IHME regions. More specifically, the estimated mean intercepts and slopes for each regional level had information about initial (baseline) levels and rates of change in YLD over time. At first glance, comparison of the mean intercepts revealed that North African and Middle Eastern and South Asian countries had the highest and lowest estimated YLD rates in the starting year of the study, with 173.77 and 104.50 per 100,000, respectively. Moreover, the negative values of the mean slopes suggested the downward trends of YLD rates over time in three regions: NAME, CA, and SEA. SA was the only region with an upward trend during this period. Furthermore, the findings indicated that the highest decreasing slope was related to the North African and Middle Eastern countries in this period. The last row of Table 2 displays the overall mean level of initial AD and other dementias YLD rate in 1990 and the average rate of change over time for all regions. As can be seen, the estimated slope demonstrated a downward trend of 0.07 for these countries between 1990 and 2015. This small estimate of the slope showed a nearly fixed trend in YLD rates for all Asian and North African countries. Figure 4 shows a bar graph with 95% confidence interval for the slope of trends in each region. Furthermore, the statistically significant random effects for all regions (results are not shown) revealed a remarkable heterogeneity among these countries in terms of their baseline values and slopes (p < 0.001). Regarding this heterogeneity in YLD rates, we applied the LGMM methodology to reclassify these countries based on their trends during 1990–2015.
| Region | Intercept | Slope | ||
|---|---|---|---|---|
| Mean | SE | Mean | SE | |
| NAME | 173.77 | 3.10 | –0.08 | 0.03 |
| HIAPa | – | – | – | – |
| CA | 100.59 | 0.21 | –0.03 | 0.01 |
| SA | 104.50 | 13.04 | 0.19 | 0.11 |
| SEA | 111.29 | 3.48 | –0.01 | 0.02 |
| EAa | – | – | – | – |
| All regions | 129.99 | 5.00 | –0.006 | 0.02 |
Not fitted LGCM, because of inadequate number of countries.
AD, Alzheimer’s disease; CA, Central Asia; EA, East Asia; HIAP, high-income Asia Pacific; IHME, Institute for Health Metrics and Evaluation; LGCM, latent growth curve modeling; NAME, North Africa and Middle East; SA, South Asia; SEA, Southeast Asia; SE, standard error; YLD, years lived with disability.
Parameter estimates of age-standardized AD and other dementias YLD per 100,000 persons in the LGCMs by selected IHME regional levels
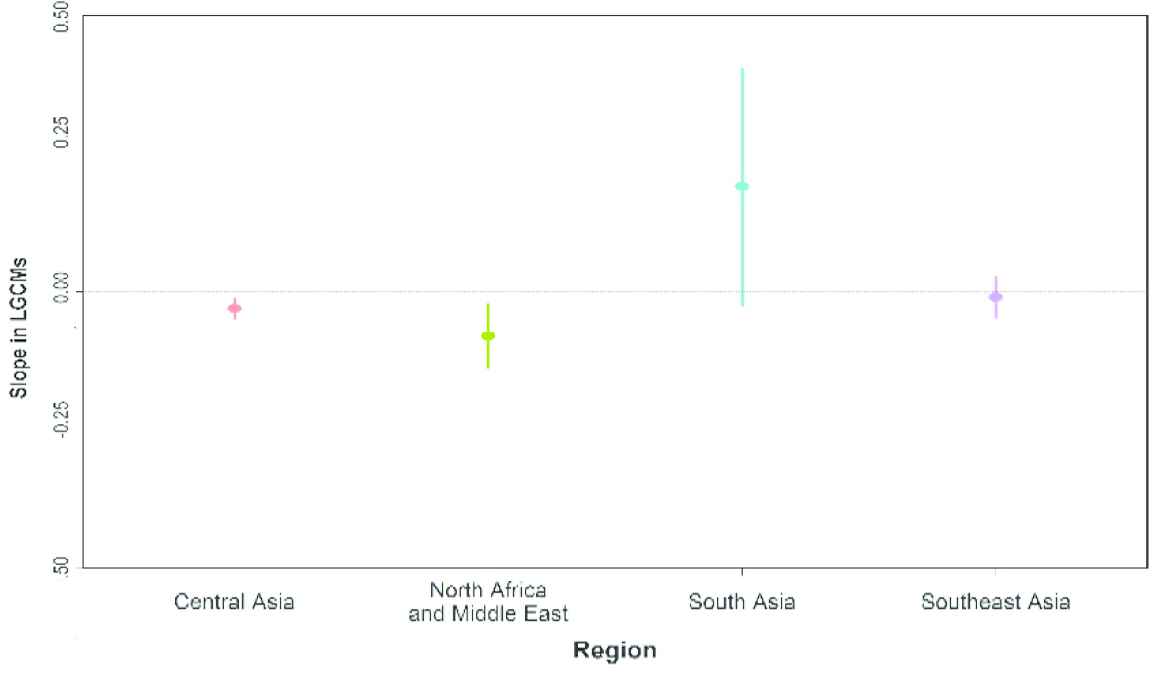
Bar graph for slope with 95% confidence interval in each region from 1990 to 2015. LGCM, latent growth curve modeling.
For choosing the optimal number of latent classes, comparison of goodness-of-fit indices (AIC, BIC, and LRT p-value) revealed that the LGMM model with four classes had the best fit to the data (results not shown here). Figure 5 displays the achieved results from this model. Based on these findings, five countries were classified as belonging to the first class, only one country in the second class, 20 countries in the third class, and finally 29 countries in the fourth class.
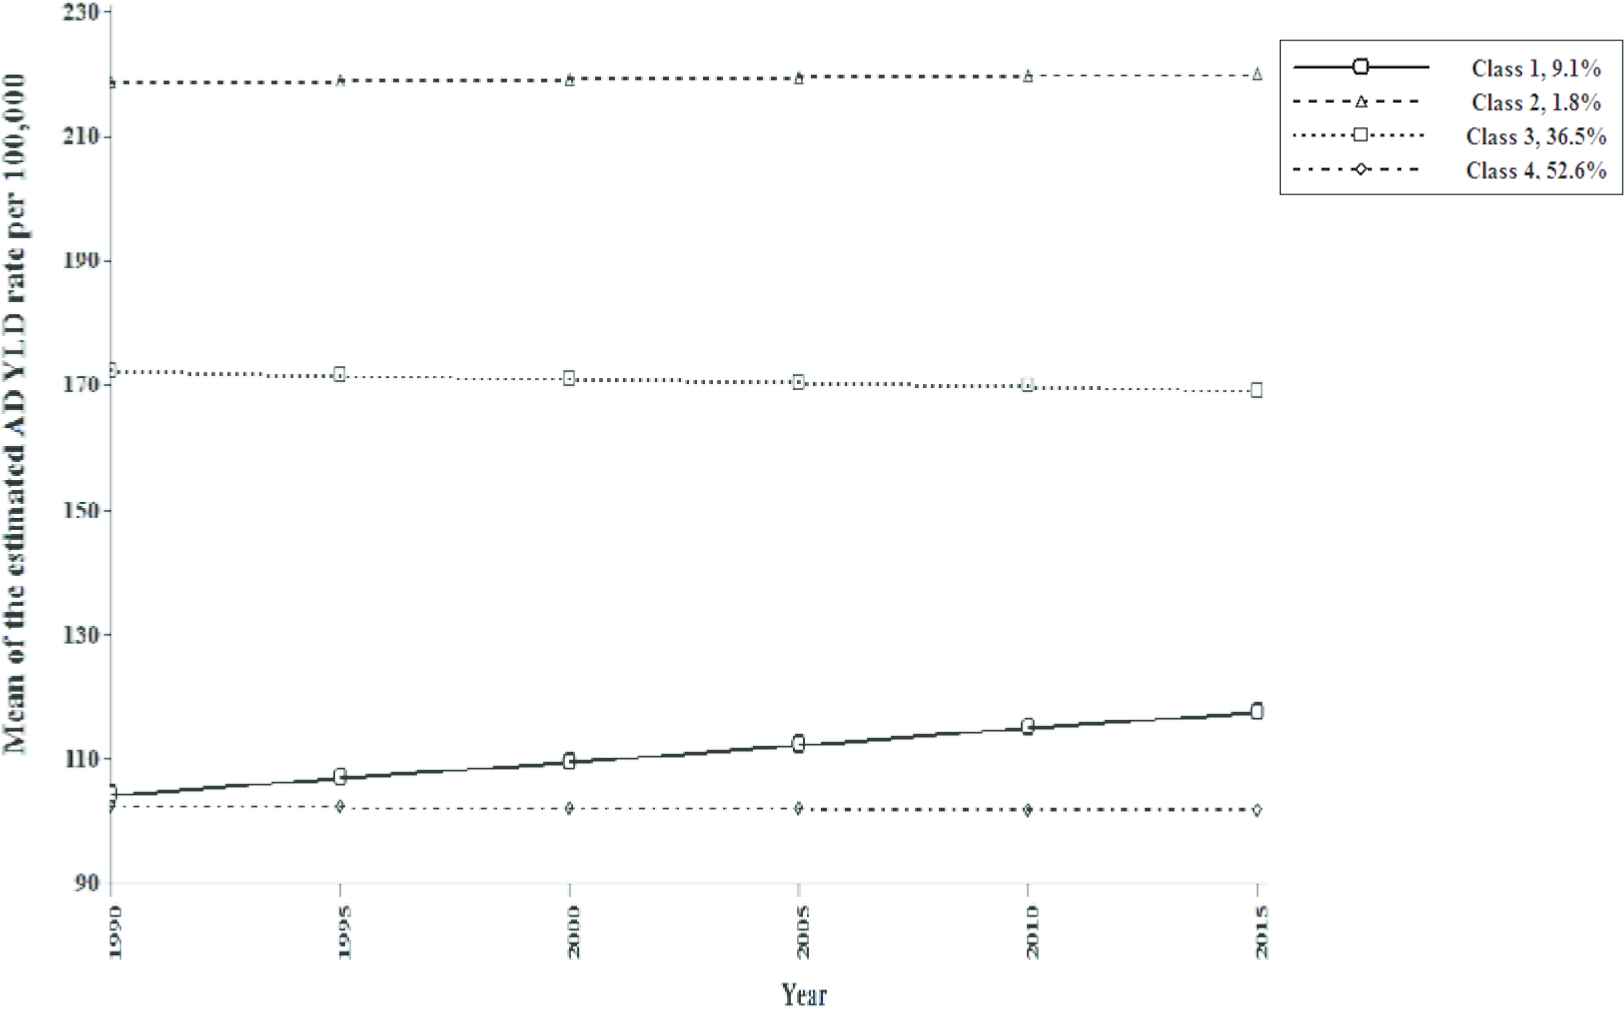
The estimated mean values of four-class GMM for AD and other dementias YLD rates across the six time points. AD, Alzheimer’s disease; GMM, growth mixture model; YLD, years lived with disability.
Table 3 illustrates the estimated mean intercept and slope (as well as standard errors of the estimates) for the four-class model. A comparison of the estimated intercepts shows that countries in Class 2 had the highest mean YLD rate at the baseline (year 1990), whereas countries in Class 4 experienced the lowest mean rate in this year (218.52 vs. 102.19 per 100,000 individuals). Furthermore, Class 1 had a potentially rapid increasing trend from 1990 to 2015. Moreover, for the country in Class 2, a relatively stable rise trend could be observed across the six time points. By contrast, latent Class 3 had a rather shallow reduction in change rate over time. Lastly, countries in Class 4 on average had a modest decreasing trend in YLD rate during the study period.
| Model | Intercept | Slope | ||
|---|---|---|---|---|
| Mean | SE | Mean | SE | |
| Latent Class 1a | 104.15 | 7.55* | 2.66 | 0.38* |
| Latent Class 2b | 218.52 | 0.91* | 0.32 | 0.27** |
| Latent Class 3c | 172.21 | 1.56* | –0.61 | 0.08* |
| Latent Class 4d | 102.19 | 2.23* | –0.13 | 0.05*** |
Egypt, Japan, China, Singapore, India.
Turkey.
Afghanistan, Algeria, Bahrain, Iran, Iraq, Jordan, Kuwait, Libya, Lebanon, Malaysia, Morocco, Oman, Palestine, Qatar, Saudi Arabia, Sudan, Syria, Tunisia, United Arab Emirates, Yemen.
Armenia, Azerbaijan, Bangladesh, Bhutan, Brunei, Cambodia, Georgia, Indonesia, Kazakhstan, Kyrgyzstan, Laos, Maldives, Mauritius, Mongolia, Myanmar, Nepal, North Korea, Pakistan, Philippines, Seychelles, South Korea, Sri Lanka, Taiwan, Tajikistan, Thailand, Timor-Leste, Turkmenistan, Uzbekistan, Vietnam.
Significant (p < 0.001).
Not significant (p > 0.05).
Significant (p < 0.05).
Estimated results of four-class growth mixture model for Alzheimer’s disease and other dementias YLD rates per 100,000 persons
4. DISCUSSION
The disability related to AD is one of the main contributors to the global burden of diseases. In this context, the evaluation of changes in AD and other dementias YLD rates among the metrics of burden of disease is pivotal for assessing the health system. Regarding the substantial heterogeneity in the pattern of changes in YLD rates for different Asian and North African countries, our analysis focused on the assessment of trends in YLD rates among these countries during the period 1990–2015, using LGMM based on reported GBD statistics.
In general, LGCM results revealed an estimate of −0.006 for the slope of YLD in all 55 countries of Asia and North Africa from 1990 to 2015. This indicates that YLD rate had a rather steady trend during this period in this part of the world. Our findings also showed that the highest rate of YLD occurred in SA with a slope of 0.19 over time. Furthermore, NAME had the lowest rate compared to other regions (with a slope of −0.08). Additionally, a modest decreasing trend in YLD rates was detected in SEA and CA with a slope of −0.01 and −0.03, respectively. Asian societies are progressively aging so that elderly populations will grow from 10% to 17% and 24% of the total Asian population in 2010, 2030, and 2050, respectively [15]. Extending life expectancy and consequently rapid aging of the population as the major known risk factors may contribute to the increasing prevalence of dementia and subsequently YLD rates in SA [16]. Meanwhile, promotion of the level of medical care may be one of the most important reasons for the rising YLD rate in this region [17]. By contrast, for NAME, CA, and SEA regions, we found that YLD rates have been decreasing over time. The incidence of war and poverty in some parts of these regions and also reduced life expectancy may be some of the reasons for this downward trend. Lower levels of care and gaps in existing health services in some of these regions are other causes of the descending slope [18–21]. Better allocation of healthcare resources, raising the level of public awareness regarding the prevalence of neurological disorders, and improved treatment can be appropriate strategies for increasing the YLD rate [6,22].
In the next step of data analysis, the results of the LGMM showed that about 9.1% of all countries that were assigned to the first class experienced a remarkable growth in follow-up years. This class includes Japan and Singapore, which are considered high-income countries; China, an upper middle-income country; and finally India and Egypt, which are countries with lower middle income. Nearly one-third of the world’s population are placed in this class. Some of them have been rapidly catching up to industrialized countries over the past decades. Increase in the prevalence rate of AD and other dementias (as a result of rapid movement toward development and industrialization), economic growth, reduction in poverty, population aging, and increase in life expectancy, detection of the early stages of diseases, high levels of education and awareness, implementation of effective public health campaigns to reduce brain diseases, and improvement in care levels especially in elderly people could be the most important reasons for this upward trend [23–27].
Turkey, the only country in Class 2, had an ascending trend in the YLD rate from 1990 to 2015. The initial level of this class was dramatically higher than that in other classes at the starting point of the study (year 1990). Apparently, Turkey, as an Asian–European country, had a different behavior regarding the trend in YLD rate compared to other countries in this super-region. Some reports in Turkey revealed that because of population aging, the number of people affected by dementia has significantly increased over the past few decades. Also, the higher prevalence of AD and other dementias, medical care improvement, healthier lifestyles, industrial development, increased life expectancy, and early detection of the disease can be considered the most important causes for this different trend in this country [27].
About 36.5% of total countries placed in Class 3 had a fairly steady declining trend in YLD, by −0.61 between 1990 and 2015. This class comprises North African and Middle Eastern countries. In these countries, most people are Muslim. According to the WHO projection for the year 2050, cases of dementia will grow by about 125%, and almost 6% of those older than 60 years suffer from dementia in NAME. Although there is no published document on AD and other dementias YLD rates in these countries, several important hazardous behaviors may be positively related to this downward trend in YLD rates. Lack of adequate knowledge about dementia, widespread poverty, relatively low economic growth rate, low level of literacy, occurrence of war in some of these countries (e.g., Iraq, Lebanon, Afghanistan, Syria, Yemen, Palestine, and Libya), inadequate mental healthcare system, insufficient length of treatment, and decrease in life expectancy can be regarded as some of these related factors [19,28–34].
Meanwhile, Class 4 consists of 52.6% of all countries, with a fairly fixed trend of −0.13 over the period 1990–2015. This class had the lowest mean intercept. Most countries in this class belong to CA, SA, and SEA regions. Because of this geographic variability, finding general reasons for this decreasing pattern over time was challenging. Regarding the raw data for these countries, the baseline levels (AD rates in year 1990) were very different, but they had roughly similar trends between 1990 and 2015. However, some literature confirms the lack of treatment for AD and other dementias and care provision for some low income and developing countries [22,35]. Therefore, it is important to make policy commitments that prioritize the development and implementation of support health and social care systems for neurological disorders [36]. More specifically, training programs in improving the expertise of healthcare providers play an important role in fostering AD and other dementias care.
Generally, findings for some countries have shown that YLD rates have risen during the period 1990–2015. The positive aspect of this issue is the growth in duration of survival with AD and other dementias owing to some factors, for example, receiving effective care and increasing life expectancy, whereas insufficient care or failure in the early detection of the illness may lead to shortening of the life span of patients with disabilities. However, long-term disabilities impose costs on patients, their families, and the society.
As we described in previous sections, we used LGM models to capture the trend of YLD rate and cluster the countries based on data collected for the period covered in this study. Several advantages have been noted for LGM models in the literature. First, unlike conventional clustering methods (such as k-means and hierarchical approaches that classify the sampling units based on some distinct variables), LGMMs utilize the repeated-measures data from a single variable to cluster the sampling units. Second, in addition to clustering the available sample, LGMMs allow us to identify the intercept and the slope of the trend in the identified subgroups (classes). Third, using this methodology, one can test whether or not the intercept and the slope of each class are significant. Despite these benefits, our study had several limitations. An inadequate sample size for fitting the LGMMs in each of the Asian and North African regions is one of the most important limitations. Furthermore, we only used the data from six time points (1990, 1995, 2000, 2005, 2010, and 2015) to estimate the trend of YLD rates within a 25-year period. Using the data from 25 time points will evidently results in more accurate estimates. In addition, there were few epidemiological studies conducted on AD and other dementias YLD rates in parts of Asia and North Africa. Therefore, further research is necessary to clarify these topics.
5. CONCLUSION
To the best of our knowledge, this study is the first research to date on analysis of trend in AD and other dementias YLD rates in Asian and North African countries. The obtained results revealed remarkable heterogeneity in YLD rates among Asian and North African countries. Moreover, in some countries, an upward trend could be observed in YLD rates over the past decades. It seems that these countries were successful in promoting the level of knowledge and attitudes about this disease, and providing better access to required treatments and medical care for patients. In contrast, the downward or fixed trend of YLD rates in some parts of Asia and North Africa may be attributed to the lower level of healthcare and medical resources among the patients. In this context, health policymakers should attempt to provide a higher level of care for these patients and promote their awareness of AD and other dementias.
ACKNOWLEDGMENTS
This paper is a part of research project funded by the Proteomics Research Center of Shahid Beheshti University of Medical Sciences. The authors thank Dr Rezaei Tavirani, head of the center, for his kind support.
CONFLICTS OF INTEREST
There is no conflict of interest.
REFERENCES
Cite this article
TY  - JOUR
AU  - Maedeh Amini
AU  - Farid Zayeri
AU  - Sahar Saeedi Moghaddam
PY  - 2019
DA  - 2019/03/27
TI  - Years Lived with Disability due to Alzheimer’s Disease and Other Dementias in Asian and North African Countries: A Trend Analysis
JO  - Journal of Epidemiology and Global Health
SP  - 29
EP  - 35
VL  - 9
IS  - 1
SN  - 2210-6014
UR  - https://doi.org/10.2991/jegh.k.190305.002
DO  - 10.2991/jegh.k.190305.002
ID  - Amini2019
ER  -