
Demographic, Socio-economic and Lifestyle Determinants of Under- and Over-nutrition among Bangladeshi Adult Population: Results from a Large Cross-Sectional Study
- DOI
- 10.2991/j.jegh.2018.03.002How to use a DOI?
- Keywords
- Underweight; overweight; nutritional transition; factors
- Abstract
Bangladesh is currently going through a nutritional transition with rapid increase in overnutrition while undernutrition is still remaining prevalent. Nevertheless, population-based data on demographic, socio-economic and lifestyle factors associated with underweight and overweight among adult population is scarce. Employing a nationwide cross-sectional survey, we collected anthropometric, demographic, socio-economic, lifestyle and dietary information from 12,180 adults aged ≥35 years. Body Mass Index (BMI) was calculated using standard formula and categorized into underweight (<18.50), normal weight (18.50–22.99), and overweight (≥23.00). Multivariable multinomial logistic regression was performed to identify factors associated with underweight and overweight. Overall, prevalence of underweight and overweight was 18.1% (95% CI: 17.5–18.8) and 33.7% (95% CI: 32.9–34.6), respectively. All the demographic, socio-economic, dietary and lifestyle factors showed significant association with nutritional status in bivariate analysis. In adjusted analysis, factors showing significant positive association with underweight included female gender (ARRR-1.38, 95% CI: 1.11–1.71), older age [compared to 35–39 years age group, ARRR (95% CI) for ≥ 70 years is 2.32 (1.89–2.86), for 60–69 years is 1.62 (1.36–1.93), for 50–59 years 1.34 (1.13–1.58) and for 40–49 years 1.05 (0.87–1.15)] and smoking habit (ARRR-1.32, 95% CI: 1.14–1.52) while factors showing significant inverse association with underweight included higher household wealth [compared to lowest wealth quintile, ARRR (95% CI) for highest quintile is 0.68 (0.55–0.84), for second highest quintile 0.77 (0.65–0.91), for middle quintile 0.81 (0.69–0.94) and for second lowest quintile 0.89 (0.77–1.03)], urban residence (ARRR-0.66, 95% CI: 0.66–0.90), and more frequent meat/fish and fruits consumption (ARRR-0.76, 95% CI: 0.65–0.90). On the other hand, factors significantly associated with increased risk of overweight included female gender (ARRR-1.35, 95% CI: 1.12–1.63), higher household wealth [compared to lowest wealth quintile, ARRR (95% CI) for highest quintile is 2.27 (1.93–2.68), for second highest quintile 1.67 (1.44–1.94), for middle quintile 1.26 (1.10–1.46) and for second lowest quintile 1.07 (0.93–1.24), excess food availability [compared to food shortage, ARRR (95% CI) for excess food in the household is 1.29 (1.12–1.47) and for no shortage/no excess is 1.23 (1.09–1.38) and more frequent fruits consumption [compared to no fruits, ARRR (95% CI) for 5–7 days per week consumption is 1.61 (1.41–1.83) and for 3–4 days per week is 1.28 (1.16–1.41) and factors significantly associated with decreased risk of overweight included older age [compared to 35–39 years age group, ARRR (95% CI) for ≥ 70 years is 0.77 (0.64–0.93), for 60–69 years is 0.82 (0.71–0.94), for 50–59 years 0.91 (0.80–1.04) and for 40–49 years 1.01 (0.89–1.15)] and smoking (ARRR-0.76, 95% CI: 0.68–0.86). Both underweight and overweight are prevalent in Bangladeshi adult population. Several demographic, socio-economic, dietary and lifestyle factors are associated with underweight and overweight in Bangladesh. Population level impact of these factors should be examined to design suitable public health and nutrition interventions to address this dual challenge.
- Copyright
- © 2018 Atlantis Press International B.V.
- Open Access
- This is an open access article under the CC BY-NC license (http://creativecommons.org/licences/by-nc/4.0/).
1. INTRODUCTION
Bangladesh like many other developing countries is currently going through a nutritional transition with rapid increase in overnutrition while undernutrition is still remaining prevalent [1,2]. Recent demographic and health survey (DHS) shows that prevalence of underweight (BMI < 18.5) in women of reproductive age decreased from 45% in 2000 to 24% in 2011, when overweight (BMI ≥ 25) increased from 5% to 17% [3]. Another study carried out among adult people aged 35 years or more, reported 29.1% and 20.5% prevalence of underweight and overweight (BMI ≥ 23) respectively in men and 36.0% and 24.4% prevalence of underweight and overweight respectively in women in Bangladesh [4].
Adverse health consequences of both undernutrition and overnutrition in adult population are well documented that includes increased mortality and morbidity [5,6]. Underweight is linked with several co-morbidities including osteoporosis, infertility and asthma [7,8], while overweight is associated with cardiovascular diseases, cancer, hypertension and diabetes [9,10]. Studies in developed countries have extensively examined associations of socio-demographic and lifestyle factors with underweight and overweight [11–14]. However, very few studies in Bangladesh and other South Asian countries have studied factors associated with overweight and underweight [15]. A recent study in Bangladesh reported older age, lower education level and poverty are positively associated with underweight while younger age, female gender, higher education level, affluence and urban residence are positively associated with overweight [4]. An study conducted in adult males in Sri Lanka showed that older age, higher family income and higher education level are positively associated with overweight and obesity [15]. Another study in India among women showed that lower socioeconomic status increased the risk of being underweight while higher socioeconomic status increased the risk of being overweight [16]. Identification of modifiable lifestyle factors with nutritional status from population-based studies is critically important to design public health interventions to prevent impeding epidemic of overnutrition in low and middle income countries. Thus, in present study, we estimated the prevalence of underweight and overweight and their associations with several demographic, socio-economic and lifestyle variables in a nationally representative adult population including both males and females.
2. METHODS
2.1. Study Design
This is a nationally representative population-based cross-sectional study conducted by the BRAC Research and Evaluation Division (RED) in 2015. The primary purpose of the study was to establish a baseline for the BRAC’s nationwide Health, Nutrition and Population Program (HNPP). The larger study included 60,503 respondents including men, women and children of all ages. This study used data from 12,180 adult population of age 35 years or more who provided data on anthropometry, socio-demographic, economic and lifestyle variables.
2.2. Study Setting and Population
This study was conducted in 58 of 64 districts of Bangladesh. Households were selected for the survey using multistage cluster sampling approach. Data were collected from all selected households and its members after informed consent was obtained. Household members who were 35 or more years of age were asked for anthropometry and other lifestyle information.
2.3. Data Collection Tools and Techniques
The survey questionnaire was field-tested before using for final data collection. All data were collected online in 7″ android tablets using ODK (Open Data Kit), an android based open-source mobile platform software [17]. Trained and experienced interviewers collected detailed data on socioeconomic and demographic characteristics includes age, sex, education, marital status, household wealth and income from the study population. They also measured participants’ anthropometry (height and weight), behavioral and lifestyle activities including sleeping duration (in hours), smoking and smokeless tobacco consumption, reported level of physical activity (exercise) and dietary habit.
3. OUTCOME AND EXPOSURE ASSESSMENT
Body Mass Index (BMI) was our primary outcome of interest. Our trained data collectors measured the height and weight of all consented respondents using standardized procedure. Weight was measured using digital bathroom scale while height was measured using locally made stadiometer. Digital bathroom scales are recommended for measuring weights for public health research [18] and has been used before [19]. Each respondent was measured twice and an average of the two measurements was considered in the analysis. BMI was calculated using the formula weight in kg/height in meter2 and classification was done using WHO recommended Asian specific cut points of underweight (BMI < 18.5) and overweight ≥23.0 [20]. Self-reported exposure data were collected from the respondents using a pre-tested questionnaire. Household characteristics were validated with observation by the data collectors. Total sleep time (TST) was defined as “the difference between the time at which the participant switches off the light and the time at which they wake up, ignoring the time needed to fall asleep and the time to wake up” [21]. Each participant was asked to recall his or her TST in the previous 24 h on the day of interview regardless of daytime or nighttime sleep. As documented in our earlier paper, they were then given sufficient time to calculate their total sleep duration (in hours) for both the day and night [22]. We further categorized sleep duration into <7 h, 7–9 h, and ≥10 h according to National Sleep Foundation guidelines [23].
3.1. Training and Quality Assurance
We recruited a total of 110 interviewers with previous experience of online data collection. We organized fifteen-day (2 weeks) intensive training which included lectures, mock interviews, role play and field practice at the community level. All data collectors were standardized on anthropometry procedures. Weighing machines were calibrated weekly to ensure accurate measurements throughout the survey period. We divided data collectors into 21 teams and each team was supervised by an experienced field supervisor. The investigators also frequently travelled to the field to oversee the data collection procedures. Supervisors performed spot checking in the field and cross-checked filled in data in the tab before sending to the BRAC information and communications technology (ICT) server using mobile internet. Around 5 percent of the sampled respondents were re-interviewed by the field supervisors and immediately sent to the headquarters for cross-checking and feedback to the field. In case any discrepancies were found, the field coordinator investigated the issue and rectified. Data were collected during the months of August through December 2015.
3.2. Statistical Analyses
We computed means and standard deviation of height, weight and BMI for men and women separately. Prevalence of under-weight (BMI < 18.5), over-weight/obese (BMI ≥ 23.0) and normal weight (BMI 18.50–22.99) with corresponding 95% Confidence Interval was calculated by gender and for all respondents. Percent distribution of demographic, socio-economic and lifestyle factors are compared among nutritional categories using chi squared test of independence. Adjusted associations of demographic, socio-demographic and lifestyle factors with underweight and overweight compared to normal weight were examined using multinomial logistic regression. For measuring socio-economic status of households, a wealth score was created using information on ownership of durable household assets, source of drinking water, type of latrine, and characteristics of dwelling house using principal component analysis [24]. The respondents were then grouped into five quintiles based on the ranking of the households according to the wealth score. Data analyses were done in Stata (version 12) statistical software[25].
3.3. Ethics Statement
Ethical approval was obtained from the Bangladesh Medical Research Council (Ref: BMRC/NREC/2013–2016/802). The purpose of the study was described to the participants. Both verbal and informed written consent were provided by participants prior to interview.
4. RESULTS
A total of 60,503 people in 11,515 households were enumerated by the data collection teams (Fig. 1), of which 15,297 (25.3%) were ≥ 35 years old and were eligible for this study. A total of 12,180 (79.6%) eligible respondents provided all data and were included in the study, of which 5885 (48.3%) were male and 6295 (51.7%) were females. The remaining 3117 eligible respondents were either absent during the data collection period (3000) or did not provide consent (117).
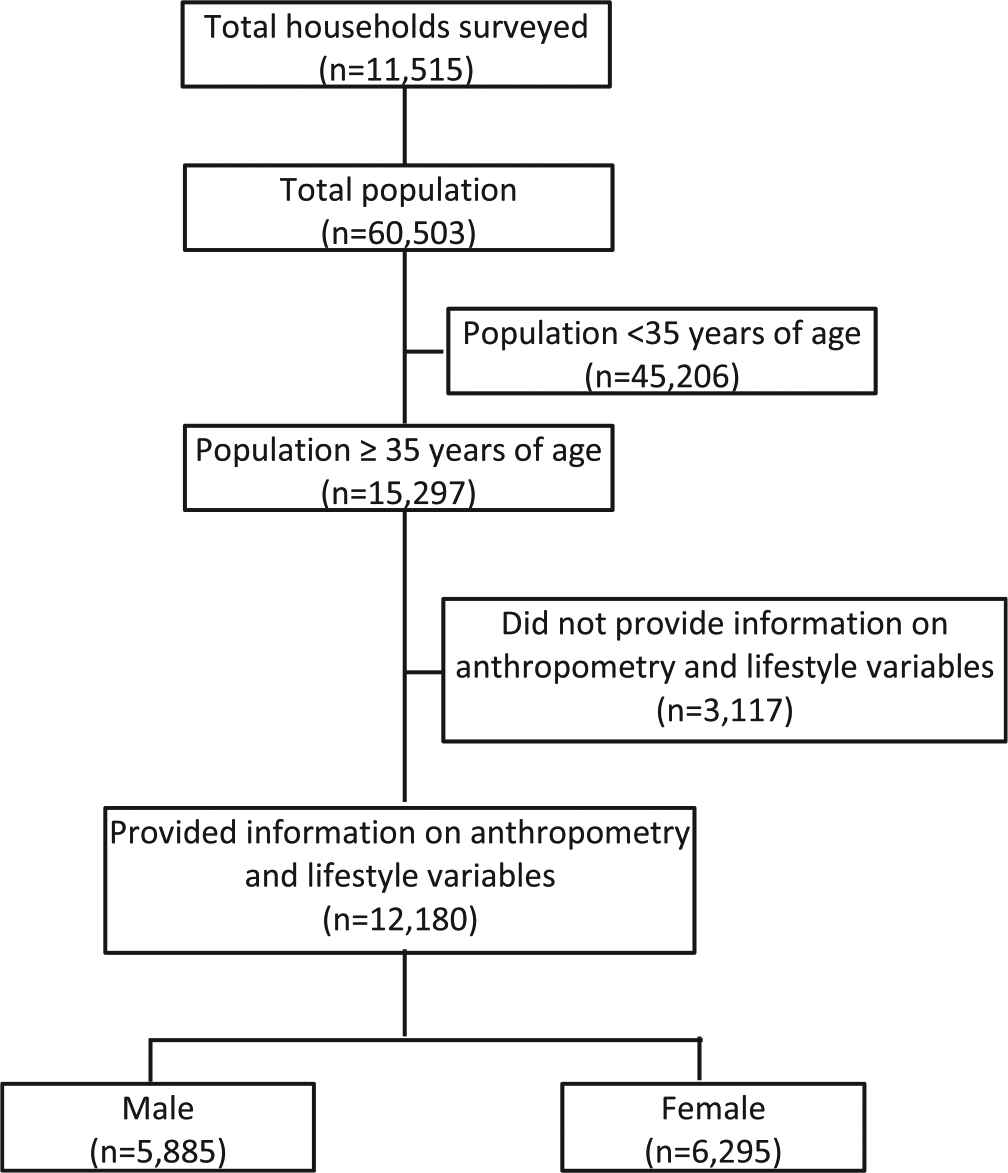
Study profile.
Table 1 shows the means and standard deviations of height, weight and BMI scores for all respondents and for men and women separately. Table 2 shows prevalence and corresponding 95% CI of underweight and overweight in men and women separately and for the total respondents. Overall prevalence (95% CI) of underweight is 18.14% (17.47%–18.84%) and that of overweight (BMI ≥ 23.00) is 33.74% (32.90%–34.58%). Prevalence of overweight using cut-points of 25 (International standard) is 18.30% (17.62%–19.00%).
| Anthropometric variables | Men (n = 5885) | Women (n = 6295) | Total (n = 12180) | |||
|---|---|---|---|---|---|---|
| Mean | Standard deviation | Mean | Standard deviation | Mean | Standard deviation | |
| Height (cm) | 159.58 | 6.43 | 148.82 | 5.80 | 154.02 | 8.14 |
| Weight (kg) | 55.04 | 9.30 | 48.93 | 9.65 | 51.88 | 9.96 |
| BMI (kg/m2) | 21.59 | 3.29 | 22.05 | 3.96 | 21.83 | 3.66 |
Descriptive statistics of anthropometric variables by gender among the study population
| Nutritional status | Men (n = 5885) | Women (n = 6295) | Total (n = 12180) | |||
|---|---|---|---|---|---|---|
| Percent | 95% CI | Percent | 95% CI | Percent | 95% CI | |
| Normal weight (BMI 18.5–22.99) | 52.10 | 50.82–53.37 | 44.40 | 43.18–45.63 | 48.12 | 47.23–49.01 |
| Underweight (BMI < 18.5) | 17.25 | 16.30–18.23 | 18.98 | 18.03–19.97 | 18.14 | 17.47–18.84 |
| Overweight/obese (BMI ≥ 23) | 30.65 | 29.49–31.84 | 36.62 | 35.43–37.81 | 33.74 | 32.90–34.58 |
| Over-weight/obese (BMI ≥ 25) | 14.46 | 13.58–15.38 | 21.89 | 20.89–22.93 | 18.30 | 17.62–19.00 |
Prevalence of under- and over-nutrition according to BMI cut-offs as recommended for Asian population by WHO
Table 3 shows the percent distribution of BMI categories (underweight, overweight and normal weight) by demographic and socio-economic factors (gender, household weight quintile, food availability in the preceding year, age, education level, marital status, occupation and area of residence). All these factors are significantly associated with nutritional status. Prevalence of underweight is found to be higher in females; respondents in lower wealth quintile households; respondents in households reporting food shortage; older people and rural population. While prevalence of overweight is found to be higher in females; respondents in higher wealth quintile households; respondents in households with excess food; younger people; and urban population. Table 4 shows the distribution of nutritional status by lifestyle factors and dietary habits. All lifestyle and dietary factors (protein consumption; vegetable consumptions; fruits consumption; extra salt intake; daily sleep duration; smoking; smokeless tobacco consumption; and exercise) are significantly associated with nutritional status in the surveyed population. Prevalence of underweight is higher among respondents consuming meat/fish less frequently; respondents consuming vegetables more frequently; and respondents consuming fruits less frequently. Prevalence of overweight is higher among respondents consuming meat/fish more frequently; respondents consuming vegetables less frequently; and respondents consuming fruits more frequently.
| Variables | Normal weight (n = 5861) | Under-weight (n = 2210) | Over-weight (4109) | P Value | |||
|---|---|---|---|---|---|---|---|
| Percent | 95% CI | Percent | 95% CI | Percent | 95% CI | ||
| Gender | |||||||
| Male | 52.1 | 50.8–53.4 | 17.2 | 16.3–18.2 | 30.7 | 29.5–31.8 | <0.001 |
| Female | 44.4 | 43.2–45.6 | 19.0 | 18.0–20.0 | 36.6 | 35.4–37.8 | |
| Wealth quantile | |||||||
| Lowest | 53.3 | 51.3–55.2 | 26.0 | 24.3–27.8 | 20.7 | 19.1–22.4 | <0.001 |
| Second lowest | 52.7 | 50.7–54.6 | 21.8 | 20.2–23.5 | 25.5 | 23.8–27.3 | |
| Middle | 50.4 | 48.5- | 18.6 | 17.1–20.2 | 30.9 | 29.2–32.8 | |
| Second highest | 45.5 | 43.6–47.5 | 15.0 | 13.6–16.5 | 39.5 | 37.6–41.5 | |
| Highest | 38.3 | 36.3–40.3 | 8.9 | 07.9–10.2 | 52.8 | 50.8–54.8 | |
| Food availability in the last year | |||||||
| Always/sometimes shortage | 53.9 | 52.1–55.7 | 23.3 | 21.8–24.9 | 22.8 | 21.3–24.4 | <0.001 |
| No shortage/No excess | 47.9 | 46.7–49.3 | 17.8 | 16.8–18.8 | 34.3 | 33.1–35.5 | |
| Excess | 43.7 | 42.1–43.3 | 14.6 | 13.5–15.8 | 41.7 | 40.1–43.3 | |
| Age | |||||||
| 35–39 years | 48.8 | 46.9–50.7 | 12.5 | 11.3–13.8 | 38.7 | 36.9–40.6 | <0.001 |
| 40–49 years | 48.7 | 46.9–50.6 | 13.9 | 12.7–15.3 | 37.4 | 35.6–39.2 | |
| 50–59 years | 47.9 | 46.0–49.7 | 18.2 | 16.8–19.7 | 33.9 | 32.2–35.7 | |
| 60–69 years | 48.6 | 46.7–50.6 | 22.3 | 20.7–23.9 | 29.1 | 27.3–30.9 | |
| 70 years & more | 45.2 | 42.6–47.8 | 30.1 | 27.8–32.6 | 24.7 | 22.5–27.0 | |
| Education | |||||||
| No education | 49.2 | 47.2–51.2 | 20.3 | 18.7–21.9 | 30.5 | 28.7–32.4 | <0.001 |
| 1–4 years of schooling | 49.9 | 47.4–52.3 | 14.2 | 12.6–16.0 | 35.9 | 33.6–38.3 | |
| 5–9 years of schooling | 43.4 | 41.6–45.3 | 11.4 | 10.3–12.7 | 45.2 | 43.3–47.0 | |
| ≥10 years of schooling | 49.5 | 48.2–50.9 | 21.8 | 20.7–22.9 | 28.7 | 27.5–29.9 | |
| Marital status | |||||||
| Currently married | 48.3 | 47.3–49.2 | 16.8 | 16.1–17.6 | 34.9 | 34.0–35.9 | <0.001 |
| Currently single | 47.5 | 45.4–49.6 | 24.3 | 22.6–26.2 | 28.2 | 26.3–30.1 | |
| Occupation | |||||||
| Agriculture | 54.6 | 52.1–57.1 | 21.0 | 19.0–23.2 | 24.3 | 22.2–26.6 | <0.001 |
| Formal job | 46.5 | 43.1–50.0 | 9.6 | 07.8–11.8 | 43.9 | 40.5–47.3 | |
| Business | 45.0 | 42.3–47.7 | 9.2 | 07.8–10.9 | 45.8 | 43.1–48.5 | |
| Laborer | 62.8 | 59.9–65.6 | 20.6 | 18.4–23.1 | 16.6 | 14.5–18.9 | |
| Home maker | 44.4 | 43.0–45.7 | 17.8 | 16.8–18.8 | 37.8 | 36.5–39.1 | |
| Unemployed | 47.6 | 43.6–51.6 | 22.4 | 19.3–26.0 | 30.0 | 26.4–33.8 | |
| Others | 48.1 | 45.5–50.6 | 25.6 | 23.4–27.8 | 26.4 | 24.2–28.7 | |
| Residence | |||||||
| Rural | 48.4 | 47.4–49.3 | 19.2 | 18.4–19.9 | 32.5 | 31.6–33.3 | <0.001 |
| Urban | 45.8 | 42.9–48.6 | 8.6 | 07.1–10.4 | 45.6 | 42.8–48.5 | |
Association of demographic and socio-economic variables with nutritional status of the study population
| Variables | Normal weight (n = 5861) | Under-weight (n = 2210) | Over-weight (n = 4109) | P Value | |||
|---|---|---|---|---|---|---|---|
| Percent | 95% CI | Percent | 95% CI | Percent | 95% CI | ||
| Meat/Fish consumption | |||||||
| 0–2 days per week | 51.2 | 48.5–53.8 | 26.1 | 23.9–28.5 | 22.7 | 20.6–25.0 | <0.001 |
| 3–4 days per week | 51.3 | 49.7–52.9 | 21.7 | 20.4–23.0 | 27.0 | 25.6–28.4 | |
| 5–7 days per week | 45.7 | 44.6–46.9 | 14.6 | 13.8–15.5 | 39.6 | 38.5–40.8 | |
| Vegetable consumption | |||||||
| Consume daily | 51.8 | 49.8–53.8 | 22.9 | 21.2–24.6 | 25.3 | 23.6–27.1 | <0.001 |
| Does not consume daily | 47.2 | 46.2–48.2 | 17.0 | 16.3–17.8 | 35.8 | 34.8–36.7 | |
| Fruits consumption | |||||||
| 0 days per week | 51.9 | 50.6–53.1 | 22.6 | 21.5–23.7 | 25.6 | 24.4–26.7 | <0.001 |
| 1–2 days per week | 47.0 | 45.5–48.5 | 15.8 | 14.7–16.9 | 37.2 | 35.8–38.7 | |
| 3–7 days per week | 39.8 | 37.7–42.0 | 10.6 | 09.3–12.0 | 49.6 | 47.4–51.8 | |
| Extra salt intake | |||||||
| Never | 46.4 | 44.3–48.5 | 16.9 | 15.4–18.5 | 36.7 | 34.7–38.8 | 0.018 |
| Sometimes | 48.0 | 46.5–49.5 | 18.3 | 17.2–19.5 | 33.6 | 32.2–35.1 | |
| Always | 48.8 | 47.6–50.1 | 18.5 | 17.5–19.5 | 32.7 | 31.5–33.9 | |
| Daily sleep hours | |||||||
| Less than 7 h | 47.5 | 44.9–50.0 | 17.1 | 15.3–19.1 | 35.4 | 33.0–37.9 | 0.002 |
| 7–9 h | 48.9 | 47.8–49.9 | 18.3 | 17.5–19.1 | 32.8 | 31.9–33.8 | |
| More than 9 h | 44.2 | 41.7–46.7 | 18.2 | 16.3–20.2 | 37.7 | 35.2–40.2 | |
| Smoking habit | |||||||
| Never smoker | 45.6 | 44.5–46.6 | 17.1 | 16.3–17.9 | 37.3 | 36.3–38.4 | <0.001 |
| Ever smoker | 53.6 | 52.0–55.1 | 20.3 | 19.1–21.6 | 26.1 | 24.7–27.5 | |
| Smokeless tobacco use | |||||||
| Never user | 46.6 | 45.0–48.1 | 14.9 | 13.8–16.1 | 38.5 | 37.0–40.1 | <0.001 |
| Ever user | 48.8 | 47.8–49.9 | 19.7 | 18.8–20.5 | 31.5 | 30.5–32.5 | |
| Exercise | |||||||
| No exercise | 46.3 | 44.6–47.9 | 20.1 | 18.8–21.5 | 33.6 | 32.0–35.2 | <0.001 |
| ≤3 h exercise per week | 47.9 | 46.7–49.1 | 16.9 | 16.1–17.9 | 35.1 | 34.0–36.3 | |
| >3 h exercise per week | 51.8 | 49.7–54.0 | 18.7 | 17.1–20.4 | 29.5 | 27.5–31.5 | |
Association of lifestyle variables with nutritional status of the study population
Table 5 shows the unadjusted and adjusted association of demographic, socioeconomic, lifestyle and dietary factors with underweight and overweight compared to normal weight using multinomial logistic regression. Female gender, older age, and smoking habit are positively associated with underweight in our population. Adjusted Relative Risk Ratio (ARRR) and 95% confidence interval of underweight for females is 1.38 (1.11–1.71) compared to males. Ever smokers have 32% higher risk of being underweight (ARRR-1.32, 95% CI: 1.14–1.52) compared to never smokers. Compared to 35–39 years of age group, ARRR (95% CI) for respondents in 70 years and more group is 2.32 (1.89–2.86), for 60–69 years age group is 1.62 (1.36–1.93), and for 50–59 years age group is 1.34 (1.13–1.58). Higher household wealth quintile, urban residence, weekly 5–7 days meat/fish consumption, and weekly 3–7 days fruits consumption are inversely associated with underweight. Compared to respondents in the lowest wealth quintile, ARRR (95% CI) for respondents in the highest wealth quintile is 0.68 (0.55–0.84); for respondents in the second highest quintile is 0.77 (0.65–0.91); for middle quintile is 0.81 (0.69–0.94); and for second lowest quintile is 0.89 (0.77–1.03). Urban respondents have 24% lower risk of being underweight (ARRR-0.76, 95% CI: 0.65–0.90). Female gender, higher household wealth quintile, excess food availability, marital status and more frequent fruits consumption are positively associated with overweight; while older age and smoking habit are negatively associated with overweight.
| Unadjusted analysis | Adjusted analysis | |||
|---|---|---|---|---|
| Under-weight RRR (95% CI) | Over-weight RRR (95% CI) | Under-weight RRR (95% CI) | Over-weight RRR (95% CI) | |
| Gender | ||||
| Male | 1.00 | 1.00 | 1.00 | 1.00 |
| Female | 1.29 (1.17–1.42) | 1.40 (1.29–1.52) | 1.38 (1.11–1.71) | 1.35 (1.12–1.63) |
| Wealth quintile | ||||
| Lowest | 1.00 | 1.00 | 1.00 | 1.00 |
| Second lowest | 0.85 (0.74–0.97) | 1.25 (1.08–1.43) | 0.89 (0.77–1.03) | 1.07 (0.93–1.24) |
| Middle | 0.76 (0.66–0.87) | 1.58 (1.38–1.81) | 0.81 (0.69–0.94) | 1.26 (1.10–1.46) |
| Second highest | 0.67 (0.58–0.78) | 2.23 (1.95–2.55) | 0.77 (0.65–0.91) | 1.67 (1.44–1.94) |
| Highest | 0.48 (0.40–0.57) | 3.55 (3.10–4.05) | 0.68 (0.55–0.84) | 2.27 (1.93–2.68) |
| Food availability in last year | ||||
| Always/sometimes shortage | 1.00 | 1.00 | 1.00 | 1.00 |
| No shortage/no excess | 0.85 (0.76–0.96) | 1.69–1.52–1.88) | 1.01 (0.89–1.15) | 1.23 (1.09–1.38) |
| Excess | 0.77 (0.68–0.88) | 2.25 (2.01–2.53) | 0.99 (0.86–1.17) | 1.29 (1.12–1.47) |
| Age | ||||
| 35–39 years | 1.00 | 1.00 | 1.00 | 1.00 |
| 40–49 years | 1.12 (0.95–1.32) | 0.97 (0.86–1.32) | 1.05 (0.87–1.15) | 1.01 (0.89–1.15) |
| 50–59 years | 1.49 (1.27–1.74) | 0.89 (0.80–1.00) | 1.34 (1.13–1.58) | 0.91 (0.80–1.04) |
| 60–69 years | 1.79 (1.53–2.10) | 0.75 (0.67–0.85) | 1.62 (1.36–1.93) | 0.82 (0.71–0.94) |
| 70 years & more | 2.61 (2.20–3.10) | 0.69 (0.59–0.80) | 2.32 (1.89–2.86) | 0.77 (0.64–0.93) |
| Education | ||||
| No education | 1.00 | 1.00 | 1.00 | 1.00 |
| 1–4 years of schooling | 0.69 (0.58–0.83) | 1.16 (1.01–1.33) | 0.83 (0.69–1.00) | 0.99 (0.86–1.56) |
| 5–9 years of schooling | 0.64 (0.54–0.75) | 1.67 (1.48–1.89) | 0.89 (0.75–1.06) | 1.20 (1.05–1.38) |
| ≥10 years of schooling | 1.07 (0.94–1.21) | 0.93 (0.83–1.04) | 1.03 (0.90–1.17) | 0.90 (0.80–1.02) |
| Marital status | ||||
| Currently single | 1.00 | 1.00 | 1.00 | 1.00 |
| Currently married | 0.68 (0.60–0.77) | 1.22 (1.09–1.36) | 0.99 (0.86–1.15) | 1.32 (1.16–1.51) |
| Occupation | ||||
| Agriculture | 1.00 | 1.00 | 1.00 | 1.00 |
| Formal job | 0.54 (0.41–0.71) | 2.11 (1.75–2.56) | 0.76 (0.57–1.01) | 1.52 (1.24–1.85) |
| Business | 0.53 (0.42–0.67) | 2.29 (1.93–2.70) | 0.69 (0.54–0.88) | 1.77 (1.45–2.12) |
| Laborer | 0.85 (0.70–1.04) | 0.59 (0.48–0.73) | 0.81 (0.66–0.99) | 0.79 (0.64–0.99) |
| Home maker | 1.04 (0.89–1.21) | 1.91 (1.67–2.19) | 0.95 (0.75–1.21) | 1.31 (1.05–1.64) |
| Unemployed | 1.22 (0.96–1.56) | 1.41 (1.12–1.77) | 0.96 (0.74–1.25) | 1.25 (0.98–1.59) |
| Others | 1.38 (1.15–1.65) | 1.23 (1.03–1.47) | 1.06 (0.86–1.30) | 1.25 (1.03–1.52) |
| Residence | ||||
| Rural | 1.00 | 1.00 | 1.00 | 1.00 |
| Urban | 0.47 (0.38–0.59) | 1.48 (1.31–1.67) | 0.66 (0.52–0.84) | 0.89 (0.76–1.04) |
| Meat/Fish consumption | ||||
| 0–2 days per week | 1.00 | 1.00 | 1.00 | 1.00 |
| 3–4 days per week | 0.83 (0.71–0.96) | 1.18 (1.01–1.38) | 0.89 (0.76–1.04) | 0.92 (0.78–1.08) |
| 5–7 days per week | 0.63 (0.54–0.72) | 1.95 (1.69–2.25) | 0.76 (0.65–0.90) | 1.01 (0.86–1.19) |
| Vegetable consumption | ||||
| Does not consume daily | 1.00 | 1.00 | 1.00 | 1.00 |
| Consume daily | 0.82 (0.73–0.92) | 1.55 (1.39–1.72) | 0.93 (0.82–1.05) | 1.09 (0.97–1.22) |
| Fruits consumption | ||||
| 0 day per week | 1.00 | 1.00 | 1.00 | 1.00 |
| 1–2 days per week | 0.77 (0.69–0.86) | 1.61 (1.47–1.76) | 0.87 (0.77–0.97) | 1.28 (1.16–1.41) |
| 3–7 days per day | 0.61 (0.52–0.72) | 2.53 (2.26–2.82) | 0.76 (0.64–0.92) | 1.61 (1.41–1.83) |
| Extra salt intake | ||||
| Never | 1.00 | 1.00 | 1.00 | 1.00 |
| Sometimes | 1.05 (0.91–1.21) | 0.88 (0.79–0.99) | 1.00 (0.86–1.17) | 0.90 (0.80–1.02) |
| Always | 1.04 (0.90–1.19) | 0.85 (0.76–0.87) | 0.96 (0.83–1.11) | 0.93 (0.83–1.04) |
| Daily sleep hours | ||||
| Less than 7 h | 1.00 | 1.00 | 1.00 | 1.00 |
| 7–9 h | 1.04 (0.89–1.21) | 0.90 (0.80–1.02) | 1.06 (0.90–1.24) | 0.97 (0.85–1.10) |
| More than 9 h | 1.14 (0.93–1.39) | 1.14 (0.97–1.34) | 1.15 (0.93–1.42) | 1.18 (0.99–1.40) |
| Smoking habit | ||||
| Never smoker | 1.00 | 1.00 | 1.00 | 1.00 |
| Ever smoker | 1.01 (0.91–1.12) | 0.59 (0.54–0.65) | 1.32 (1.14–1.52) | 0.76 (0.68–0.86) |
| Smokeless tobacco use | ||||
| Never user | 1.00 | 1.00 | 1.00 | 1.00 |
| Ever user | 1.26 (1.13–1.40) | 0.78 (0.72–0.85) | 0.99 (0.88–1.12) | 0.95 (0.86–1.04) |
| Physical exercise | ||||
| No exercise | 1.00 | 1.00 | 1.00 | 1.00 |
| ≤3 h exercise per week | 0.81 (0.73–0.91) | 1.01 (0.92–1.11) | 0.89 (0.79–1.00) | 0.98 (0.89–1.09) |
| >3 h exercise per week | 0.83 (0.72–0.96) | 0.78 (0.69–0.89) | 1.01 (0.87–1.19) | 0.92 (0.80–1.05) |
Demographic, Socio-economic and Lifestyle factors associated with under- and over-weight in study population
ARRR (95% CI) of overweight for females is 1.35 (1.12–1.63) compared to males. Compared to respondents in the lowest wealth quintile households, ARRR (95% CI) for respondents in the highest wealth quintile household is 2.27 (1.93–2.68); for second highest quintile is 1.67 (1.44–1.94); for middle wealth quintile 1.26 (1.10–1.46); and for second lowest wealth quintile 1.07 (0.93–1.24). Respondents reporting excess of food have 29% higher risk of being overweight (ARRR-1.29, 95% CI: 1.12–1.47) compared to respondents who reported food shortage in the preceding year.
5. DISCUSSIONS
In this study, we reported the prevalence of underweight (BMI < 18.5) and overweight (BMI ≥ 23) in a nationally representative sample of adult population (≥35 years) including both males and females. The findings show presence of a dual burden of undernutrition and overnutrition in the country with remarkably higher prevalence of overweight than underweight, 33.74% and 18.14% respectively. Present study shows a significant reduction in prevalence of underweight since 2011 (reported by Biswas and et al.), from 30.4% to 18.14% and a remarkable increase in prevalence of overweight, from 23.5% to 33.74% [4]. Comparison of nutritional status of adult population with other studies is challenging due to multiple reasons including differences in study time, characteristics of study population and use of different BMI cut points. However, Biswas et al. analyzed data from Bangladesh Demographic and Health Survey of 2011 which is a nationally representative survey, included both males and females of ≥35 years of age and used the Asian population specific cut-points of BMI for classification. Our study is also a nationally representative survey that included similar population and we used the same cut offs. Another study from Bangladesh that included women of age 18 to 49 years reported prevalence of overweight (BMI ≥ 25) 18.0% using cut-points of 25, which is very similar to our results [26]. A recent study from South India in adult population of >19 years of age reported prevalence of underweight 22.7% and prevalence of overweight/obese (BMI ≥ 23) 37.0% [27]. Another study of Sri Lankan male population of age 16–72 years, prevalence of overweight/obese (BMI ≥ 23) was found to be 44.1% [15].
Our study shows that females are at greater risk of both underweight and overweight compared to males. Previous studies also reported that females are more likely to be overweight compared to males. Biswas et al. reported females are nearly three times more prone to be overweight compared to males [4]. Another study from Iranian population also reported higher odds of overweight among women compared to men (OR:2.05; 95% CI:1.15–3.65) [28]. Higher risk of underweight in females is also consistent with similar studies. The study conducted by Biswas et al. reports unadjusted odds ratio of 1.45 (1.27–1.66) for females compared to males [4]. Another study conducted among Nigerian young adult population reported that prevalence of both underweight and overweight were higher among females [29].
We found that higher wealth quintiles are positively associated with overweight while negatively associated with underweight. These are consistent with findings with other studies [4,27]. Older age significantly increased the risk of being underweight, while decreased the risk of being overweight, which is in line with the findings from similar studies [4]. We did not find significant association between nutritional status and educational level in the adjusted model as opposed to reported in previous studies [4,16,30]. However, significant association is observed in the unadjusted analysis. This findings of no association with education level in the adjusted analysis is perhaps due to the fact that education level works through dietary practice and other lifestyle factors and we adjusted for all these factors in our multivariable analysis [31]. We find that currently married people are more likely to be overweight compared to single people in the adjusted analysis but marital status does not have significant association with underweight. This positive association between currently married people and overweight is consistent with findings in previous studies [32,33]. We did not find any significant association between marital status and underweight in the adjusted analysis as found in one previous study conducted in elderly people in Portuguese [34]. Urban residence decreased risk of being underweight and overweight compared to rural residence. Similar findings were found for underweight in other studies in Bangladesh where compared to urban people, rural people were at higher risk of being underweight [4]. Although the above stated study found increased risk of being overweight in urban population, we found similar association in crude analysis but decreased risk in the adjusted analysis. We argue that this higher risk of overweight in urban population is likely to mediate through dietary habit and other lifestyle behaviors. As in our study we adjusted all dietary habits, therefore, we did not find significant positive association in the adjusted analysis. More frequent protein consumption (meat/fish) decreased the risk of being underweight but no significant association between overweight and protein consumption was found in our study. One problem in this study is that we did not collect data separately on meat and fish, which might have shown different results. One study in Vietnamese rural adult population that collected data separately on meat and fish consumption, found no signification association of nutritional status with meat consumption but found significant association with fish consumption [35]. In our study higher frequency of fruits consumption significantly decreased risk of being underweight but increased risk of being overweight. However, we did not find significant association for vegetable consumptions. Comparison of these results with other studies is challenging due to wide variation in data collection methods. One study that collected combined data on fruits and vegetables found significant association in crude analysis but no association in multivariable analysis [27]. Another study in Vietnam collecting data on fruits consumption only showed significant association in crude analysis [35]. We did not find any significant association between extra salt intake and overweight as found in previous studies [36,37]. Our study did not find significant association between sleep duration and underweight or overweight. Earlier studies found significant association between shorter and longer sleep duration with overweight in both cross-sectional as well as longitudinal studies [38,39]. Smokers in our study population were significantly at higher risk of being underweight and lower risk of being overweight. These findings are in agreement with other studies in India and China [27,40,41] as well as in the US [42,43]. The reasons for this type of association may be direct effect of tobacco on appetite and other aspects of physiology or indirect effect on reduced purchasing power for food and therefore quality of diet [44].
Our study has several strengths. This is a large nationally representative population-based study including male/female and rural/urban respondents. We collected full range of demographic, socio-economic, lifestyle and dietary factors from respondent likely to be associated with underweight and overweight. We conducted multivariable multinomial logistics regression to identify the determinants of both underweight and overweight in the same model. There are few limitations of this study as well. This is a cross-sectional study where information on outcome and exposure variables were collected at the same point in time. Thus, the association between various factors and nutritional status may not be causal in nature. Majority of the exposure variables were self-reported likely to induce measurement error. However, we believe that measurement errors are non-differential in nature due to extensive training of data collectors and strict quality control in data collection procedures resulting in underestimation of associations.
6. CONCLUSIONS
We report existence of a double burden of underweight and overweight in Bangladesh adult population. Both overweight and underweight results in a wide range of morbidity and mortality that impose a huge negative impact on socio-economic development. A number of socio-economic, demographic, lifestyle and dietary factors are significantly associated with underweight and overweight in adult population of Bangladesh. Population level impact of these factors should be examined to design suitable public health and nutrition interventions to address this dual challenge.
7. DATA STATEMENT
The data is available on request.
CONFLICT OF INTEREST
None.
ACKNOWLEDGMENTS
This research activity was supported by the Strategic Partnership Agreement (SPA) with AusAID and UKAID. BRAC acknowledges with gratitude the commitment of the AusAID and UKAID to its research efforts. We thank the respondents who gave their time generously to provide information as well as the field data collection team and data management staff who worked tirelessly.
APPENDIX A
SUPPLEMENTARY DATA
Supplementary data associated with this article can be found, in the online version, at
REFERENCES
Cite this article
TY  - JOUR
AU  - Dipak K. Mitra
AU  - Sabuj Kanti Mistry
AU  - Kaosar Afsana
AU  - Mahfuzar Rahman
PY  - 2018
DA  - 2018/12/31
TI  - Demographic, Socio-economic and Lifestyle Determinants of Under- and Over-nutrition among Bangladeshi Adult Population: Results from a Large Cross-Sectional Study
JO  - Journal of Epidemiology and Global Health
SP  - 134
EP  - 142
VL  - 8
IS  - 3-4
SN  - 2210-6014
UR  - https://doi.org/10.2991/j.jegh.2018.03.002
DO  - 10.2991/j.jegh.2018.03.002
ID  - Mitra2018
ER  -