
Satellite Image Based Characterization for Monitoring Urbanization and Land Cover Change
- DOI
- 10.2991/ijndc.2018.7.1.1How to use a DOI?
- Keywords
- Urbanization; remote sensing; satellite images; multispectral characteristics
- Abstract
Land surface processes have become a great concern in the context of global change and increased natural hazards all over the world. In this paper, dynamic characteristics of land cover changes have been investigated over a period of about three and half decades (1972–2016). This study focuses on the temporally evolving geo-environmental characteristics of Dhaka (Capital City) in Bangladesh. The analysis has been performed in a platform of Geographical Information System (GIS) configured with Remote Sensing (RS) system and ground-based RS measurement facilities. Radiometric analyses of multi-sensor time series satellite data followed by a process of spectral characterization have been performed. Special focus has been made on biophysical properties of surface features, geo-environmental configuration, land physiography, properties of vegetation and co-existing surface features. Earth Resources Data Analysis System (ERDAS) Imagine Image Processing Software and ArcGIS software have been utilized. It appears that both energy and water regimes have been affected particularly across the outer end of the side encroaching the city. In general, the outer side of the city consists of low land areas that is used to drain out water and to hold run-off water from the city. Feature-based analysis of satellite-derived radiative signal demonstrates dependencies on biophysical characteristics of surface features in response to human intervention under demographic pressure. Important class categories, particularly, built-up areas, crop land, water bodies have been studied to figure out the zones experiencing unplanned human interventions due to recent urban growth. This generalized pattern of urban growth appears to be a useful finding for urban planning and policy for the government of Bangladesh. Finally, it is evident that integration of space-based RS technology with GIS provide better platform to perform such activities.
- Copyright
- © 2018 The Authors. Published by Atlantis Press SARL.
- Open Access
- This is an open access article under the CC BY-NC license (http://creativecommons.org/licences/by-nc/4.0/).
1. INTRODUCTION
Industrialization and development of technology have contributed toward urbanization. Villages and cities are being converted to urban areas frequently. Most of the expansion of urban areas and development has happened centering Dhaka. The urban growth rate has risen up massively since the last 15–20 years. About 2 billion people live in the city of Dhaka. To accommodate this huge population, the infrastructure and land use has also seen a rapid change. Social development, better financial chances, and better lifestyle have been the most intensive and leading factors toward the change in land use. The fast development has also caused changes throughout Dhaka. The number of markets, industries, airports and other establishments have increased, which has attracted more people in this town. As a result changes in land use is happening every day by leaps and bounds.
In this context, remote sensing (RS) imagery and techniques can be useful. Terabytes of images are generated every day from the satellites that have been launched to monitor the Earth. These images show the conditions of built-up areas, vegetation, water bodies and other natural and man-made entities. Satellite images for land cover analysis and classification provide promising results and enable to perform a detailed study on areas that otherwise, would not have been possible.
The development of Satellite-based Remote Sensing (SRS) technology integrated with Geographical Information System (GIS) significantly enriched the science of acquisition and analysis of geo-information. Many new satellite sensors with diversified application capabilities have evolved during the last decade. Proper utilization of RS technology can provide valuable information on the growth and condition of agricultural crops.
However, utilization of such data in a particular geo-discipline requires specific and appropriate theme oriented algorithm or analytical procedure for inferring relevant information. Diversity in geo-environmental condition and variation in the nature of utilization in different parts of the world necessitate region specific development, adaptation and utilization of RS procedures for maximizing the precision and benefit of such modern technology. Bangladesh has to make proper utilization of the latest development of SRS technology.
Specifically SRS technology by virtue of its large area synoptic coverage, spatially continuous, regular and repeated observation capability, facility to make observation under all-weather condition and potentiality in providing information in various geo-disciplines appears to be one of the most powerful and effective tools for addressing such multi-disciplinary spatial issues. Proper integration of RS technology with GIS constitutes a unique solution for addressing various geo-disciplinary problems and issues in the spatiotemporal domain.
In satellite-based data acquisition system, temporal and spatial resolution are generally two different terms. Higher spatial resolution sensors generally have relatively lower temporal resolution. While, higher temporal resolution sensors generally have relatively lower spatial resolution. Higher temporal resolution is suitable for study the dynamic behavior of surface cover as a function of time. Whereas, high spatial resolution data generally provides more information detail. Integration of these two types of data in a suitable way can possibly provide a better option to the researchers, particularly, for the agricultural monitoring in this country where the size of the land is relatively small. This study has also an intention to work on this theme.
To perform the analysis on satellite images, a reliable workflow and model has to be designed. This workflow consists of multiple measures and decisions based on the information that has to be obtained from the image. This extraction of information from the data can be difficult and time-consuming. Therefore, the goal is to design a general pattern for analysis of the images that can, later on, provide important details in terms of the changes and development of the land use.
The objective of this research is to analyze and interpret the satellite images of the study area. By performing this analysis various information on different types of lands can be generated. This approach uses various RS techniques and algorithms. The interpretation is performed for various years spanning over three decades. This gives a clear picture of the changes and also provides an accurate representation. Finally, it generates a number of visuals and illustrations representing the change in land use patterns and also showing the rate of urbanization for the cities in the Dhaka district.
2. STUDY AREA
The area chosen for this study is the Dhaka district. It consists of six smaller cities. These are Dhamrai, Savar, Dhaka, Keraniganj, Nawabganj and Dohar. Among which Dhaka, Savar and a few places in Keraniganj has experienced visible development and urbanization in recent times. Dhaka is the capital and the largest city of Bangladesh. It accommodates the lion’s share of the huge population of the country. After the 1990s, the urbanization and industrialization have begun enormously in this city.
Many social and economic factors played the role of catalysts for attracting people from all over the country to migrate to Dhaka. As people started migrating to Dhaka the land use started to change significantly. High raised buildings and skyscrapers are a common scene now on every block of the city. Besides construction of houses for this large number of people, the city needed to provide more land to the countless industries that have been established. They are more often located near the rivers. As a result, the rivers and water bodies have been overused. All these factors are influential for conducting a study for analyzing the patterns of land use for the district of Dhaka. Another objective is to monitor and figure out the changes across multiple decades and to find the areas where the changes are maximum.
3. RELATED WORKS
Zhang [1] studied both physical and the socioeconomic factors in his research for Dongguan City. Similar to our approach, this research also took in the account of the physical factors, RS data along with digital elevation model, and slope data, which is not required for our study of Dhaka, as it is a low-lying land. The land cover and the land changes were classified using ArcGIS while we opted for ERDAS Imagine. Schneider [2] addressed a similar problem in his study where the focus was on observing the changes of temporal data before and after urbanization. Google images were classified using supervised classification techniques. Instead of using Google images for our research, we depend on multispectral images for better results. Images of various sources and varying resolution are used for assuring best possible results.
Padmanaban [3] focused on cellular automata like Zhang [1] to mine spatial-temporal data. Multilevel classification was also used. The main premise of this research was to give a better management system for utilities. This is also one of the key concerns of growing Dhaka city; hence, this research is quite similar to ours. This research faces issues of diverse data and scaling of the spatiotemporal elements. We have tried to improve this using multispectral data. Similarly, as Padmanaban [3], Boulila et al. [4] stated how fuzzy logic can provide a different insight into traditional mining of spatiotemporal data. Satellite Pour l’Observation de la Terre (SPOT) images were used which were quite different from other researchers who chose to use images of Google earth, GIS, and United States Geological Survey (USGS). Mennis and Liu [5] took a different route and used association rule mining to understand these urbanization changes. They focused on Denver, Colorado and saw the rise in the period of twenty years. For our paper on Dhaka city, we have looked over 40 years of data to get a better understanding.
Duro et al. [6] had shown that pixel-based image analysis of RS data is just as effective as an object-based approach. They had compared different machine learning algorithms on labeled datasets and shown that the difference in accuracy is very insignificant (p > 0.05). In their study, the pixel-based approach required fewer variables and took less time for the classification task. An attempt by Durieuxa et al. [7] to apply object-based analysis on areas with densely packed buildings had shown that object-based methods had limitations in defining the proper class labels because of the variance of shape in buildings and their relatively higher density when compared with sparsely urbanized areas. We have used pixel-based classification since object-based classification does not provide any additional advantage in accuracy.
A very limited number of studies could be found for Dhaka. There are a few for the other districts but Dhaka has not been studied using the measures adopted or anything similar to the one in this paper. As Dhaka is at 10th position in the world’s most populated cities as of 2018, it is important to understand the patterns and growth at which the city has been expanding.
4. RADIATIVE RESPONSES OF DIFFERENT LAND COVERS
The solar radiation that any object can reflect is dependent on its wavelength and properties. This allows to differentiate various land cover types based on their response values for a specific wavelength. Hence it can be a means of identifying a particular land pattern. However, this spectral signature varies for the same object or same geolocation during a year. It happens because at different time along the year the land can have vegetation that is about to grow, or it has fully grown. It may vary depending on the season, which can give an illusion that the land cover has changed significantly. Various other features that contribute toward the particular characteristic of soil is moisture content, structure and color. These specific spectral characteristics help to classify the objects based on their reactance and behavior.
Trees and crops can easily be identified among all the other objects, as they have a unique characteristic. Their spectral response pattern can be used to characterize and identify green vegetation and crops from other surface features. Green vegetation is solely dependent on photosynthesis for their food production which requires sunlight of visible wavelength. Therefore, the chlorophyll from the leaves of the plants absorbs light in the visible wavelength. So plants do not show much reflectance toward the visible wavelength of light. Therefore, plants can easily be distinguished by analyzing the dominant reflectance toward near infrared, as plants do not absorb much of it. This rule applies to both crops and other vegetation or trees. However, there is a small distinction in it as well. For crops, the image is mostly solid and uniform all over. While non-vegetation and trees display a noisy and textured response as evident in Figure 1b.
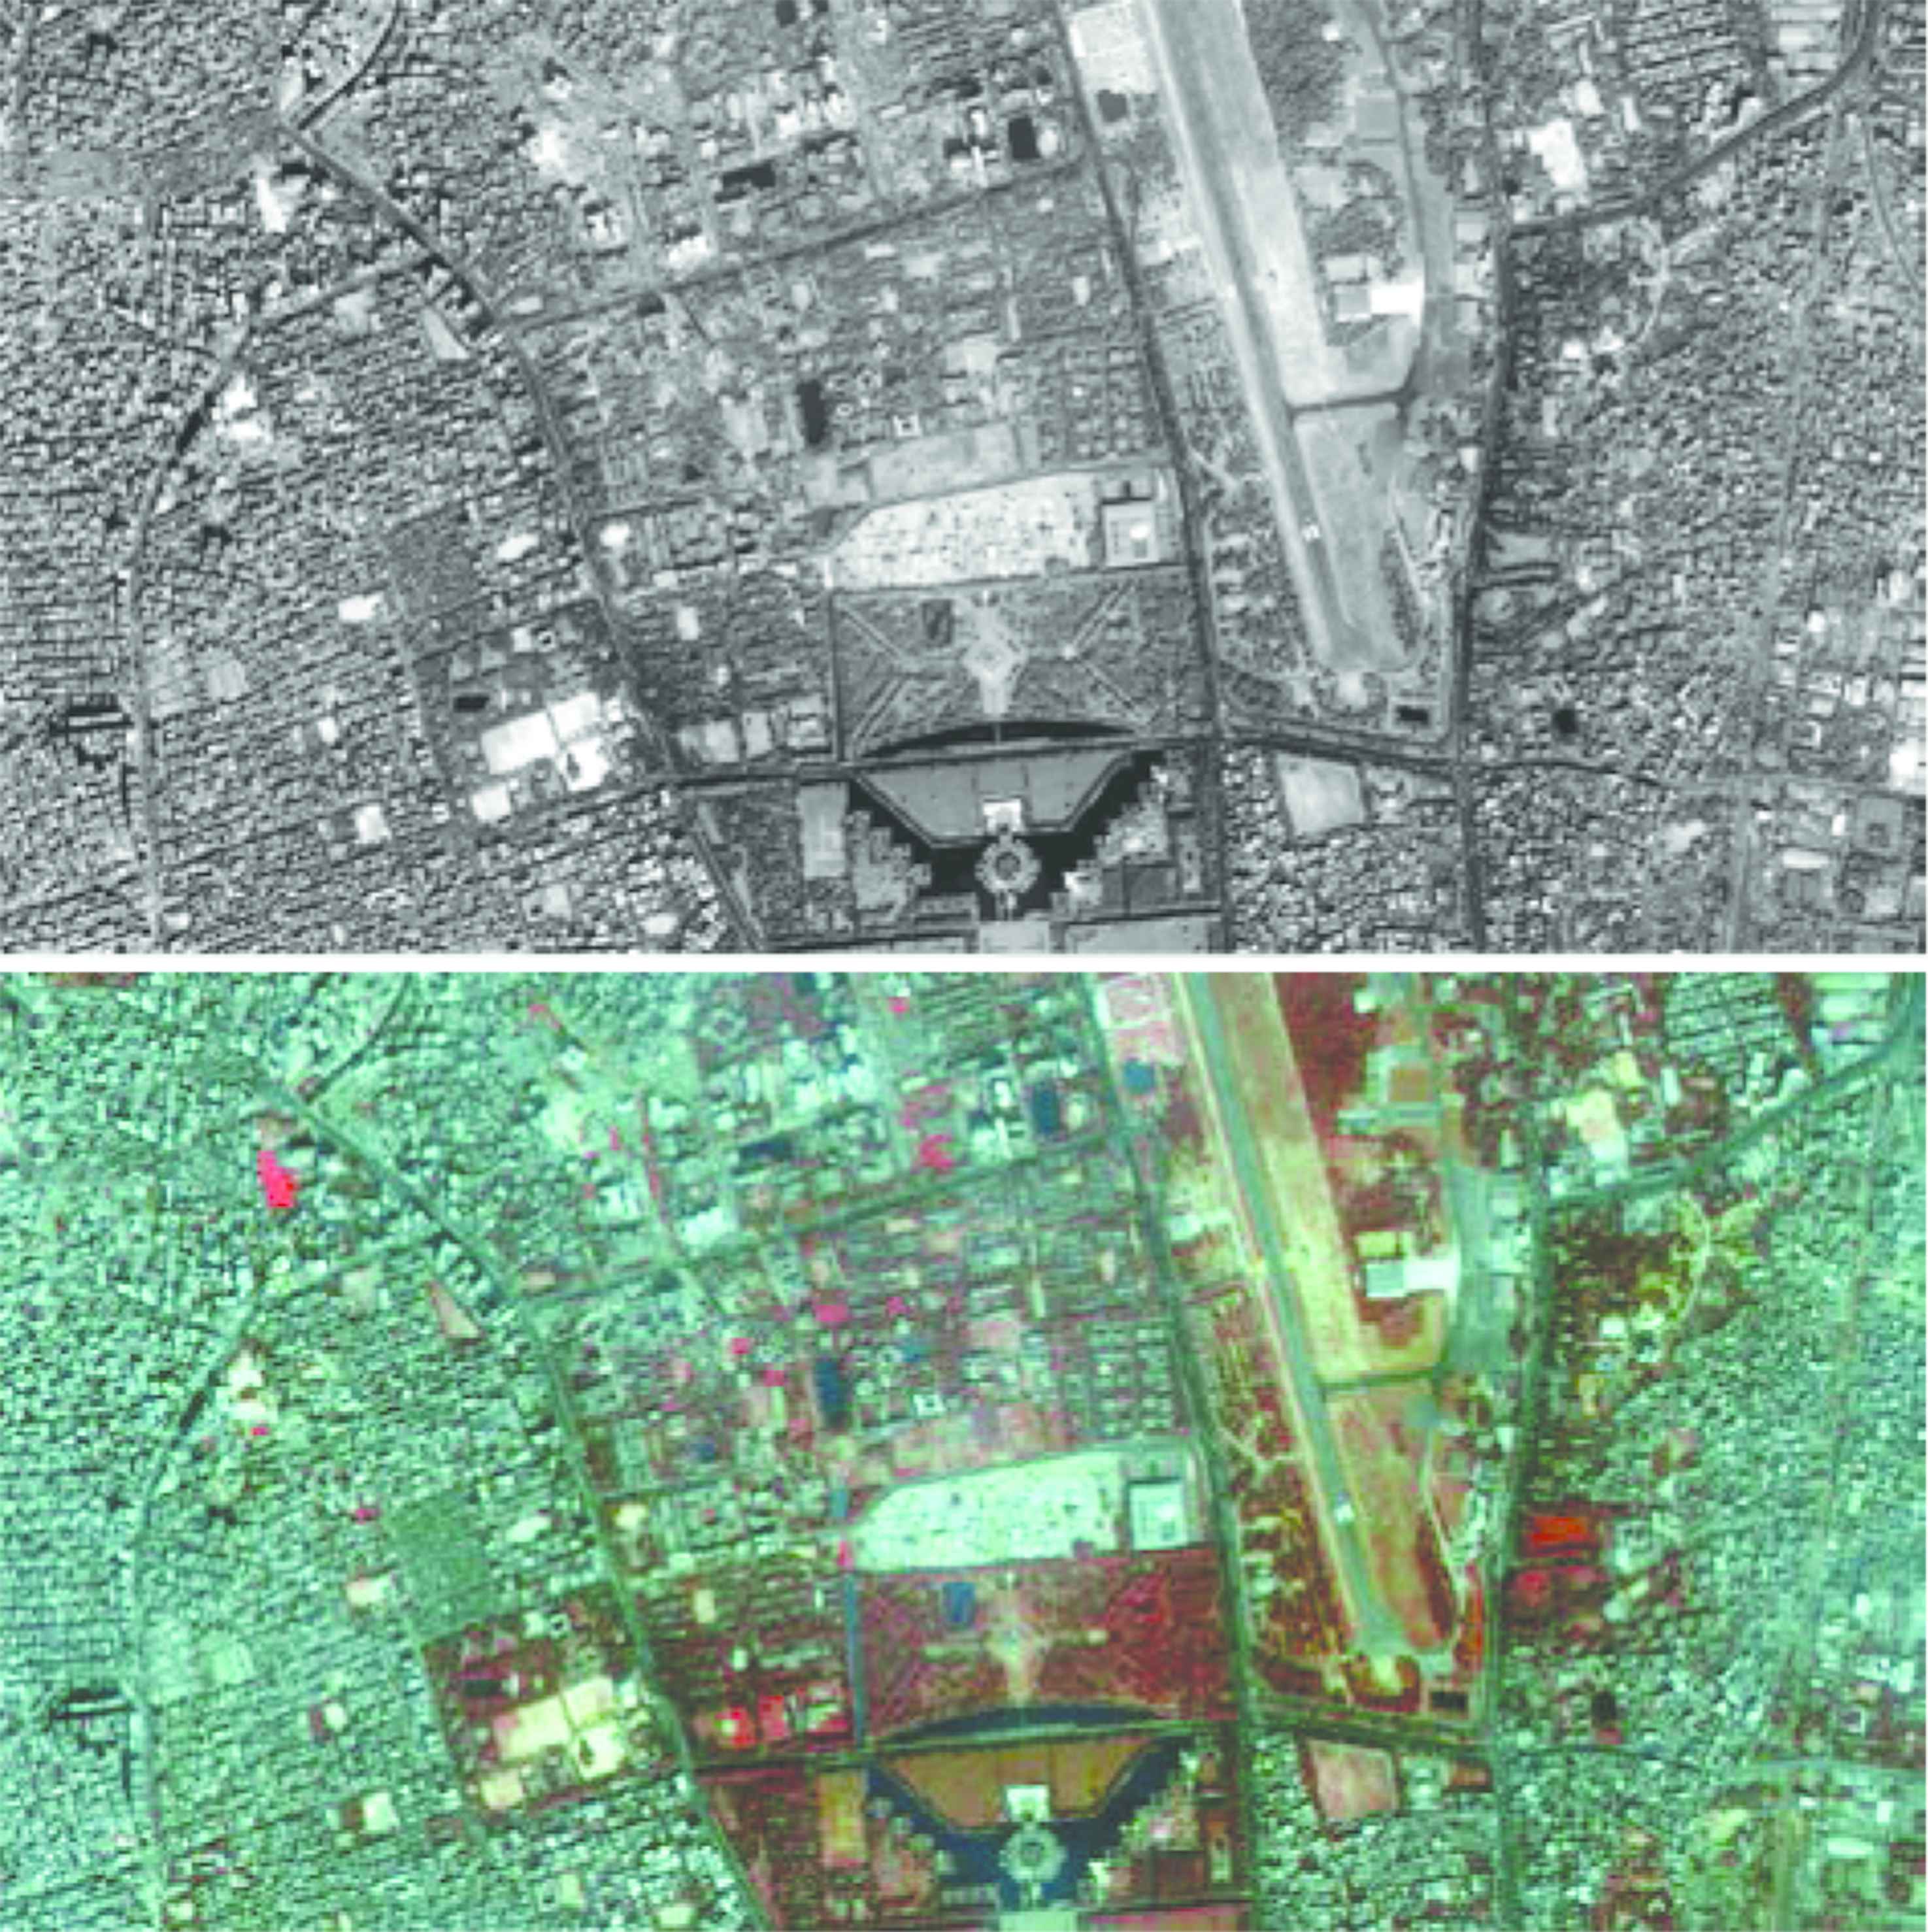
(a) High spatial resolution (0.8 m) panchromatic image. (b) Spectral color composite of multispectral satellite image (4 m spatial resolution) representing part of Dhaka city. The parliament building along with Manik Miah Avenue, and part of Lalmatia areas is seen in the image
Water shows varying response value based on various properties such as suspended sediments or dissolved matters. Turbidity and water depth also play a significant role here. Clear water offers minimal response values. For turbid water and closed water, the response value varies according to the level of turbidity and sediments.
All these factors were taken into account in the spectral analysis. Using different spectral response of various surface features, they are identified and classified. Images of varying time spanning over four decades are chosen to accomplish this initial task.
Figure 1a and b show a part of the Parliament building and its surrounding in the panchromatic and spectral color composites dated March 3, 2016. The panchromatic image having a spatial resolution of 0.8 m and the color image has a spatial resolution of 4.0 m. In both the images, the details of the individual surface features and structures are readily visible. The fine definition of the panchromatic image shows a comparatively better spatial definition of the surface features. The two satellite images correspond to the same acquisition time so that seasonal variation has minimum effect on the spectral response values.
Earth observation using RS utilizes the energy reflected from the earth’s surface features to the satellite. Information retrieval process generally analyzes the biophysical properties of different surface features under observation, their spatial distribution, properties of the background soil based on the radiative measurements by the sensor. The interaction of solar electromagnetic energy with the targets takes place through absorption, reflection and transmission. The composition, distribution, as well as optical and structural properties of the objects, determine the bulk of the radiative signal that will be captured by the sensor on board the satellite.
In a biophysical system, wavelength of radiation, soil properties and moisture content, along with vegetation cover and densities largely regulate the energy and mass exchange through evapotranspiration, photosynthesis etc. The wavelength ranges of different spectral bands of LANDSAT 8 have been provided in Table 1 [8,9].
| Band | Wavelength | Useful for mapping |
|---|---|---|
| 1 | 0.435–0.451 | Coastal and aerosol studies |
| 2 | 0.452–0.512 | Bathymetry, soil, vegetation |
| 3 | 0.533–0.590 | Vegetation used for analyzing plant |
| 4 | 0.636–0.673 | Vegetation slopes |
| 5 | 0.851–0.879 | Shorelines and biomass |
| 6 | 1.566–1.651 | Soil moisture and vegetation |
| 7 | 2.107–2.294 | Soil moisture and vegetation |
Characteristics of satellite Landsat 8 sensors spectral bands
The radiative characteristics of the intervening parameters and factors have been analyzed. Spectral profiles have been drawn over Landsat TM image of February 15, 2016 in the spectral bands 2–7. Figure 2 shows the spectral response patterns of important surface features at different locations over the area under this study. Significant variations are observed both in terms of pattern and amplitude for individual feature types. For vegetation and agricultural crops, the response curve shows a minimum around band 3 due to large absorption of solar radiation by the chlorophyll present in the vegetation. While large scattering in the near-infrared (NIR) bands results in relatively high response values at the sensor level. The variation in vegetation condition and growth at different locations generally produces such variation.
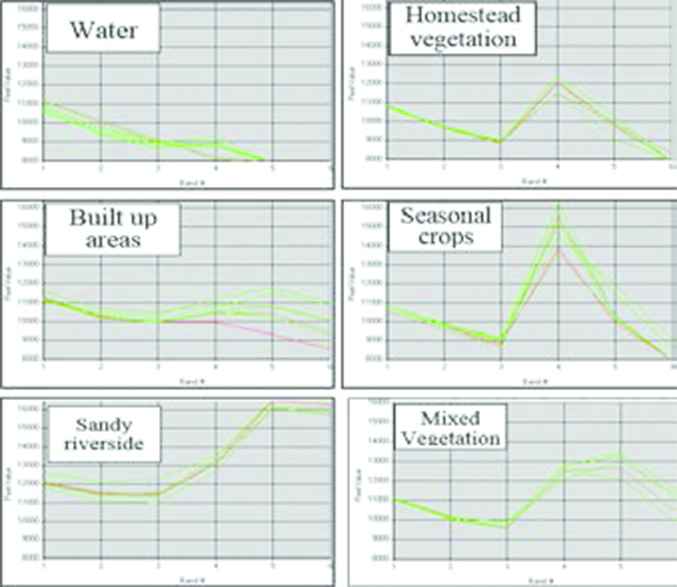
Spectral profiles drawn at different locations over an image of Landsat Enhanced Thematic Mapper (ETM) of February 15, 2016 show appreciable variation in spectral responses for different surface features in different spectral bands 2–5, and 7 of Landsat ETM
Water area offers gradual decrease of response values towards longer wavelength due to increased absorption. The variation in spectral signature patterns aids the processes of information retrieval. The sandy areas along the riverside largely reflect the incident solar radiation producing large response values. The amplitude and spectral pattern of each of these feature categories offer unique characteristics as is evident from these spectral profiles. Built-up areas show a different response pattern as compared with other classes. In this area, concrete materials represent relatively low absorption of solar radiation that offers a different and distinct pattern to distinguish the built-up areas from the rest of the surface features using satellite data of visible and NIR region. Such a pattern of spectral response produces a different color representation of the area. The spectral signature patterns, as well as amplitudes, are being used to identify and discriminate the built-up area under this study.
Numerous changes of surface features over the years have been analyzed and studied using multidate satellite images. In Figure 3, significant changes in surface cover have been observed for multiple years indicating the associated modification. The disappearances of the vegetation patches for the images of 2000 and 2017 have been noticed (transformation from red to cyan color in the image). The vegetation has been replaced by concrete and settlement that associated relatively high reflectance both in the visible and NIR spectral region that resulted in cyan colour for the latter acquisition date.
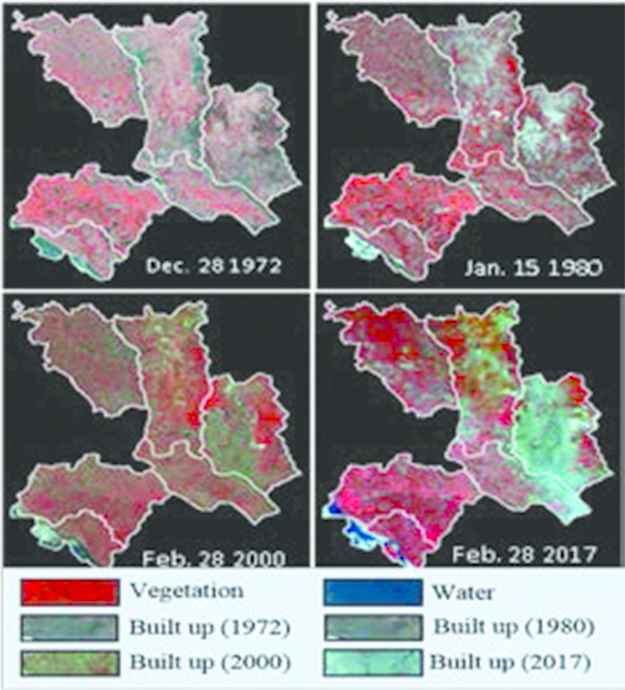
Spectral color composite images of Landsat multi-spectral scanner of December 28, 1972. Thematic mapper bands 3, 4, 5 (B, R, G) of February 28, 2000 and February 28, 2017 representing Dhaka district area composed of six administrative units of Dhamrai, Savar, Dhaka, Keraniganj, Nawabganj and Dohar
5. DATA UTILIZATION
In this study, a number of satellite images covering a period from 1972 to 2016 have been used. Landsat multi-spectral scanner and Thematic Mapper (TM) have obtained from the official site of USDA [10]. Terra Moderate Resolution Imaging Spectroradiometer (MODIS) satellite data obtained from the MODIS website [11]. While the Ground Control Point (GCP) required during image geo-rectification and geo-referencing of the satellite images have been collected from Bangladesh Space Research and Remote Sensing Organization (SPARRSO) [12].
6. CLASSIFICATION AND IDENTIFICATION OF SURFACE FEATURES
In this study, the classification was done on the image for identifying various clusters of lands. It is achieved by forming groups of homogeneous regions across the image. These homogeneous regions are called classes and each of this subgroups signifies different land cover types based on their characteristics. The unsupervised method of classification has been applied that has a common intent to expose the major land cover classes that are present in the image without any knowledge beforehand of the images actually represent. This form of analysis used in our study falls under the domain of cluster analysis. It is called such as it tries to form clusters of sub-regions in the image that show similar reaction and response characteristics in a multispectral image. Clustering also provides a general sense of the land use pattern since it analyzes the entire image and finds any repetitive pattern that is common between neighboring groups. It tries to identify the clusters of data from the image, calculates the mean with respect to every image channel. After that, each and every pixel is assigned to one specific cluster on the basis of the minimum distance.
The clustering process starts by assigning an arbitrary initial cluster vector. Next, it assigns all other pixels to the cluster that is the nearest from that particular point. Afterward, the new mean vectors for all the clusters are calculated based on all the pixels in one cluster. These last two steps are repeated a number of times before the variation has reached a minimum threshold. This threshold can be calculated by measuring the change of the distances of the mean cluster vectors from one iteration to another. On the other hand, it can be calculated using the proportion of pixels that have changed with different iterations. The target of K means clustering is to maximize inter-cluster distance and to minimize intra-cluster distance. The objective is to minimize a specific cost function, which calculates and provides the approximate error in the clustering. It is called the sum of square distances and is calculated using the squared distances between each pixel and its assigned cluster center. The goal of a good classification is to minimize this Mean Squared Error (MSE) function.
Based on the geological surface and land use habits, five categories are chosen to be the target classes. They are water bodies, crops, other vegetation, built-up and others. There are numerous lakes, marshes and ponds all over Dhaka with many rivers such as the Buriganga, Turag which fall under this class. Bangladesh is a fertile land and has crop fields all over the country. In recent times the amount has reduced significantly, yet, they are very much visible in all other cities. These crops are mainly rice fields, wheat fields, potato and pulse cultivation lands. These patches of lands are most convenient to classify as they show their special reflectance characteristic in the images. Their high reflectance toward the light of NIR range is used to differentiate them from the rest of the surface objects. They produce a relatively smooth and strong pattern in the satellite images depending on the spectral band.
Non-crops, trees, patches of grassland fall under the category of “other vegetation”. They display similar spectral characteristics like the crops. An important difference is that their response to the multispectral signal is not that strong like the crops. They display texture properties while for crops it is smooth and strong. Not only non-crops’ signals are weaker than crops but also they span for smaller regions. For non-crop areas, as they do not span for longer areas the regions are more distributed and discontinuous for large areas. Whereas, for crops, it can be across acres of lands that we might find the same signal level.
The next category, built-up areas is the most important criteria of analysis in this study. Concrete and asphalt have their specific level of reactance and reflectance level to the multispectral signal. They exhibit different characteristics than water or crops. The urban settlements are heavier in Dhaka city, Savar and partially in some parts of Keraniganj. While classifying this study does not treat bare soil lands, sand areas or riverbanks as built-up areas. For smaller cases like these, they are put into the 5th and final category which is named as others. It is named such because it is of trivial proportion compared with all the other classes and is insignificant for our study.
7. ANALYSIS AND EXTRACTION OF GEO-INFORMATION
All the images are geometrically corrected using ERDAS Imagine. Such corrections largely minimize the deformations due to variation in observation angle to assure precise positioning of the surface features in the images. Transverse Mercator projection system is utilized to linearize the feature deformation. Geo-referencing of the images has been performed using GCPs as provided at Bangladesh Space Research and Remote Sensing Organization (SPARRSO). Furthermore, necessary radiometric calibration has been done with calibration parameters internationally available.
For classifying the images into the pre-selected categories, the unsupervised classification technique is used in ERDAS Imagine Image Processing Software. As our study area consists of smaller parts: it exhibits variable characteristics in the image for different subparts. Therefore, to get an accurate clustering that closely resembles the original image, a bigger number of target classes are chosen than our original goal. Afterward, clusters with similar behavior and multispectral signature are merged to form a bigger cluster.
This approach is beneficial due to the fact that in a city, e.g., Dhaka, having a large number of urban areas, the variance among similar features is minimum. Therefore classifying urban areas in Dhaka is relatively simpler. For a remote town for example, for Dohar, the change across years has to be verified and properly analyzed. The objective is to select a number of classes bigger than the target but not too big, so that the generalization is not enough. While merging the classes, various high-resolution images of the same time are used for cross-checking and frequent images (of the next and previous years) are analyzed. This confirms the accuracy of the clustering and provides assurance that the merging is accurate. In our case, we initially have started with eight target classes. Later on, after further analysis and rectification, they are merged to five classes. The created classes all have distinct properties and different characteristics in terms of reflectance to energy bands and multispectral signature. The differences between each of the classes can also be visualized from a spectral curve. A sample of the classification results can be seen in Figure 4.
Samples of results of classifying images of two different years into the predefined classes following the approach explained
8. WORKING METHODOLOGY
Changes in landcover and associated biophysical surface properties and their ultimate effects on surface radiative properties particularly on surface albedo in south-western part of Bangladesh over the time period of about 20 years from 1980 to 2015 have been studied. The widely used Surface Energy Balance Algorithm for Land (SEBAL), which represent major surface processes and process parameters through a series of mutually coupled analytical function, has been utilized in a computational platform of ERDAS imagine software applying Spatial Modeler Language (SML) to derived Normalized Difference Vegetation Index (NDVI), land surface albedo and land surface temperature using Landsat 5 TM data considering the relatively important land use type of water, soil, sand, settlement, shrimp farm, forest and agricultural crop. Besides this study has been supplemented with in situ crop information together with climatic data particularly rainfall and temperature for this region. These radiometric analysis postulates a dynamic mechanism involving (i) climate and (ii) cropping characteristics that ultimately govern the overall geo-environmental configuration and dynamic surface processes over the area exhibiting dynamic changes in landcover. Such conversion over the area associates significant changes in surface radiative and geo-environmental properties as demonstrated through surface albedo and surface temperature therein. The study postulates significant differences of NDVI, surface albedo and land surface temperature due to the conversion of landcover from water to sand meanwhile these difference decreases for conversion from water to soil as from shrimp area to soil and further decreases for transformation from soil to crop. Differences of radiative parameters have also been observed for the conversion from crop to settlement and from soil to settlement but not as prominent as other landcover changes in the study area. Highest surface albedo has been found over the sandy area. The analysis revealed the increases of surface temperature by about 10°C and 30°C for landcover conversion from (i) crop into settlement and (ii) water into soil, respectively. All other categories of landcover conversion generally indicate decreases in surface temperature.
Changes in landcover and associated biophysical surface properties and their ultimate effects on surface radiative properties particularly on surface albedo in south-western part of Bangladesh over the time period of about 20 years from 1980 to 2011 have been studied. The widely used SEBAL, which represent major surface processes and process parameters through a series of mutually coupled analytical function, has been utilized in a computational platform of ERDAS imagine software applying SML to derived NDVI, land surface albedo and land surface temperature using Landsat 5 TM data considering the relatively important land use type of water, soil, sand, settlement, shrimp farm, forest and agricultural crop. Besides this study has been supplemented with in situ crop information together with climatic data particularly rainfall and temperature for this region.
This section of this study deals with the monitoring the changing environmental setup and expansion around Dhaka city. Time series satellite images mostly on decadal basis have been utilized. The potential of images have been demonstrated. The study demonstrates that a single date image might not be sufficient in many places over the study area. The seasonally changing geo-environmental set up associates appreciable changes on properties and their spatial distribution. The study covers a period of about 40 years ranging from 1972 to 2015. Spatial characterization of the satellite based geo-information over the study has been performed considering biophysical and optical properties of the surface features. The study shows a significant of dynamics of surface features over the area. Satellite images particularly of March around seemed to be appropriate and a multi-date of at least two contrasted seasons has been recommended. The study also postulates that combination of high resolution and moderate high spatial resolution with the visible and NIR wavelength provides an effective information retrieval.
Landcover undergoes changing with time due to various reasons, such as to meet the demand of increasing population some of the crop fields have been transformed into settlement area whereas the development in technology transformed the bare soil into crop field area. On the other hand, some portion of depressed water logged area in southwestern part of the study area is now used as a shrimp farm. For this study, the NDVI, surface albedo and surface temperature for water, soil (dry and wet), settlement, shrimp farm, agricultural crops and Char land (sand) have been computed to observe the effect of landcover changes. Table 2 provides NDVI, surface albedo, surface temperature values etc. associated with decadal landcover changes.
| Point ID | 1980 | 2016 | Change (%) from 1980 to 2016 | |||||
|---|---|---|---|---|---|---|---|---|
| Land use | NDVI | Surface albedo | Land use | NDVI | Surface albedo | NDVI | Surface albedo | |
| ID 01 | Crop | 0.68 | 0.17 | Settlement | 0.42 | 0.15 | 25.31 | −38.65 |
| ID 02 | Crop | 0.66 | 0.16 | Settlement | 0.49 | 0.15 | 25.68 | −24.94 |
| ID 03 | Crop | 0.66 | 0.15 | Settlement | 0.42 | 0.16 | 25.30 | −35.19 |
| ID 04 | Crop | 0.73 | 0.18 | Settlement | 0.45 | 0.17 | 25.70 | −38.34 |
| ID 05 | Crop | 0.72 | 0.18 | Settlement | 0.51 | 0.16 | 24.39 | −29.93 |
| Average | 0.69 | 0.17 | 0.46 | 0.16 | 25.28 | 5.01 | ||
| ID 06 | Dry soil | 0.24 | 0.20 | Crop | 0.60 | 147.18 | −4.40 | −9.24 |
| ID 07 | Dry soil | 0.25 | 0.20 | Crop | 0.59 | 136.64 | −19.94 | −10.03 |
| ID 08 | Dry soil | 0.23 | 0.17 | Crop | 0.59 | 160.16 | 0.93 | −4.14 |
| ID 09 | Dry soil | 0.23 | 0.20 | Crop | 0.58 | 152.39 | −17.25 | −10.01 |
| ID 10 | Dry soil | 0.31 | 0.20 | Crop | 0.61 | 99.99 | −16.06 | −6.99 |
| Average | 0.25 | 0.19 | 0.59 | 0.17 | 25.56 | −8.13 | ||
| ID 11 | Wet soil | 0.15 | 0.12 | Crop | 0.66 | 0.20 | 24.57 | 337.98 |
| ID 12 | Wet soil | 0.16 | 0.09 | Crop | 0.63 | 0.17 | 23.81 | 296.87 |
| ID 13 | Wet soil | 0.16 | 0.08 | Crop | 0.60 | 0.17 | 24.71 | 267.67 |
| ID 14 | Wet soil | 0.13 | 0.14 | Crop | 0.61 | 0.18 | 24.68 | 370.21 |
| ID 15 | Wet soil | 0.14 | 0.08 | Crop | 0.56 | 0.18 | 24.75 | 292.38 |
| Average | 0.15 | 0.10 | 0.61 | 0.18 | 24.50 | 310.77 | ||
| ID 21 | Soil | 0.34 | 0.20 | Settlement | 0.37 | 0.15 | 27.44 | 8.28 |
| ID 22 | Soil | 0.26 | 0.17 | Settlement | 0.43 | 0.15 | 26.56 | 65.77 |
| ID 23 | Soil | 0.26 | 0.21 | Settlement | 0.45 | 0.14 | 26.14 | 74.90 |
| ID 24 | Soil | 0.41 | 0.20 | Settlement | 0.46 | 0.15 | 26.97 | 12.22 |
| ID 25 | Soil | 0.29 | 0.22 | Settlement | 0.41 | 0.16 | 27.00 | 43.36 |
| Average | 0.31 | 0.20 | 0.42 | 0.15 | 26.82 | 36.43 | ||
| ID 26 | Soil | 0.30 | 0.18 | Water | −0.11 | 0.14 | 21.93 | −137.29 |
| ID 27 | Soil | 0.20 | 0.21 | Water | −0.08 | 0.14 | 21.93 | −139.39 |
| ID 28 | Soil | 0.17 | 0.25 | Water | −0.12 | 0.15 | 21.93 | −172.51 |
| ID 29 | Soil | 0.17 | 0.24 | Water | −0.15 | 0.15 | 22.35 | −186.13 |
| ID 30 | Soil | 0.26 | 0.19 | Water | −0.09 | 0.14 | 21.93 | −134.47 |
| Average | 0.22 | 0.21 | −0.11 | 0.14 | 22.01 | −150.14 | ||
| ID 31 | Water | −0.15 | 0.11 | Settlement | 0.46 | 0.16 | 25.28 | −415.86 |
| ID 32 | Water | −0.25 | 0.12 | Soil | 0.30 | 0.18 | 26.21 | −220.24 |
| ID 33 | Water | −0.24 | 0.14 | Soil | 0.21 | 0.18 | 27.09 | −190.25 |
| ID 34 | Water | −0.21 | 0.13 | Sand | 0.16 | 0.22 | 28.36 | −175.96 |
| ID 35 | Water | −0.22 | 0.13 | Sand | 0.09 | 0.29 | 28.80 | −140.81 |
| Average | −0.21 | 0.13 | 0.24 | 0.20 | 27.15 | −214.94 | ||
Data corresponding to 1980 has been considered as reference year and percent difference from that of 2016 has been provided.
Image based statistics as retrieved from analysis of Landsat TM images of multiple dates. Normalized vegetation index (NDVI) is a widely used index for expressing the density, growth greenness of vegetation. Higher the value of NDVI higher will be the density and growth of vegetation
In this study, important biophysical parameters like surface albedo, surface temperature, NDVI under a given landuse category for two different years 1980 and 2016 have been obtained through necessary calculation using proper functions and coefficients. Land use category includes seasonal crop, dry soil, wet soil and water. Moderate Resolution Imaging Spectroradiometer (MODIS).
Table 2 provides a summary of the analysis obtained through systematic analysis with derivation of various biophysical parameters applying appropriate numerical functions along with proper coefficient. Calculations have been performed considering two representative years 1980 and 2016. The interval shows sufficiently long time interval between the reference years as considered. A comparison can be readily observed between the two reference years particularly 1980 and 2016.
Among the land cover conversion type, NDVI has been declined for modification of land cover from crop to settlement; soil to shrimp and water. On the other hand, NDVI have been increased for dry and wet soil for crop; soil to settlement; and water to Char land (sand) and soil. Maximum reduction of NDVI is observed for soil to shrimp and increased for wet soil to crop. Overall, the surface albedo fall for transformation of land cover from crop to settlement; dry and wet soil to crop; soil to shrimp, settlement, and water; while surface albedo rise for changing of land cover from wet soil to crop; and water to sand and soil. High reduction of surface albedo is found for alteration of land cover from soil to shrimp farm whereas rise of surface albedo are observed for water to sand. In terms of cropland to settlement area conversion, the NDVI (−33.3%) and surface albedo (−5.9%) decrease. It is well known that areas covered with agriculture crop have a brighter surface than settlement area. Shifting of light land cover to darker land cover increases the absorption of sunlight and thus causes local warming [13].
Therefore conversion of cropland (light land cover) to settlement (dark land cover) leads to decrease in surface albedo. In full cover agricultural cropland, soil has little effect on reflected properties whereas settlement areas have a combined effect of plant, man-made material, and soil. Mixing of tall trees, small trees, man-made material, and bare or fallow land increase surface roughness resulted trapping of reflected light. Due to this reason settlement land cover absorb more solar radiation and ultimately decrease the surface albedo value. But, in the cropland, same crop height lower surface roughness which ultimately increases the surface albedo compare to settlement area. Irrigated croplands have a cooling effect during growing season [14] and modification of surface albedo leads to changing in energy budget and surface temperature [8]. Replacements of cropland by settlement decrease the surface albedo results absorbed more solar energy lead to increase surface temperature.
9. RESULTS AND ANALYSIS
In this study, some interesting results and statistics are found. Urban growth patterns are extracted by analyzing the images of different years. Not only the growth of urban built-up areas are analyzed but classification and analysis has been done for the other target classes as well. After the classification of images of different years, the similar clusters are merged. Afterward, the image is finally recoded in ERDAS. This redefines the pixels based on their classes so that they are designated according to their classes that have been identified during classification. Then the final task is to generate the summary for the particular image. This is done using the Plot Summary Matrix of ERDAS Imagine which generates an overall statistics for the image. A sample can be seen in Figure 5. Here to generate statistics for the individual cities of the area of interest the vector GIS layer of the area is used. This contains the boundary location of each of the six cities of Dhaka district.
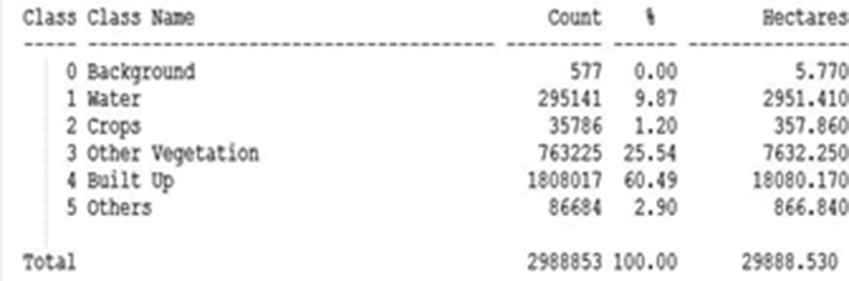
Generated statistics of performing clustering over the Dhaka district. This data shows only the information about the Dhaka city of this district
Figure 6 illustrates the changes in land use across three different years of Dhaka city. The percentage of land built-up has been increasing continuously across the years. While for crops and non-crop vegetation it is decreasing. This result reflects the current problem of mass urbanization and lack of greeneries that is visible in Dhaka. This study has prepared the multiple illustrations for all the other cities across multiple years as well based on the information and knowledge extracted after performing the classification and extracting the features.
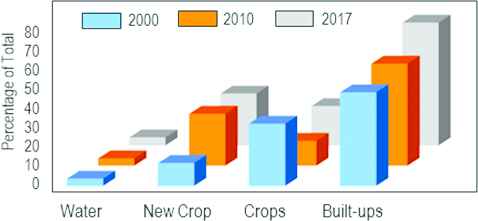
Major uses of lands for the years 2000, 2010 and 2017 as derived through analysis of time series Landsat satellite data. This figure only shows the proportion of land usage for Dhaka city
Extraction of surface properties and information is a major challenge in RS of Earth surface applying radiative signals as is reflected from the target of observation. The fundamental problem consists of transforming digital number as in a digital image to a meaningful geo-information. Earth surface is composed of three primary classes e.g., soil, vegetation and water. Radiative properties of each of these primaery classes are different. In particular absorption, scattering and emission generally determine the overall intensity of radiative signal. Information is to be extracted from this radiative signals. Figure 7 shows the radiative response at different position along the profile drawn over the digital images in 2016. The radiative intensity as obtained by the satellite sensor represent an average value of the signal over the smallest unit area called pixel. The proportion of distribution in a pixel under the three primary categories determine the radiative caharacterstics and intensity of the signal. Pixel wise variation of radiative intensity along the profile ultimately determine the variation in intensity and its variation pattern along the profile as drawn.
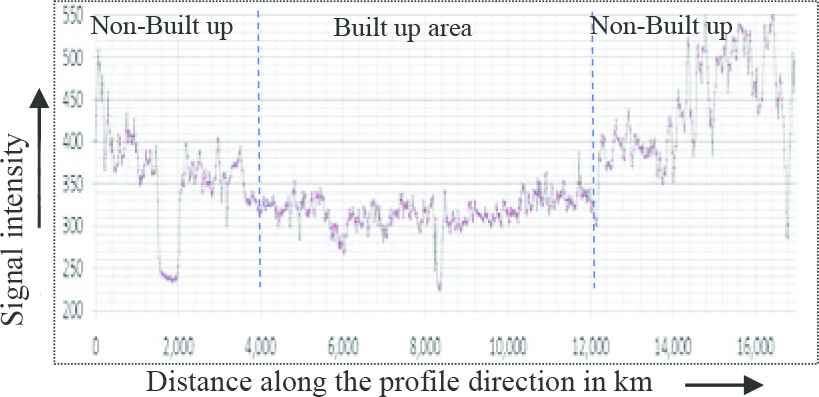
Spatial profile as drawn over an image of Landsat TM of January 2016. The curve corresponds to near infrared region of the solar spectrum
This curve corresponds to year 2016. The curve represents certain variations in signal intensity (y-direction) as we move from left position to right direction along the profile. The curve can be divided into three characteristically different segments. Curves exhibit similar variation pattern. Considering the variation characteristics, in general the curve can be divided into three prominent time segments A1, A2 and A3 as shown in Figure 7. Time segments A1 and A2 exhibit relatively larger intensity variation on moving along the profiling direction as compared with that of time segment 2.
The quantitative and reliable interpretation of data acquired from satellite platform requires a thorough understanding of the factors and condition that determine the reflectance at satellite altitude. Though the satellite data offers the most convenient way of monitoring vegetation condition and other surface features as well but still a lack of proper methodology to extract relevant vegetation and other feature information is noticed. Indeed, the surface features, agricultural practice and other exercised land-use practices are highly variable over the different parts of the world and create problems differently due to this varying surface pattern. Interpretation issue should be addressed and considered in the context of respective geographic location. A meaningful and reliable interpretation of satellite data can be accomplished through regular ground truth practice, field observation and measurements as supplement to satellite data application. In the recent years, the quantitative interpretation of satellite data becomes possible through the development of techniques and numerical models and functions.
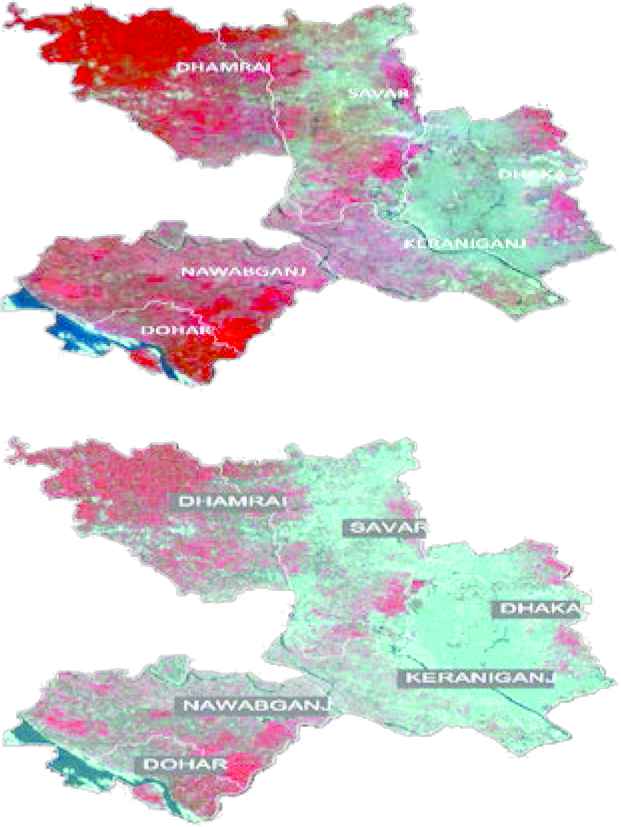
Figure 8 presents a summary of the rates of urban built-up across the years for Dhaka district. As it is visible from the image, for Dhamrai, the outburst of industrialization is not much. It has risen significantly from 2000 to 2010. Although the rate of change was not constant for 2016. This year shows a drop in the built-up areas. This might happen due to a number of reasons like people migrating to more developed areas or if the images used for data extraction is from a season that is dominant for crops. As crops dominate semi urban and non-urban lands it might cause a small drop in the area of urban lands due to vast lands of crops.
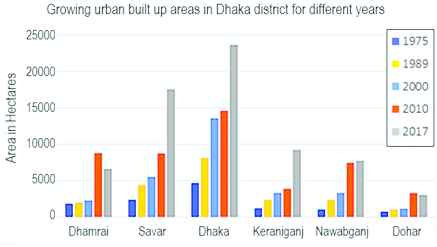
Sample of the results of urban built-up analysis across multiple years over the six cities of Dhaka district
Figure 9 shows a detailed illustration of the changes in land use pattern for Dhaka city. Dhaka shows almost identical characteristics for urban outspread. It had a few establishments on the initial years of the timeframe considered in this study. In recent times, the upward growth throughout the town is noticeable. The increase in urban areas in Dhaka city during the last 20 years have been 26%. The core reason lies behind Dhaka being the capital and the largest city of Bangladesh. Green patches of land and crops have started to decrease significantly in Dhaka, which is also supported by our study. The greeneries have started to disappear and currently accounts for only 18% of the overall area which is quite alarming. This recent trend is supposed to continue with time until it hits the saturation point at which there are few lands left to urbanize.
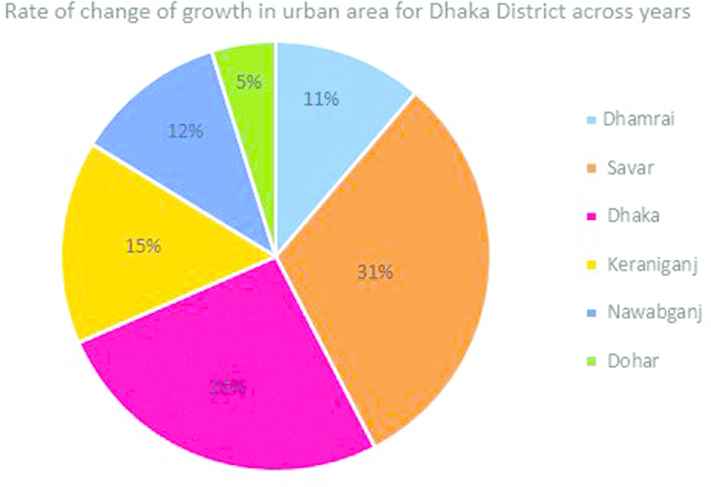
Percentage of increase of the urban areas inside the Dhaka district since the year of 2000
Analysis on Keraniganj shows small amount of urban growth. The number of areas covered by built-up areas were very low in previous years. In contrary, in recent times this city is getting the glimpses of urbanization as it is indicated by this study and the data extracted from the satellite images. During the last decade or more, it has increased by 15%, which is a significant figure. However, much of its total land use falls under crops and for all sorts of other vegetation such as trees, plants, grasslands, etc. About 44% of the total area falls under this category. This indicates that there is still a long way for this city to get fully urbanized.
For Nawabganj the study shows slight development in urban growth. Although the rate of growth has died down over the last 7–10 years yet it has certainly increased since 2000. According to the study conducted, the change in urban built-up areas accounted for a 12% increase, most of which had happened before 2010. So, it is evident that in recent times urbanization is not much present in Nawabganj compared with Dhaka or Savar. On the other hand, a large amount (72%) of land falls under the categories of crops and other vegetation according to the information extracted from 2016.
The minimal share of urban areas of the Dhaka district falls under the city of Dohar. It is not much developed and lacks improved infrastructures to trigger urban built-up. Consequently it has shown only 5% of urban development increase since 2000. 51% of the total land use from the year 2016 falls under crops and other vegetation, indicating that the majority of the land has not been urbanized.
The rate of urbanization has been higher in the developed cities like Dhaka and Savar. As it is seen from Figure 7, in recent times Savar, for its improved road communication system and modern infrastructure has managed to surpass Dhaka in urbanization. The fact that the city of Dhaka has almost reached its saturation point in terms of urbanization has also contributed to this as very few non-built up areas are left to be urbanized. The rate of increase in urban areas for the rest of cities are moderately increasing compared with these two cities.
10. CONCLUSION AND FUTURE WORK
Remote sensing has made substantial contribution in effective geo-information analysis and retrieval leading to efficient management. In this paper, techniques for mapping disaster extent and assessing damages have been developed which can be served as a guideline for RS and GIS operations to improve the efficiency of flood disaster monitoring and management. Application-oriented technical approach has been made that includes the development of necessary methodological framework based on a triangular technological initiative involving SRS coupled with appropriate ground RS technology platform and eventually guided by GPS-based positioning system. An object-oriented information layer taking into account various surface features has been generated using high resolution multiple satellite raster images. The complete setup with all the important intervening technical components has been encapsulated in GIS platform. A knowledge-based artificial intelligence technique trained with pre-defined feature specific spectral signature library has been employed to support and facilitate the information retrieval process. Following spectral pattern recognition protocol in conjunction with spatial data analysis procedure has been utilized for target information retrieval. Digital image based spectral characterization of radiative response pattern of individual surface features in relation to feature specific radiative signature library under the information retrieval process has been employed. A GIS database with continuous updating option has been created and established to archive and update the RS retrieved surface parameters and information.
The study deals with the monitoring of dynamic changes in the geo-environmental setup and expansion around Dhaka city. Time series satellite images on decadal basis for a period of about 39 years from 1972 to 2016 have been analyzed. Biophysical characterization of the time series images show systematic radiative changes in terms of amplitude and spectral patterns over the area under different demographic compulsion. Analysis depicts that radiative feature responses are largely biased by the water content of individual features. Satellite derived spectral responses exhibits appreciable sensitivities to physiographic land characteristics, moisture level, vegetation density and coverage. The temporally evolving geo-environmental setup associates appreciable systematic changes in surface features in terms of properties and their spatial distribution. Spatial characterization of the satellite-based geo-information over the study has been performed considering biophysical and optical properties of the surface features.
The information acquired from this study can be further used for predicting the future growth and expansion of Dhaka. In future it can be used to generate a model to find and analyze the cofactors that led to urban growth. In addition, this study can have a lot of importance toward city planning and to predict the possible changes in land use patterns for the coming years.
REFERENCES
Cite this article
TY  - JOUR
AU  - Farhan Rahman Wasee
AU  - Rahman Mohammad Asif Amin
AU  - Zareen Tasnim Raisa
AU  - Sadia Chowdhury
AU  - Tanisha Nourin Alam
AU  - Rashedur Mohammad Rahman
PY  - 2018
DA  - 2018/12/31
TI  - Satellite Image Based Characterization for Monitoring Urbanization and Land Cover Change
JO  - International Journal of Networked and Distributed Computing
SP  - 1
EP  - 10
VL  - 7
IS  - 1
SN  - 2211-7946
UR  - https://doi.org/10.2991/ijndc.2018.7.1.1
DO  - 10.2991/ijndc.2018.7.1.1
ID  - Wasee2018
ER  -