
A Novel Two-step Feature Selection based Cost Sensitive Myocardial Infarction Prediction Model
- DOI
- 10.2991/ijcis.11.1.65How to use a DOI?
- Keywords
- Cost sensitive SMO; Myocardial Infarction; Sensitivity; Two-Step Feature Selection; Prediction
- Abstract
Considering the rapid growth, complications and treatment side-effects of MI, so using data mining techniques seems necessary. On the other hand, in real-world MI cases are much less compared to healthy cases. The traditional algorithms for imbalanced problems lead to very low Sensitivity, thus, we propose a cost sensitive SMO model that utilizes a Two-Step Feature Selection, which aims to propose a model for prediction MI with regard to its imbalanced dataset to achieve a proper performance. In the dataset the MI cases in training set reduced to 9 against 410 healthy cases. After selecting 62 features, by feature selection, the Cost sensitive SMO which is allocated different misclassification cost as penalties is applied on the dataset. The results have shown positive impacts on performance.
- Copyright
- © 2018, the Authors. Published by Atlantis Press.
- Open Access
- This is an open access article under the CC BY-NC license (http://creativecommons.org/licences/by-nc/4.0/).
1. Introduction
Myocardial Infarction (MI) is the most common form of cardiovascular diseases 1, 2. Blockage of coronary arteries, due to atherosclerosis, and leads to decreasing the flow of blood and as a result occurring Myocardial Infarction 3. The result of atherosclerosis is thrombosis in the arteries and this causes Myocardial Infarction 3, 4, 5. 30% of deaths around the world is due to cardiovascular diseases. Moreover, in Iran 40% of deaths happens due to heart diseases 6.
Data mining technics are considered as the processes that find the hidden patterns and information in raw data 7. Classification, which is a predictive method, is considered as a method for discovering the prediction models for class labels of data and detecting the correct class for each unlabeled data. The main goal of common classification algorithms is placing unclassified cases in their classes, truly, and thus decreasing the classification error 8.
Although many researches is performed about prediction of cardiovascular diseases through data mining technics, the studies for MI prediction are very low. Baxt et al. 9 presented an Artificial Neural network for predicting MI in patients. They used a dataset includes of 2204 with 40 features. The results showed sensitivity 94.5% and specificity 95.9% for the model.
Karaolis et al. 10 proposed a Decision Tree (DT) model for heart diseases prediction, including MI. In the dataset 416 instances had experienced MI. The model achieved the accuracy 61% and sensitivity 75% for MI. Srinivas et al.11 used Naïve Bayes, DT, Multi-Layer Perceptron and Rule based algorithm, for heart disease prediction. They the algorithms are applied on a UCI dataset, which includes the data of the patients with heart disease. The best results are achieved by Naïve Bayes (NB) with accuracy 84.14%. Moreover, in another study, Srinivas et al. 12 applied C4.5 decision tree, Neuro-Fuzzy, Bayesian Network, Support Vector Machine (SVM) and time series for predicting MI. Masethe and masethe 13 used J48 DT, Bayesian Network, NB, Classification and Regression Tree (CART) and REPTREE algorithms as MI prediction models. The dataset included 90 instances with MI against 18 other cases haven’t had MI. Finally, the best accuracy, 99.07%, is achieved for J48, Naïve Bayes and CART.
Bhaskar 14 proposed a model for MI prediction based on ECG classification. They used Support Vector Machine (SVM) and MLP algorithms. MLP achieved the accuracy 90.17% and SVM obtained accuracy 82.14%. Sharma et al. 15, used K Nearest Neighbors and Lin-SVM and RBF-SVM as MI prediction models. The PTB dataset is used in their study which includes 290 cases, totally, and 148 cases were MI cases. SVM-RBF obtained the best accuracy 96%, sensitivity 93% and specificity 99%.
2. Problem Definition
The motivation of this study is mentioned below:
- (1)
Symptoms that can lead to MI are misleading and might be considered as signs of other diseases. Electrocardiography (ECG) is a common and proper method for detecting MI, but this method have some limitations. It might that a person with normal ECG experience MI. Also, the changes of ST segment could be considered as Acute Pericarditis; or changing in T wave segment could be considered as High potassium 3. Thus, it seems necessary to present a method for MI prediction in hospital to help the personnel. On the other side, if MI occurs, the treatment methods after MI could have side-effects. One of the treatment methods is Thrombolysis, in which the Anticoagulant or Antiplatelet drugs is used for opening the blocked arteries. This method has long-time effectiveness and in this period of time, much more parts of the heart is damaged 1, 16, 17. The other treatment method is Percutaneous Coronary Intervention (PCI) in which a catheter is inserted in Femoral artery in patient’s leg, and forwarded to the blocked site in the artery. PCI is an expensive method and is considered as a semi-invasive method. Moreover, treatment using this method is accompanied with severe pain. Another treatment method is Coronary Artery Bypass Surgery (CABG) which is define as creating new routes around narrowed or blocked arteries by grafting a healthy artery from another part of the body over a surgery. This highly expensive method can lead to cerebrovascular. Also, if surgery is performed by a non-experienced doctor, it can lead to death 3, 5. It is obvious that occurring MI and treatment method has side-effects. Thus, it is necessary to use prediction methods before MI. Thus, prediction methods in data mining are considered beneficial solutions;
- (2)
After reviewing the literature, it is concluded that although the traditional classification models obtained high accuracy, they have been used for the datasets in which, the number of diseases instances with disease is and the number of healthy instances is equal or ever healthy instances are more in some studies. Moreover, it is obvious that, the results tend to the class with more cases, and the larger class is affected the results. So, if the dataset is considered imbalanced, the traditional classification methods’ results could not be considered reliable. Thus, the effect of the smaller class on the model performance is very low. Generally, an imbalanced problem is defined as a problem in which the ratio of smaller class to prevailing class is 1:100, 1:1000 or even larger. In some problems, the 1: 35 ratio of the smaller to prevailing class can be considered imbalanced 18.
The sensitivity of a MI prediction model to the costs and penalties is not regarded in the previous researches; but it need to be considered that falsely classifying a healthy case only may lead to laboratory angiography related financial costs or side-effects, while falsely classifying a MI instance could endure costs like missing the chance of timely therapies and in a worse condition, losing the life. Thus, it seems that using the methods that show the significance of the MI class is necessary.
This study includes two contribution: the first one is using Genetic Algorithm in combination of Weight by Relief. This Two-Step Feature Selection method selects the better features compared to the features selected by each method separately. The other contribution is originated from being imbalanced of healthcare problems. In this study, Cost Sensitive algorithms are applied. The traditional SMO algorithm in cost sensitive state is applied on imbalance dataset. It is expected to the model achieve the better performance compared to cost insensitive state. As far as we know, a cost sensitive SMO prediction model in combination with a Two-Step Feature Selection method is not proposed for MI prediction before. Aim of this study is determining how the cost sensitive SMO model which utilizes a Two-Step Feature Selection can be used for predicting Myocardial Infarction. Thus, in the proposed model, first a pre-processing process is applied on the dataset, next a weighting operator namely “Weight by Relief” specifies the weights of the features. After selecting the top best features, Genetic algorithm selects the final ones. Then, the SMO Metacost classifier is applied to the dataset. The superiority of this model is considering the costs for misclassification that can result trustworthy outcomes than previous works.
3. Materials
3.1. Pre-processing Process
Due to the noisy and incomplete of the data in real world, using the pre-processing method for turning data to proper entries for data mining seems necessary 8. The most important effect of this stage is enhancing the quality of the data and so leading to the better performance of the model 19. So, this stage is very important, such that this stage allocates the 60%–90% of the project times, in practice 20.
In this study 3 pre-processing method is used: cleaning, transformation and reduction of the data.
- •
Data Cleaning: Data cleaning methods handling the noisy, Outliers or incomplete data. In this study the missing values in data are replaced with the average of the available similar feature values. Using this method for replacing the missing values is due to the similarity of the symptoms of the diseases in health field.
- •
Normalization: After data cleaning, data should be normalized. It means the data turn to the proper data for getting the better results 19. In normalization all the values off a feature turn to the intervals with small values; because the bigger values of a feature makes bigger weight for the feature and this makes a bias in results to the bigger weights. Normalization attempts to give the features an equal weights. In this study we have used Min-max normalization; because this method keeps the relations among the base and original data. Moreover, it is a simple and popular method and can fit the values in a predefined range like [0, 1]. Suppose that A be a feature with n values, a1, a2, …, an, MaxA and MinA be the maximum and minimum of A, respectively. The Min-max method maps the value ai of feature A to a’i in range [newMinA, newMaxA]8, using the Eq. (1):
In this study, the data are mapped to the range [0, 1]. - •
Feature Selection: This step is considered as the most common method for decreasing the data dimensions. This method using eliminating the irrelevant features enhances the efficiency of the outcomes 21. Applying Evolutionary Algorithms in feature selection process, leads to better accuracy of the classification algorithm 22, 23. Moreover, the researchers have shown that compared to sole methods, Two-Step Feature Selections could lead to better results 24, 25.
Weight by Relief evaluate the quality of features and assesses the power in recognition of the instances with the same class and different classes that are adjacent. This operator specifies the relevance between features by measuring the relevance between them and comparing the values of a specific feature for the nearest example in the same class and in the different class 26. The second part of the proposed feature selection method is giving the selected features in the first part to Genetic Algorithm, as the entries of the algorithm. Genetic algorithm (GA) attempts to achieve the optimized solutions a problem 27. The process of this algorithm is iterative which means selecting the best features using assessing the initial population. A fitness function is used for selection of the features. Thereafter, a same size population is produced using two function crossover and mutation 28.
3.2. Sequential minimal optimization
Sequential minimal optimization (SMO) is the most common learning algorithm of Support Vector Machine (SVM), which is due to its high learning speed 29. SMO reduces responding time of the algorithm by breaking the problem into sub-sectors and then gaining the weights for each sub-sector. Given that needed memory for this algorithm is linear, it can lead to proper results for large datasets 30, 31.
3.3. Cost Sensitive Algorithms
In some data mining projects with imbalanced data nature, the misclassification cost for instances of a class could be very high. Cost sensitive algorithms are a solution for imbalanced problems. The traditional classification algorithms aim to minimize the misclassification error. In this situation, the cost of mislabeling of a positive case as negative and a negative case as positive is considered equal; but in reality, the misclassification cost of a disease case as healthy is really higher than the reverse condition. In fact, it could lead to financial costs or even losing the life 32.
Cost sensitive algorithms are types of classification, in which misclassification costs are important. The main goal of this classification is minimizing the total cost of misclassification using increasing penalties. This way the misclassification cost of a disease case as healthy and a healthy case as disease has difference 33, 34.
If the negative and positive class is shown with “0” and “1”, respectively, C(0, 1) shows the misclassification cost of a positive case as negative and C(1, 0) shows the misclassification cost of a negative case as positive.
C(0, 0) and C(1, 1) show the true classification of negative and positive cases, respectively 35.
One of the methods that make cost sensitive algorithms is proposing the methods for turning the traditional and cost insensitive classifiers to cost sensitive ones. Metacost is a method that makes the common algorithms to cost sensitive, which aims to turn the traditional error decreasing based algorithms to cost sensitive classifiers using allocating costs 36, 37.
In this method a cost insensitive algorithm is merged with a process, in which different costs are allocated to its different predication, and this way it is turned to a cost sensitive classifier, in which more cost is allocated to C(0, 1) compared to C(1, 0) 38.
The main idea of Metacost could be describe as below:
Let Y be a case and P (R|Y) be the probability that X belongs to R. On the other side, if C (R, S) is the cost of falsely classifying the instance of class S as R. then the expected cost for classifying Y in R could be considered as O(R|Y)33, 34, that is calculated through Eq. (2):
3.4. Myocardial Infarction Dataset
Our MI dataset is obtained from the information of people referred to Shahid Madani heart Specialized Hospital of Khorram Abad, Iran, in second half of 2015.
Based on the Ref. 39, rate of MI occurring 14 per 1000 individuals, in Iran. Thus, for implementing the model based on the statistics, we need to gather enough amount of an initial population to take the 1.4% of it 39. More over for testing the model we need to have enough cases of both MI and healthy. First, we collected 750 cases, randomly. As will mention in section 4.3., the data is divided to two sub sets: 90% of data is considered as training set and 10% is considered as testing set. The training data set includes 410 healthy and 165 MI cases, which does not seem imbalanced. The testing data set includes 45 healthy and 30 MI cases. All divisions have been done automatically by Rapidminer.
It is obvious that the training dataset is not imbalanced, thus it should turn to. Then, 1.4% of whole the 675 data in training set, which is 9 cases, is calculated. So, 9 numbers of MI cases in training set is taken and makes a new imbalanced dataset along with the 410 healthy cases. For separating 9 MI cases, we applied a “sample” operator in Rapidminer in which MI cases are sampled at a ratio 0.014 and 1 for healthy cases.
Dataset includes 93 features: Age, Body Mass Index (BMI), Sex, Hypertension (HTN), Diabetes Mellitus (DM), Smoking, Family History (FH), Obesity, Chronic Renal Failure (CRF), Cerebrovascular Accident (CVA), Airway disease, Thyroid, Hyperlipidemia (HLP), Troponin I, White Blood Cells (WBC), C-reactive protein (CRP), Total Cholesterol, Congestive Heart Failure (CHF), Fasting Blood Sugar (FBS), Lactate dehydrogenase (LDH), Creatine phosphokinase (CPK), Creatinine (Cr), Triglyceride (TG), Low-density Lipoprotein (LDL), High-density Lipoprotein (HDL), Blood Urea Nitrogen (BUN), Erythrocyte Sedimentation Rate (ESR), Ferritin, Hemoglobin (Hb), Sodium (Na), Lymphocyte (Lymph), Platelet (PLT), Ejection Fraction (EF), Potassium (K), Heart burn, Systolic Blood Pressure (SBP), Diastolic Blood Pressure (DBP), Pulse rate, Edema, Fatigue and weakness, Lung rales, Typical Chest Pain, Distribution of pain to arms and neck, Dyspnea, Atypical Chest Pain, Non-anginal Chest Pain, Exertional Chest Pain, Left Anterior Descending Artery (LAD), Left Coronary Artery (LCA), Right Coronary Artery (RCA), ST Depression leads (I, II, III, avR, avL, avF, V1, V2, V3, V4, V5, V6), ST Elevation leads (I, II, III, avR, avL, avF, V1, V2, V3, V4, V5, V6), T inversion leads (I, II, III, avR, avL, avF, V1, V2, V3, V4, V5, V6) and Poor R Progression leads (V1, V2, V3, V4, V5, V6). It is worth mentioning that for ECG features each lead of features is considered as a separate feature. The last feature is the label which specifies the class.
4. Proposed Cost Sensitive MI Prediction Model
Our proposed MI prediction model employs a Two-Step Feature Selection method include the operator weight by relief and GA, after pre-processing. Then, in classification step, Metacost is employed for making a cost sensitive SMO. Fig. 1 shows the diagram of our proposed model.
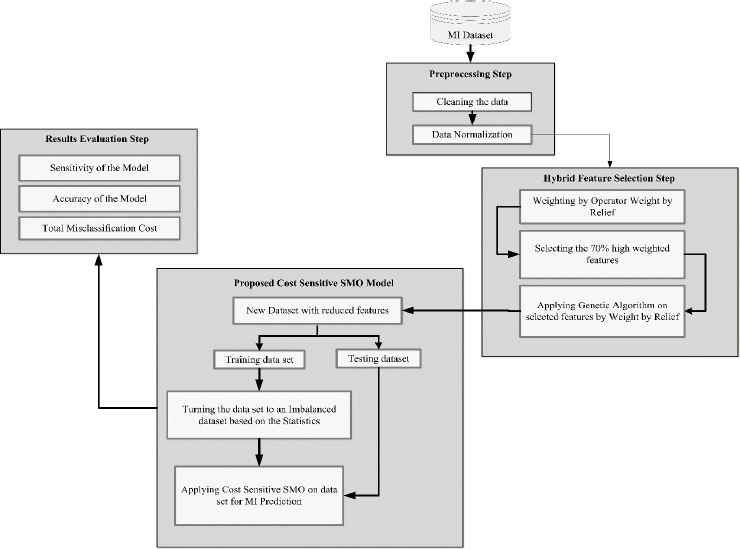
Diagram of the Proposed MI Prediction Model
4.1. Step 1: Pre-processing
This step includes cleaning the data and normalization. In this step, Rapidminer assesses the dataset and the missing data are subbed with the average of the similar available similar feature values.
After cleaning the data, the feather would be normalized. First, the categorical features turn to numerical. Feature “sex” the values “female” and “male” are shown with “0” and “1”, respectively. The “positive” and “negative” values are shown with “1” and “0”, respectively, for Troponin I and CRP. For the other categorical features, if the feature is observed or not, it is shown with “1” and “0”, respectively. Then for normalizing the numerical features Min-max method, described in section 3.1, is applied and maps all the values in the interval [0, 1].
4.2. Step 2: Two-Step Feature Selection
Although feature selection is considered as a pre-processing method, due to its importance in this study, it is described as a separate step. In this phase, first the clean and normalized data are given to Weight by Relief, which is a weighting method. For this operator the “Top p%” option is considered to select the top p% of features. We have considered this option to “top 70%” or p=70% in Rapidminer. It means after weighting the features using the Weight by Relief, the operator select 70% features with higher weight. In the next step, the dataset with selected features using Weight by Relief, are given to GA. GA selects the final features. The parameter setting for this algorithm is shown in Table 1.
| Crossover probability | 0.00271 |
| Crossover type | one-point |
| Selection | Tournament |
| Mutation probability | 0.6 |
| Maximum generations | 100 |
| Size of Population | 100 |
Parameters of Genetic Algorithm
4.3. Step 3: Proposed Cost Sensitive SMO Model
After feature selection, the third step of proposed MI prediction model is using cost sensitive SMO method. In this stage, first the dataset is divided into 90% training data and 10% testing data. Then cost sensitive SMO is applied on the dataset for classification. For turning SMO to a cost sensitive algorithm, Metacost is used. SMO algorithm is used in default settings for it in Rapidminer. Since the different costs for models affects the results of them 40, and due to being less importance of C(1, 0) and more importance of C(0, 1), the cost of misclassifying the negative cases as positive is set to 1. For the cost of misclassifying of positive cases as negative different costs are set to show the effect of different costs on performance. If C(0, 1) and C(1, 0) is considered as the cost of False Negative (FN) and False Positive (FP) respectively, we show the cost ratio for different cost of C(0, 1) against C(1, 0) with FN:FP. It means the costs could be shown as 10:1, 50:1, 100:1, 150:1 and 200:1.
4.4. Step 4: Results Evaluation
After making classification model, it is necessary to assess the performance. A common numerical measures is “Accuracy”, which means the percentage of samples correctly classified by the classifier and is calculated as below (Eq. 3):
When the dataset is imbalance and the smaller class has more importance, accuracy could not be considered appropriate. In fact for imbalanced problem the measure sensitivity is more useful 8.
Sensitivity shows the ratio of correctly classified positive cases. Due to the definition of sensitivity 8, this measure is considered as a well-known and common in health field to specify the ratio of correctly diagnosed of disease cases 41. Sensitivity is calculated using Eq. (3) as:
Given that the cost sensitive algorithms, the main goal of these algorithms is minimizing total misclassification cost. Therefore, in addition to sensitivity, this measure is considered as an important measure which means the total cost of misclassifying the cases multiplied error cost, as shown below 41 (Eq. 5):
5. The Experimental Results
5.1. Performance Evaluation
For implementing proposed MI prediction model, Rapidminer (v. 7.1) is used. After pre-processing step the data have turned to clean and normalized data. Then, in second step the proposed Two-Step Feature Selection is applied on the data. At first part of feature selection step the data are given to operator Weight by Relief”.
Thus, the features have been weighted and sorted based on their weighs, descending. As mentioned in section 4.2, top 70% of features with higher weights have been selected. Given that 70% of 92 features is equal 64, therefore the model is selected 64 features with higher weight, in the first part of feature selection, as shown in Table 2.
| Rank | Features | Weight | Rank | Features | Weight |
|---|---|---|---|---|---|
| 1 | Troponin I | 1 | 33 | ST Depression V1 | 0.0935 |
| 2 | ST Elevation I | 0.4579 | 34 | LDL | 0.0858 |
| 3 | Distribution to arms and neck | 0.4565 | 35 | TG | 0.0822 |
| 4 | ST Elevation avL | 0.4519 | 36 | Fatigue and weakness | 0.0803 |
| 5 | LCX | 0.4296 | 37 | Smoker | 0.0757 |
| 6 | Typical Chest Pain | 0.3569 | 38 | Atypical Chest Pain | 0.0749 |
| 7 | RCA | 0.3588 | 39 | Ferritin | 0.0741 |
| 8 | LAD | 0.3455 | 40 | ST Depression V3 | 0.0741 |
| 9 | ST Elevation III | 0.2933 | 41 | HDL | 0.0773 |
| 10 | ST Elevation II | 0.2909 | 42 | LDH | 0.0729 |
| 11 | ST Elevation avF | 0.2909 | 43 | Poor R Progression V4 | 0.0706 |
| 12 | T inversion V3 | 0.2723 | 44 | Age | 0.684 |
| 13 | T inversion III | 0.2693 | 45 | Lung rales | 0.0679 |
| 14 | T inversion V2 | 0.2669 | 46 | CRP | 0.0665 |
| 15 | T inversion avF | 0.2607 | 47 | BUN | 0.0642 |
| 16 | T inversion V6 | 0.2491 | 48 | Total cholesterol | 0.0642 |
| 17 | T inversion V5 | 0.2427 | 49 | HTN | 0.0633 |
| 18 | T inversion V1 | 0.2284 | 50 | ST Depression V2 | 0.0630 |
| 19 | T inversion II | 0.2246 | 51 | Exertional Chest Pain | 0.0628 |
| 20 | ST Elevation V2 | 0.2176 | 52 | Poor R Progression V2 | 0.0587 |
| 21 | T inversion V4 | 0.2144 | 53 | SBP | 0.0585 |
| 22 | ST Elevation V3 | 0.2125 | 54 | ST Depression avR | 0.0574 |
| 23 | ST Elevation V1 | 0.2114 | 55 | ST Depression V4 | 0.0547 |
| 24 | DM | 0.1796 | 56 | Poor R Progression V3 | 0.0506 |
| 25 | Sex | 0.1691 | 57 | HLP | 0.0496 |
| 26 | T inversion I | 0.1664 | 58 | Non-anginal Chest Pain | 0.0458 |
| 27 | EF | 0.1422 | 59 | ST Depression III | 0.0450 |
| 28 | ST Elevation V4 | 0.1422 | 60 | CPK | 0.0441 |
| 29 | FH | 0.1387 | 61 | Heartburn | 0.0431 |
| 30 | T inversion avL | 0.1314 | 62 | FBS | 0.0403 |
| 31 | Lymph | 0.1071 | 63 | DBP | 0.0395 |
| 32 | Dyspnea | 0.0967 | 64 | ST Depression avF | 0.0337 |
Selected features using Weight by Relief
At the second part, Genetic Algorithm, with the setting mentioned in section 4.2, is applied on the dataset with 64 features selected in earlier part. This algorithm, then, is selected 62 features of 64 features selected before. Two removed features by GA are Triglyceride and avF lead of ST elevation segment.
After feature selection, the proposed cost sensitive MI prediction model with different cost ratios, 10:1, 50:1, 100:1, 150:1 and 200:1, is applied on the new training dataset with 410 healthy and 9 MI cases, which have 62 regular features and 1 goal feature. Afterward, the model is tested on 75 testing dataset which includes 45 healthy and 30 MI cases.
Tables 3 and 4 shows the results of cost sensitive SMO model implementation compared to the traditional cost insensitive SMO. All the results is also compared in terms of using or not using the Two-Step Feature Selection.
| Not using Feature selection | Using Feature selection | ||
|---|---|---|---|
| Sensitivity | Accuracy | Sensitivity | Accuracy |
| 9.68% | 62.67% | 30% | 72% |
The traditional cost insensitive SMO results on the data set with and without feature selection
| Not using Feature selection | Using Feature selection | |||||
|---|---|---|---|---|---|---|
| Cost Ratio (FN:FP) | Sensitivity | Accuracy | Total Misclassification Cost | Sensitivity | Accuracy | Total Misclassification Cost |
| 10:1 | 16.13% | 65.33% | 260 | 33.33% | 73.33% | 210 |
| 50:1 | 25.81% | 68% | 1151 | 43.33% | 77.33% | 863 |
| 100:1 | 25.81% | 68% | 2301 | 43.33% | 77.33% | 1713 |
| 150:1 | 25.81% | 68% | 3451 | 43.33% | 77.33% | 2563 |
| 200:1 | 25.81% | 68% | 4601 | 43.33% | 77.33% | 3413 |
The results of Proposed cost sensitive SMO on the data set with and without feature selection
5.2. A Discussion on Results
The goal of this research is achieving to a prediction model for imbalanced problems that have proper performance. The main measures for assessing the performance in this study is considered Sensitivity and Total misclassification cost along with Accuracy as the most and important measure in data mining world. As specified in figures 2, 3 and 4, it is obvious that the proposed Two-Step Feature Selection is improved the measures Sensitivity and Accuracy. In case of cost insensitive SMO, using the Two-Step Feature Selection have led to about 21% and 10% improvement in Sensitivity and Accuracy, respectively. In case of cost sensitive model, using the feature selection method on is enhanced Sensitivity about 18% in different cost ratios. Moreover, the measure Accuracy is improved such that using the feature selection method about 9% improvement for cost ratio 10:1 and about 10% for the other cost ratios.
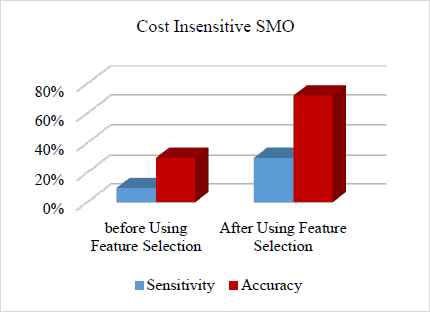
The results of SMO on the dataset before and after feature selection

Comparison of Sensitivity of Proposed model on the dataset for different cost ratios before and after feature selection
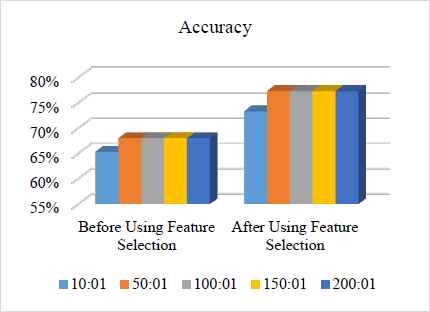
Comparison of Accuracy of Proposed MI prediction model on the dataset for different cost ratios before and after feature selection
On the other side, it is worth mentioning that the Total misclassification cost measure is just used for cost sensitive model and doesn’t have any application for cost insensitive model. Thus, in terms of Total misclassification cost, Fig. 5 shows that the feature selection has positive effect on this measure in cost sensitive cases. The positive effect for this measure means decreasing the results of this measure. It is clear from Fig. 5 that all the resulted values have been reduced such that for cost ratio 10:1, using the feature selection have caused 50 reduction. For cost ratios 50:1, 100:1, 150:1 and 200:1 the reduction values are equal 288, 588, 888 and 1188, respectively. Thus, reviewing the results can show the positive effect of using the proposed feature selection method on both cost sensitive and cost insensitive SMO for predicting MI.

Comparison of Total misclassification cost of Proposed MI prediction model on the dataset for different cost ratios before and after feature selection
On the other hand, it could be concluded that being cost sensitive SMO has a significant and noticeable effect on the results. In case of not using feature selection, the cost sensitive prediction model have improved Sensitivity and Accuracy at least 7% and 3%, respectively, which is obtained for cost ratio 10:1. For the other cost ratios in not using feature selection is about 17% and 6% for Sensitivity and Accuracy, respectively. In case of using feature selection, the proposed cost sensitive SMO model is caused improvement in Sensitivity and Accuracy about 4% and 6%, respectively.
Based on the main goal in this study, so we need to select the best model for MI prediction with high Sensitivity and Accuracy along with low misclassification cost. By reviewing the cost sensitive model with different cost ratios, the best model could be cost sensitive SMO with cost ratio 50:1 after feature selection; because although the models with cost ratio 50:1, 100:1, 150:1 and 200:1 have similar Sensitivity and Accuracy, and higher than the model with cost ratio 10:1, this model has the lower misclassification cost.
Thus, of results, it could be concluded that two proposed methods, include using the Two-Step Feature Selection and the cost sensitive SMO model, have enhanced the Sensitivity and Accuracy about 34% and 6%, compared to initial cost insensitive SMO model without using feature selection. Another point that can be found of the results is that considering the higher misclassification costs does not necessarily improve the performance of the model. After all, the reviews could be summarized as the cost insensitive models cannot be considered as proper MI prediction methods in confronting with imbalanced datasets, while the appropriate sensitivity of the present cost sensitive model indicates that it could satisfy the main high performance of the model.
Despite the positive results of this model, the limitation of the research is that the model just represents a theoretical data mining method predicting MI; but it is obvious that this model could be employed in the form of a software or a programmed system that consists of a smart ECG reading part, using OCR or connection to Electrocardiogram, and also a part connected to laboratory for receiving the lab results immediately. This way after constructing the software or system, which is integrated in whole hospital through an infrastructure, the proposed model in this research could be implemented and predict MI with high speed and proper Sensitivity, so that leads to preventing of MI occurring. But now, due to the high cost, the need for infrastructure and the need to obtain required licenses, implementing the model was not possible. We hope it could be possible in the near future.
6. Conclusion and Future Works
This research is applied a cost sensitive SMO for MI prediction. Moreover, this model uses a Two-Step Feature Selection.
After pre-processing and making the proper data for using in a data mining project, the operator “Weight by Relief” as the first steps is weighting and then selecting the features based on their weights. Afterward, Genetic Algorithm is used as second step of feature selection for selecting the best final features, which was equal 62. The data set is not imbalance at first, that after dividing it to training and testing dataset, the training data set is turned to an imbalanced data set with 9 MI cases. In the next step, the proposed Cost sensitive SMO model, in which the traditional SMO algorithm is changed to a cost sensitive algorithm using MetaCost, is applied on the imbalanced training dataset. In this stage, we have considered some different costs for misclassifying the MI cases as healthy, as penalties for the model. For misclassifying healthy cases as MI, we did not considered any penalties. The ratios of misclassification cost of MI as heathy to healthy as MI were 10:1, 50:1, 100:1, 150:1 and 200:1. Due to we could not find any real cost for MI from researches, hospitals or health organizations, thus we considered some costs from
The traditional models are implemented on balance datasets, in which the healthy cases and diseases cases are almost equal or even disease cases are more in some researches. These models could achieve to really good results and considers as reliable models that have high accuracy or sensitivity; but if the models are implemented on the datasets, that have considered real statistics in terms on occurrence of the diseases, they results are disappointing. Traditional cost insensitive algorithms, in confronting with imbalanced dataset, achieves very low sensitivity, which is really an important measure in health data mining. The proposed model in present study is achieved the proper sensitivity. It means that the proper power in predicting MI cases against the simple SMO and not using the proposed feature selection, which have predicted only 10% of the MI cases, truly.
The Two-Step Feature Selection proposed in this study, also, has positive effect on results as could be seen that the notable differences between the results of main measures, Sensitivity and Total Misclassification Cost”, before and after using the method.
Given that, higher Sensitivity means the model has more tendency to prediction of the disease cases42, thus, the proper Sensitivity and low Misclassification cost of the final model in this study is shown the enhancement tendency of the predicting MI cases more than before.
In future, we are going to consider the misclassification cost for falsely classifying the healthy cases as MI; because these misclassifications also have costs for the person.
Moreover, we intend to extend the model by the other algorithms for classification and future selection steps as well as with considering the much higher and much lower costs as penalties for misclassification of the model.
Acknowledgement
We would like to acknowledge the personnel of the Hospital for kindly assisting us in data collecting step. We thank Mr. R. AlizadehSani for his help without expectation and constructive guidance and suggestions that lead to improvement of the manuscript, and Dr. M. Koushki for facilitating the medical problems
References
Cite this article
TY  - JOUR
AU  - Hodjat Hamidi
AU  - Atefeh Daraei
PY  - 2018
DA  - 2018/01/01
TI  - A Novel Two-step Feature Selection based Cost Sensitive Myocardial Infarction Prediction Model
JO  - International Journal of Computational Intelligence Systems
SP  - 861
EP  - 872
VL  - 11
IS  - 1
SN  - 1875-6883
UR  - https://doi.org/10.2991/ijcis.11.1.65
DO  - 10.2991/ijcis.11.1.65
ID  - Hamidi2018
ER  -