
A New Approach for Condition Monitoring and Detection of Rail Components and Rail Track in Railway*
- DOI
- 10.2991/ijcis.11.1.63How to use a DOI?
- Keywords
- Railway Component Detection; Rail Tract Direction Detection; Image Processing; Condition Monitoring; Decision Trees
- Abstract
Computer vision-based tracking and fault detection methods are increasingly growing method for use on railway systems. These methods make detection of components of the railways and fault detection and condition monitoring process can be performed using data obtained by means of computers. In this study, methods are proposed for fault detection on railway components and condition monitoring. With cameras placed on the bottom and the top of the experimental vehicle the images are taken. The camera at the top, overhead rails are positioned to see a way for war and the camera is fixed to the bottom mounted to see clearly railway components. Images from cameras placed on the bottom, Canny edge extraction and Hough transform methods are applied. The types of the components and faults are determined by using classification algorithm with decision trees using the obtained data. The condition monitoring has done by the camera is positioned on the upper part of the vehicle. By processing the taken images with processing methods, inclination angle of the rails and direction of railways are detected. Thus, during the course of the vehicle is obtained information of the direction of railway. Real images are used in the operation of railways belonging to the experimental environment. On these images, to identify the components of the proposed method using the railways and rail direction determination is made. The results obtained are given at the end of the study. The experimental results are analyzed, it is observed that the proposed method accurate and effective results.
- Copyright
- © 2018, the Authors. Published by Atlantis Press.
- Open Access
- This is an open access article under the CC BY-NC license (http://creativecommons.org/licences/by-nc/4.0/).
1. Introduction
Railway transport is an important transport mode used for long years. It is preferred more compared to other modes due to its costs and safety. Also, railway transport has gained an increasingly significant role in passenger and freight transport in parallel to developing technology. The safety and maintenance works of railways which are increasingly preferred are similarly important. Particularly, monitoring of rail condition and healthy service of rail components affects the safety of rails directly. In traditional methods, these operations are generally performed by manpower. However, these methods have some disadvantages in terms of costs and healthy results1. The recent technological developments enable to create new methods in this field, as well. The decreasing costs of computer and electronic hardware as well as developing software techniques enable the works in these fields to produce efficient results.
There are a great number of studies in the field of computer vision-based monitoring of railways2–4. Some of these studies are dedicated to detection of rail components such as fastening plate, anchor etc. In one of these studies, Singh et al. suggests an automatic control method that detects the faults in clips which fasten the rail fastening plates5. In this method, one light source and one camera are fixed under train. After the clips are obtained using Canny edge extraction algorithm, it is detected whether they are smooth or old or broken with the help of colour tones of clips. This is a disadvantage because the study is color based. The rail affects the success of working in areas of rust or color changes. In another study, Khan et al. suggest a machine vision-based method for detection of fasteners and anchors6. It is intended to detect E-type anchors in this study and the faults are found using Shi-Thomasi and Harris-Stephens feature extraction methods. This method is tested over 100 images and the success rates obtained are specified in the part of results. A block diagram about this study is given in Figure 1. In the Khan et al6 study, only the railway component was detected. Condition monitoring and fault detection has not done in this study. He also worked on a single track rail on the railway using only one camera. Trinh et al. tries to identify the nonconformity problems and failures on rail fasteners in another study7. Sobel edge extraction method is applied on the images captured by a camera. Hough transform method is used for the operation of object detection. In order to define nonconformity problem, the data obtained is crossed via cross-frame and cross-view methods and hence compared. Therefore, it is tried to identify the nonconformity and failures of anchors. The proposed method works for a speed of 10 mph. It does not work for high speeds. In addition, only the component was detected in the studyRay detection surface or railway line is yet to follow.
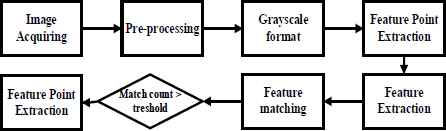
Block diagram of the method applied for detection of E-type anchor6.
In another study, Li et al. intend to detect fastenings, fastening plates and anchors on rails8. The video analyses and images obtained by the method using four cameras and distance measuring device are transmitted via GPS. The images have a resolution of 640×400 and 20 fps. The method has two basic objectives: to detect the damaged screws and the components non-conforming to the pattern structure. The speed of this study is 10 mph. Railway transportation is affected negatively when railway line is observed at this speed. A flow diagram regarding this study is given in Figure 2.
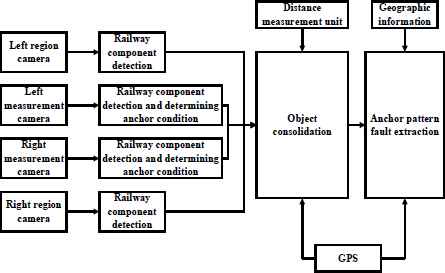
Developed method for railway component detection8.
Some of the computer vision-based studies are dedicated to monitoring of rails. These methods intend to monitor rail failures and conditions. In a study with this objective, Chen et al. tries to identify the rail fractures and cracks arising from pressure9. The study consists of the following basic operations: image accumulation, feature extraction, failure identification and failure detection. Similarity measurement is performed using mathematical methods, pattern recognition processes and fuzzy logic. The results are obtained by being tested on real images. In this study, only the rail surface is examined. Railway components are yet to identify. In another study, Bin et al. suggests a computer vision-based method for detection of splitting and bending failures10. The suggested method involves two basic units: Image Accumulation Subsystem (IAS) and Image Analysis Subsystem. IAS unit consists of one camera and 4 LED lights. The images obtained from this unit have a resolution of 1200×512. IAS unit is designed with the capability to perform three operations: enlargement of rail tracks, improvement of contrast and detection of failure zone. The results obtained from algorithms are tested using totally 600 images. Zheng et al. suggests a real-time method in order to find the rail measuring points in another study11. The operations are performed using a CCD camera and red laser lights. Object recognition and differential and adaptive threshold detection as well as morphological operations are performed at the image-processing stage. The design of this system and the flow diagram of the processes are given in Figure 3.
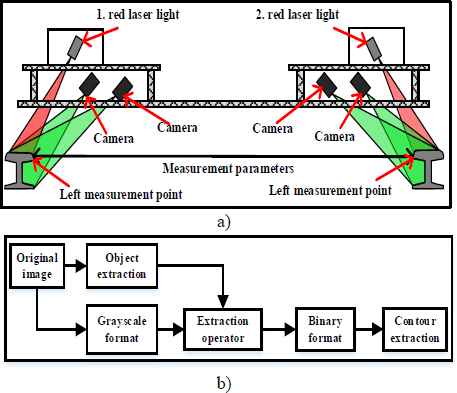
Experimental setup and flow diagram for developed method of fault detection on railway components11. a) System design. b) Process steps of method.
Sawadisaw presents a study aiming to detect the failures in another research12. In this study, the potential failures are defined using the accident data obtained from Federal Railways. For image accumulation, a camera with 30 fps is fixed at a height of 12 inches and an angle of 30 degree. Rail switch, anchors and screws as well as sample pattern data are prepared in laboratory environment for object recognition. Two different algorithms are suggested. The first algorithm intends to detect fastening components while the second one is for edge and content extraction. Following completion of the study, the results are given for different failure types.
Quingyong at al. detects the real-time failures on rail surface by developing an image processing-based contact-free method13. Rail surface is detected by part extraction from rail images. The surface failures are identified over the detected rail surfaces using the contrast enhancement method. This method enables just to detect rail surface and identify surface failures. Trinh et al. suggests an integration and optimization method with multiple sensors for railway inspections14. In the suggested method, distance measuring devices are used for railway object recognition using multiple cameras and hence a new global optimization method is developed. Using this method, such failures as part defects, alignments, surface failures and slanting are identified during rail inspection.
Ying et al. 15 suggests an approach for detection and evaluation of rail components for automatic monitoring of rail systems. The suggested method is applied on a train running at a speed of 16km/h. Sobel edge extraction algorithm and Hough transform algorithm are applied on the images obtained and hence rail components are detected. In the proposed method, only the rail component is detected. Rail surface detection and monitoring is not done. Also, the proposed method is slow and it is difficult to work in real time on the railway line.
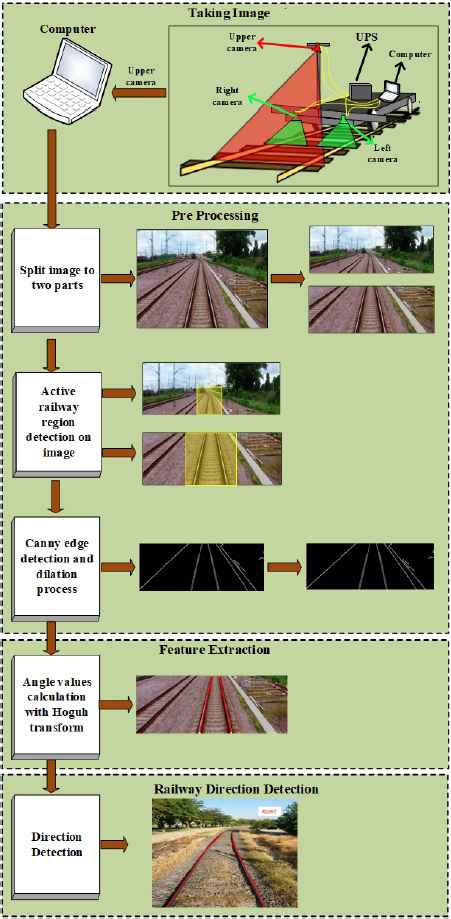
This study proposes a method for monitoring and fault detection of rail component has been proposed. Monitoring multiple components and detecting faults is critical for railway safety. In order to clearly show the proposed method, the general architecture is given in Figure 4.
The architecture of the proposed method
The architecture shown in Figure 4 shows three cameras fixed to the railway vehicle. With the images taken from these cameras, the rail component, rail surface and direction are detected. When studies done in the literature are examined, studies are usually made for a single component. In this study, condition monitoring and fault detection were performed for the three most important components of the railway. The monitoring of the three most critical components of the railway has brought innovation to the literature. The proposed method is implemented in real time on the railway line.
This study suggests a computer vision-based component detecting and condition-monitoring method. The cameras fixed on the upper-side and underside of a train is used for image accumulation. The camera fixed on the upper-side of the train is mounted in a way to see rails. Edge extraction, morphological operations and feature extraction methods are applied on the images obtained from this camera and hence the results regarding the turning direction of rails are gained. The camera fixed on the underside of train is mounted in a way to see rail components. Image-processing methods are applied on the images obtained from this camera and hence component detection is performed. Then, these components are distinguished by a classification algorithm. It is tried to detect condition of rails and rail components using both methods while a train is running. At the end of the study, tests are conducted using the real-medium images and the results obtained verify the validity of this study.
The biggest advantage of the proposed method of monitoring multiple components simultaneously, and is making fault detection. In the literature methods, only one component is usually studied. Condition monitoring is performed using image processing methods in the literature. In this study, decision trees, which is a machine learning method, are used except for image processing. A decision tree was constructed on the sample data and this tree structure was used outside the test process. Since the decision tree is created once, there is no need to create it for all images again. Thus, although the proposed method is machine learning based, it is fast. In the second part of the work, the concept of condition monitoring for railway lines and components is explained. The importance of monitoring the condition is emphasized. The proposed method and the algorithms used are given in section three. The flow diagrams and explanations of the equations used are explained in section three. In Chapter 4, the railway test vehicle and the proposed method are given on the actual railway line. The images obtained in practice, the results and the comparison with the literature are explained in this section. The results and outcomes are explained in the conclusion section.
2. Condition Monitoring for Railway Line and Components
Condition monitoring is a concept widely used in many fields. In industrial areas, processes such as condition monitoring, detection, diagnosis and quality control are carried out. Expert knowledge and workload were needed to be able to monitor the situation in times when technology was not developing. But in recent years there has been a revolution in the condition monitoring as well as the widespread adoption of computer vision. The condition is monitored by using cameras for all kinds of operations, especially in industrial areas. Thus, many processes such as product quality control, product counting and malfunction detection are performed more easily. Tracking and diagnosing the condition is important also in railways as it is in industrial areas. Condition monitoring methods in railways can be expressed as in Figure 5.
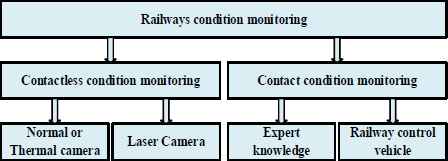
Condition monitoring methods in railways
As shown in Figure 5, there are generally contactless and contacted condition monitoring methods on railways. Contact condition monitoring is carried out with expert knowledge and railway control tools. It is a long process to train the experts and monitor the condition in these methods. Railway control vehicles monitor the condition by contacting the railway components. Transportation is interrupted while monitoring the condition in the railway by contact methods. In addition, the contact condition monitoring vehicle is damaging the railway components as it contacts the railway components. Contact-condition monitoring methods are an undesirable method in recent years. In recent years, contactless status monitoring methods have become widespread. Contactless condition monitoring methods are performed by computer vision using normal, thermal or laser cameras. Railway components are monitored using cameras fixed to railway vehicles. Thus, when contactless condition monitoring is carried out, transportation won’t be interrupted. In addition, condition monitoring is performed at low cost without the need for expert knowledge. Establishment of the railway line and its components is important for transportation safety. The railway line consists of many components. Rail, ballast, tie plate, sleepers are the most critical components of the railway line. Figure 6 shows the components forming an example railway line.
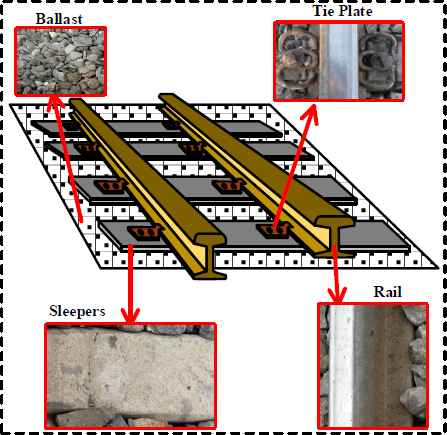
General components of the railway line
It is called rail to metal which enables the movement of the railway vehicles and transfers the weight of the vehicles to the sleepers. The rails are made of cast steel with superstructure material. It is called sleepers which carries the force coming from the rider, transfers it to the ballast layer, and keeps the path against the side effects. Sleepers are laid at regular intervals in the vertical direction. The components that connect rails and sleepers are called connection components. In addition, the connection components connect the rails together. The small stones between the cross members that transmit the weight to the platform conveyed by the sleepers are called ballast. In this study, contactless condition monitoring was performed for rail component detection. Railway components and railway lines are monitored using cameras, which are contactless condition monitoring methods. Thus, the failures that may occur in the railway line are detected early and the transportation safety is ensured.
3. Proposed Approach
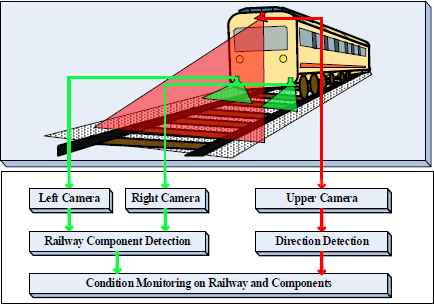
In this study, an image-processing method is proposed for detection of railway components and monitoring of rail line structure. Firstly, sleepers and rails which are the railway components are detected in the proposed study. The surfaces of rails detected are monitored and the rail surface failures are identified. Two cameras that monitor the railway line closely are used for this operation. Also, rail line condition is monitored through a camera fixed on locomotive. In the proposed method, the railway components and rail line condition are monitored using totally three cameras. The architecture of the proposed method is given in Figure 7.
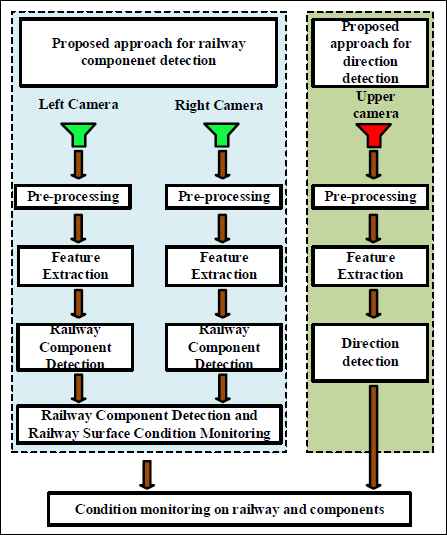
Architectural of proposed method.
As it can be seen from the architecture of the proposed method in Figure 7, totally three cameras are used. Two different methods are proposed for rail component detection and rail line monitoring. While rail component detection is performed using “Right Rail Camera” and “Left Rail Camera”, direction detection is realized on rail line using “Overhead Camera”. The results obtained by these two methods are combined and hence railway components are detected and rail line condition is monitored. The proposed method includes the steps of image processing-based pre-processing and feature extraction. In pre-processing step, colour transform, Canny edge extraction, filtering and morphological operations are applied. For feature extraction, such methods as Hough transform and decision tree are used.
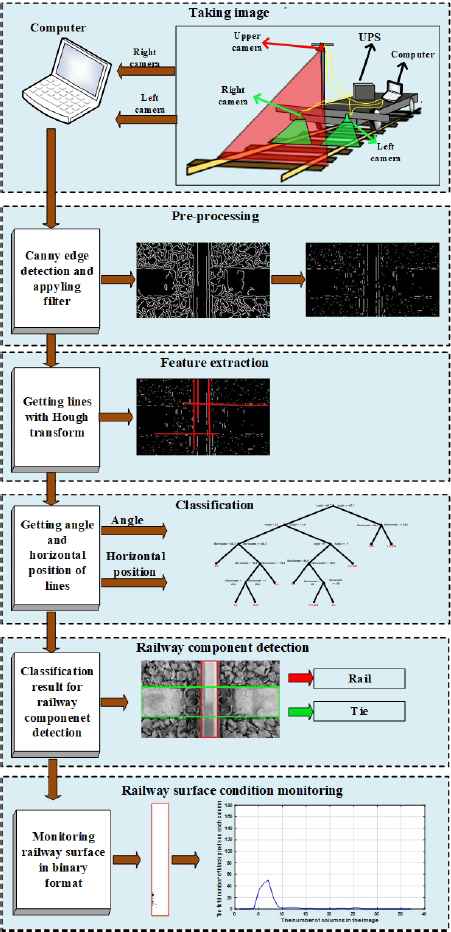
A. Rail Component Detection Stage: In this method proposed, an image processing-based method is developed for detection of rail components. Edge extraction is performed on the images obtained through the experimental structure used. The straight lines are detected over the images obtained and a data set is developed using the angle and values on horizontal axis for each straight line. A decision tree is created from the data set and it is used for classification of straight lines in the image. Following the classification, the rail component detection is performed. Many different methods are used for detection of rail components in literature16. The approach for detection of rail components in this study is given in Figure 8.
Proposed method for railway component detection.
As it can be seen in the approach for detection of rail components in Figure 8, Canny edge extraction algorithm is used for feature extraction. Following edge extraction, the straight lines are detected by Hough transform and the angles and positions of straight lines on horizontal axis are calculated. The features obtained are used along with the decision tree and hence rail components are detected.
Canny edge extraction method which is used at the step of feature extraction in this study is the most commonly used on among the edge extraction methods17. The edges contained in an image are defined as sudden change of pixel values in an edge zone. Edge extraction methods are highly important for feature extraction in image processing applications18,19. Canny edge extraction algorithm consists of multiple stages and achieves better results compared to other edge extraction algorithms20. The general flow diagram of Canny edge extraction algorithm is given in Figure 9.
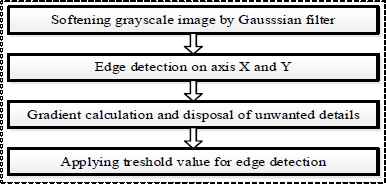
Flow diagram of Canny edge detection17.
The flow diagram of Canny edge extraction algorithm in Figure 9 consists of four basic steps. At the step of softening Grey image via Gaussian filtering, the image is firstly transformed into grey format. Equation 1 shows transformation of colour image matrices into grey format-image matrices.
Equation 1, f (i, j) means grey-level image matrix; R(i, j) means red image matrix; G(i, j) means green image matrix and B(i, j) means blue image matrix. The most important reason for converting a color image to a gray image is to reduce the size. There are three matrices in the color image and a matrix in the gray image. Thus, operations are performed faster.Gaussian filter is applied to grey-format image obtained and hence image softening is performed. 5×5 gaussian mask is used in Gaussian filter. Gaussian mask is given in Equation 2.
Image softening is performed using Gaussian filter. The Canny method is the best algorithm for edge detection. One of the first steps of the Canny edge detection method is to soften the image. A Gaussian filter is used to soften the image. When the literature is examined, it can be seen that the Gaussian mask may have different dimensions. In the Canny edge extraction method, the size of the Gaussian mask is 5×5. For this reason, a 5×5 Gaussian mask is used in this study. Following this operation, edge extraction of the image on X and Y direction is realized. At this stage, edge extraction is performed on X and Y direction using Sobel matrix.
Sobel matrices, Sx and Sy used at this step is given in Equation 3.
The use of Sx and Sy matrices is to obtain regions with sudden color changes on the softened image. The Sx mask has edge detection on the X axis and the Sy mask has edge detection on the Y axis. The gradient magnitude is calculated to transform the two matrices resulting from these two masks into a single matrix. By Gradient size calculated, images are created according to specific angle constraints. Gradient size calculated for each pixel is given in Equation 4.
After calculating the gradient size for each pixel in equation 4, the edge detection matrix is obtained. This results in many unnecessary edge pixels. The angle value of each pixel is calculated as in equation 5 to eliminate unwanted edges.
In this study, equations 1 to 5 are applied in order for a sample image, and the results are given in Figure 10.
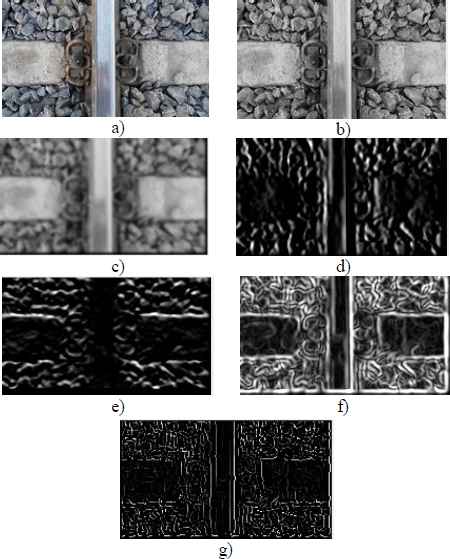
Applying steps 1 to 5 in the example image a) Original image b) Gray image (equation 1 result) c) Gaussian image (equation 2 result) d) edge detection in the X direction (equation 3 result) e) edge detection in Y direction (equation 3 result) f) Edge detection in XY direction (equation 4 result) g) Edge detection result according to special aperture (equation 5 result)
After edge extraction, Hough transform is used in order to obtain the straight lines contained in the image. Hough transform is generally used together with the edge extraction methods to detect the geometrical models on images20. Hough transform is applied on the images whose edge data is obtained21. The method transfers the data in image space to the parameter space and transforms the shape detection problem into density detection one. Hough transform does not require the points on the image to be juxtaposed or connected in order to detect the shape. Pseudo code of Hough transform used in the proposed method is given in Table 1.
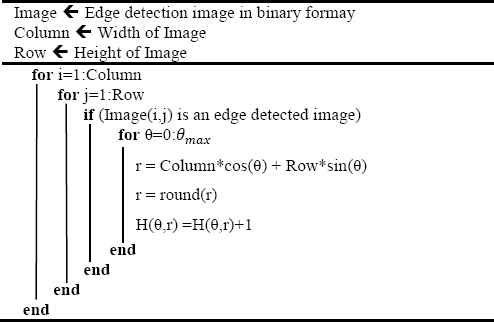
Pseudo code for Hough transform20.
A binary image obtained by edge extraction is firstly used in the pseudo code of Hough transform given in Table 1. The straight lines are expressed as in Equation 6.
There are two parameters in this equation to determine any straight line. These parameters are gradient (m ) and junction point (n). The straight lines are indicated as a point (m, n) in parameter space. The straight lines are transformed into coordinate system and indicated in Equation 7.
In this equation, it is indicated with the closest vector pair (r , θ) from the origin. In the proposed method for detection of rail components, the straight lines contained in the image are detected using Hough transform. Feature extraction is performed over the straight lines detected and then the angle and position values on horizontal axis are calculated for each straight line. The angle and position values calculated are transferred to the decision tree. Decision trees are commonly used in classification operations15–17. The structure of decision tree developed for the proposed method for detection of rail components is given in Figure 11.
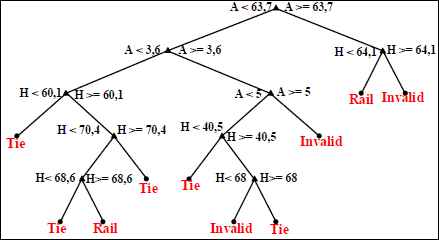
Decision tree structure (A: Angle, H: Horizontal position).
Absolute value of angle is used because whether the angle values of the straight lines are positive or negative does not change the result. Also, the midpoint of straight line on the horizontal axis is used to calculate its position on the horizontal axis. The position of line is normalised between 0 and 100 to be used for different image dimensions.
The decision tree in Figure 11 is created using these features obtained for the straight lines contained in the image. Then, classification is realized for all lines obtained from images. Following the classification operation, a straight line can represent rail or sleeper. The lines which do not represent rail and sleeper are defined as invalid lines. Then, rail surface is obtained using railway lines detected. Binary transform is applied on the rail surface obtained and hence the rail surface failures are detected.
A decision tree is a baseline decomposer of distributions of data using small decision rules in a cluster with a large number of variables. This allows the distribution to be shown in simple steps. With the decision tree model, it is possible to trace which factors will be taken into consideration in the process of reaching the decision. The data held in large databases can be easily analyzed, interpreted and concluded with the help of decision trees. Decision trees are usually; It is frequently used in analysis studies such as the identification of the element that may belong to a class, the division of new events into categories, the prediction of a possible event in the future, and the definition of the relationship between cause and effect.
One of the important issues in the decision trees is that the branching structure of the decision tree is to be made according to what criteria. Different algorithms have been developed for each of these branching criteria. In this study, branching structure was created by using C4.5 algorithm. The C4.5 algorithm is entropy-based. The entropy equation is given in equation 8.
In equation 8, n is the number of independently generated data. . ({a1, a2,…, an}) The probability of each data production is pi.
The C4.5 algorithm is the extended version of the ID3 algorithm. It contains all the features of the ID3 algorithm. The ID3 algorithm is a mathematical algorithm developed for the classification of decision trees. If T is the target attribute and X is taken as a non-target attribute, T is the weighted average of the information required by any element of Ti to determine the class of an element of T if it is divided into subclasses T1, T2,…, Tn bound to X. In that case, the amount of information to determine the class of T is given in equation 9.
The information gain is specified as the difference between the original proprietary information and the information obtained after the disintegration. The gain equation is given in equation 10.
The purpose of this process is to obtain the piece with the highest information gain. Information gain measure, in some cases it might not work for us to process. For Such cases, the concept of division information has emerged. The information gain is a kind of normalization process. This process is given in equation 11.
This value provides the information generated by the T data set, which is divided into k pieces of the X attribute processing. The class obtained from the same partition bound measures the appropriate knowledge. The gain ratio is given in equation 12.
The attribute with the maximum gain is used as the division quality. The data used in the ID3 algorithm are nominal values and can not be manipulated with numeric values. In the C4.5 algorithm, a solution to this situation is presented.
In this process, threshold values are firstly provided for the given numerical training data. For this, all the data are ordered and converted into {vi, v2,…, vn}. This sequence is divided into two equal parts and takes the form { v1,…, vi} and { vi+1,…, vn}. The threshold value for this operation is given in equation 13.
After finding the threshold value, the numerical training data given is made into nominal:
- -
The data corresponding to the condition vi < ti “small”
- -
If the expression satisfies the condition vi ≥ ti, the expression “large equal”In the form of new values.
B. Rail line Monitoring Stage: In the proposed method for monitoring of rail line, an image processing-based method is proposed to perform direction detection on rails. Pre-processing is realized on the images obtained from the camera fixed on a locomotive. Then, edge detection is performed on these images using certain image processing techniques and hence rails are detected. The direction followed by rails is identified using the angle values of rails. The degree of curves on railway lines affects train speed. Early diagnosis of the failures on curves is highly important for safety of railway line22–24. A block diagram of the proposed method is given in Figure 12.
Proposed approach structure for railway monitoring.
It is required to capture images in different situations in order to follow the proposed approach. A camera is mounted on the test vehicle in a way to see the rails on the front. While the vehicle is running, the camera always captures images. These captured images are transferred to a computer to be processed.
The video-format image is divided into its frames. Each frame is transformed into 480×360 pixel format. Then, these frames are divided into two parts horizontally. The operation of division into two parts is shown in Figure 12. Following the operation of division into two parts, two images with 480×180 pixel format are obtained. The point of view of the camera mounted on the test vehicle is highly wide. Therefore, the captured image does not contain only the railway line on which the vehicle is running. On double tracks, the point of view of camera sees also the neighbouring railway line. In order to prevent it, the zones that represent the railway on which the vehicle is running are calculated on both images. The related zones are detected on each image in order to enable rail tracking on these images. A tetragonal zone determined between the points (192,180)-(288,90) in the image is calculated for the first image. A tetragonal zone drawn between the points (160,480)-(320,180) in the image is calculated for the second image.
After completion of pre-processing of an image of a frame, grey images are obtained for each image part. Edge extraction is firstly performed on grey images. Following edge extraction, dilatation is performed in order to make the edges in the image clear. After dilation, Hough transform is applied to the image obtained and hence the straight lines contained in the image are detected. Then, the direction of rail line is detected taking into account the angle values of lines contained in the image.
When evaluating the gradient angles taken from both image parts, these angle values are compared. A threshold value is identified over the data obtained from this comparison. Based on the angle values examined over the real data obtained from railways, this threshold value is defined as 100. Thus, it can be stated that the gradient angle difference between two image parts is more than this threshold value, the rail is running towards a direction. When the angle value of the first part is compared with that of the second part, if the difference between these two angle degrees is −10 or less, the direction of rail tends to turn right while it tends to turn left if the difference is +10 and more. A pseudo code that indicates the decision for this evaluation operation is given in Table 2.
| Inc1 ← Inclination angle value for first part |
| Inc2 ← Inclination angle value for second part |
| Sub ← Inc1-Inc2 |
| if (Sub < −10) |
| TurningDirec = ‘Right’ |
| else if (Sub > +10) |
| TurningDirec = ‘Left’ |
| else |
| TurningDirec = ‘Straight’ |
| end |
Pseudo code for evaluation of direction angle values.
In this study, the situation was monitored for several components in the railway, unlike the literature. While the railway components are being monitored, the railway line is also observed. In the proposed method, the features obtained in image processing are given to the decision tree and the railway components are determined. Decision trees are a commonly used machine learning method. Using this method, tree structure was created first. Then, this tree structure on the railway vehicle was used to quickly detect the component. This study is different from the literature and the other side is tested on a real railway line by using an experimental vehicle.
4. Experimental Results
A test vehicle is used in order to obtain experimental data in this study. Three cameras are fixed on the test vehicle and the videos of rail components and rail line are captured. The videos of rail components are captured by two cameras fixed on the front of the test vehicle. The rail components in the image are detected and the rail surface failures are monitored by applying the proposed method on these videos. Another camera fixed on the top of test vehicle capture videos of rail line. The angles of curves on the railway are calculated and the rail line is monitored by applying the proposed approach on these videos. In this study, the model structure describing the experimental setup is given in Figure 13.a. Testing of the proposed method by running the test vehicle on the railway is also given in Figure 13b.
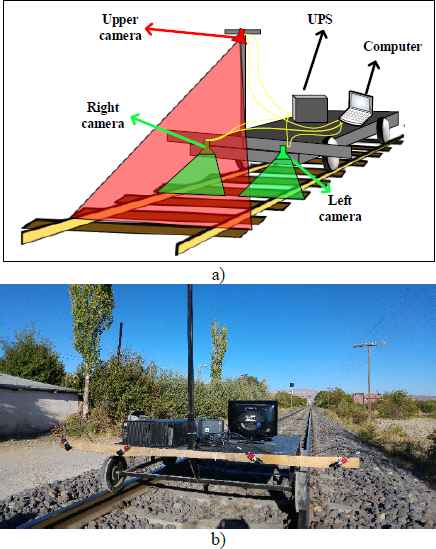
Experimental design of the proposed method a) Model construction b) Installation of the test vehicle on the railway line
In Figure 13b, real-time images on the railway track are tested with the developed program. Three high speed cameras, a frame grabber card, a computer and an experiment tool were used in this study. The properties of the devices used are given in Table 3.
| Device name | Device Features |
|---|---|
| Camera | Manufacturer: Allied Vision, Model: Mako G-032B/C, Resolution: 658(h) 492(v), Sensor Size(inch): 1/3, Frame Rate(fps): 102, Sensor Type: CCD, Pixel Size(µm): 7.4(h) 7.4(v), Interface: GigE, A/D Bits: 12. |
| Frame Graber | PCI Express® x4 compliant, Support for four independent Gigabit Ethernet ports Support for IEEE 1588, PTP technology, Support for IEEE 802.3af for PoE (Power over Ethernet), Support for jumbo frames (9 KByte), Support for link aggregation, Powered Device (PD) auto detection and classification |
| PC | i5, 3.20 GHz, and 8.00 GB RAM |
| Railway vehicle | Height: 300mm, Length: 1500mm, Width: 1360mm, Wheel Radius: 100mm. |
Properties of used devices
The method proposed in this study was implemented on a real railway line and real-time condition monitoring was done. This shows that the proposed method can work in real time. The method for detection of rail components and monitoring of rail line produces successful results for a railway vehicle which is running at a speed of 36 km/h.
A. Experimental Results for Detection of Rail Components: Two cameras are used in the method proposed for detection of rail components. One of these cameras captures the images of right rail while the other camera captures those of left rail. Using the images captured by the right and left cameras, the experimental results are obtained. The images captured from a railway line with concrete sleepers and the results obtained from these images are given in Figure 14.
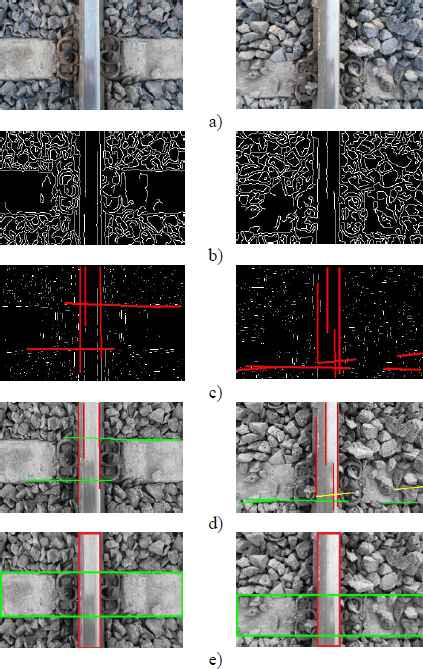
Sample images from a railway has concrete traverses. a) Normal image b) Image after edge detection c) Line detection with Hough transform after appling mask d) Classification of lines e) Railway component.
Examining the results in Figure 14, it is seen that the railway components are detected successfully. The success ratio of the proposed method is affected by the intensity of ballast on the railway line. Intensity of ballast prevents detection of sleepers in the image. It is seen in the first image in Figure 14 that ballast does not cover the sleeper surface while ballast prevents the sleeper surface from being seen in the second image. It is found that sleepers cannot be seen at all due to ballast intensity in some sections of railway line. This situation affects the success ratio of the proposed method. The accuracy rates for detection of railway components and monitoring of rail surface in different ballast intensities are given in Table 4.
| Method | Balast density on traverse surface | Accuracy rate (%) |
|---|---|---|
| Railway | None | 87,6 |
| component | Few | 82.9 |
| detection | More | 68,3 |
Railway component detection and accuracy rates of railway surface monitoring for different conditions
As it can be seen in Table 4, the ballast intensity on the sleeper surface affects the accuracy ratio of the proposed method. The rail surface detected in the images is extracted and it is used along with binary transform to examine the rail surface. A threshold value in the rail surface images is defined for binary transform. Using this threshold value, grey image is transformed into black-white image. The black pixels in the results obtained represent the faulty zone. The results for two rail surface images are given in Figure 15.
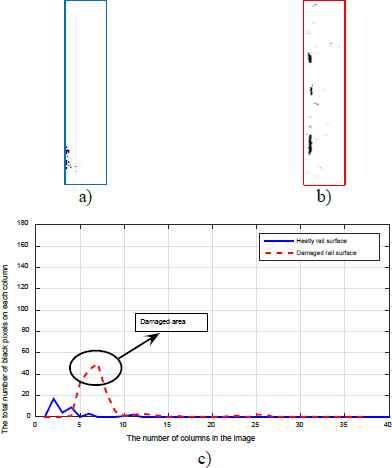
Observation of railway surface on sample images a) Image of solid railway surface b) Image of damaged railway surface c) Black pixel count in every column of images.
As it can be seen in Figure 15, the sample rail surface images are examined and it is determined whether they are working or damages. The rail surface detected using the decision tree is transformed into a binary image via a threshold value. The graphic in Figure 15 is developed by calculating the total number of black pixels on each column in the images given in Figure 15.a and Figure 15.b. The total number of black pixels on each column represents the extent of damage on rail surface. In the proposed method, the threshold value is defined as 40. In the event of exceeding the threshold value, the result of damaged rail surface is indicated. Examining the existing studies in the literature, it is seen that some of the rail surface failures can be detected by basic image-processing methods25,26.
B. Rail Components Experimental Results for Monitoring of Rail line: Using the proposed method for monitoring of rail line in this study, the results are obtained over the sample images. As it is seen on the testing apparatus in Figure 16, the railway line is monitored using an overhead camera.
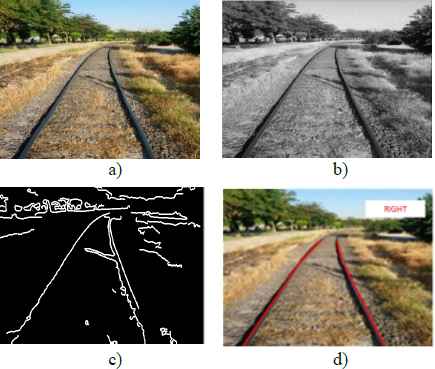
Results for right direction railway a) Normal image b) Image obtained filter result c) Image after edge detection process d) Direction detection after Hough transform.
The proposed method is applied on the images captured from railway line and hence the direction detection is performed on the line. The results using the images captured from different railway lines are given in Figure 16 and 17.
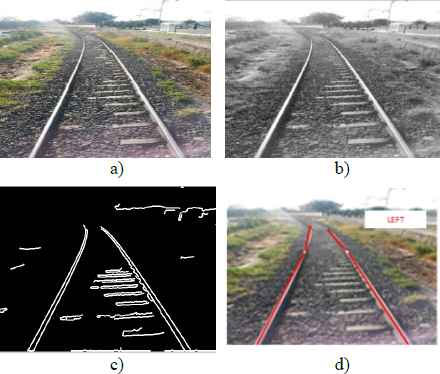
Results for left direction railway a) Normal image b) Image obtained filter result c) Image after edge detection process d) Direction detection after Hough transform
As it is seen in Figure 16 and 17, the images are captured from a single track with concrete sleepers. By applying filter on the normal images given in Figure 16.a and Figure 17.a, the images in Figure 16.b and Figure 17.b are obtained. Then, edge extraction is performed on these images obtained and hence the images in Figure 16.c and 17.c are obtained. Hough transform is applied on the images whose edge extraction is performed and thus the straight lines which represent rails in the image are obtained. The turning direction of rail line is defined by calculating the angle data of these straight lines. It is determined that the rail line in Figure 16.d turn right while the rail line in Figure 17.d turn left.
In another test conducted via the method for monitoring of rail condition, two different images of railway line are captured in video format. It is tried to detect the turns of the vehicle throughout its running on the railway line over these videos. The results of these videos are given graphically in Figure 18.
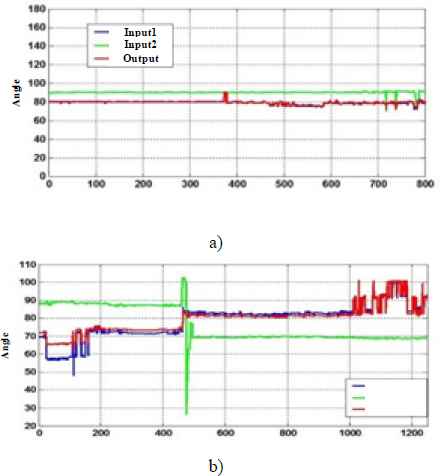
Direction results according to sample videos a) Railway is straight during the first video b) Railway is turning right and following it is turning left during the second video.
Figure 18 includes the first video with around 800 frames and the second video with around 1200 frames. In the graphics, “Enter 1” parameter represents the value of upper part of the images divided in the pre-processing stage while “Enter 2” represents the value of lower part. “Exit” parameter is the resulting value obtained by evaluation of two parts. Examining the first video, it is seen that the railway test vehicle is generally running on a straight line. In the second video, the vehicle is running on a line turning right between frame 0 and 400 and then on a line turning left between frame 1000 and 1200.
C. 3.2. Experimental Results for Monitoring of Rail line: In this study, the rail components are detected and the rail surface is monitored. Also, the condition monitoring is performed on the rail line. Given the studies in literature, no method has been developed for detection of rail components and monitoring of rail surface failures and rail line condition. The study period of the proposed method and those of the studies in the literature are compared in Table 5.
| Method | Running time (ms) | Standard deviation (ms) | Image size (pixel) |
|---|---|---|---|
| Our method railway component detection | 166,4 | 4,11 | 640×360 |
| Our method railway surface monitoring | 50,4 | 2,01 | 80×360 |
| Our method direction detection on railway | 137,5 | 3,82 | 480×360 |
| Railway surface fault detection27 | 1064,6 | 2,3 | 640×480 |
| Railway component position detection28 | 274,0 | 4,1 | 512×832 |
| Railway component recognition28 | 91,0 | 1,8 | 512×832 |
| Railway component detection29 | 120,0 | 2,5 | 320×240 |
| Railway surface detection9 | 100,0 | 1,7 | 220×220 |
Performance comparison of proposed method and some studies in literature
In Table 5, the studies in the literature and the proposed method are compared. The proposed method consists of three methods: detection of rail components, rail surface and direction on railway line. In Table 5, run time and image dimensions are given for component detection, rail surface and rail track direction detection. Considering the working times and image dimensions of the literature given in Table 5, the proposed method seems to be successful.
In this study, it was emphasized that the images were taken and tested using the experimental tool. The velocity of the test vehicle was calculated by taking into consideration the area the cameras track on the railway line and the recommended method. As a result of the calculation, it was observed that the test vehicle was tracking the situation smoothly while moving at a speed of 36km / h. Moreover, if a better computer is used than the computer on which the proposed algorithm works, it can operate successfully at a speed faster than 36km / h. If a high-performance industrial computer is used instead of a computer in this study, the working speed of the proposed method may increase up to 100 km / h. Thus, while monitoring and diagnosing the situation on the railway, transportation won’t be interrupted. Khan et al6. The speed of the proposed method is 10mph. Li et al. 10mph of operation8. Ying et al15. suggested that the method could operate at a speed of 16 km / h when applied on the train. The proposed method is faster from the literature.The camera and the computer fixed to the test vehicle can also be fixed on the railway vehicles. The railway vehicle can be traced during transportation to track the railway track and its components. Thus, possible faults can be prevented by early detection of faults that can occur. As a result, it is seen that the proposed method works smoothly on the railway line and successfully monitors the condition.
5. Conclusions
Railway vehicles which have been used up to now are highly preferred for freight and passenger transport. Since the failures on railway lines affect the quality of transport adversely, periodic maintenance is considerably important. Due to developing condition-monitoring methods, the capability to detect the failures on railway lines by contact-free methods has also improved. Using contact-free methods for condition monitoring, maintenance of railway lines is performed in a planned way and the repair costs are reduced now. This study proposes a method for detection of rails and sleepers which are the most important components of railway lines and also another method for detection of direction of rail line. In the proposed method for detection of rail components, the image processing methods are used and edge extraction is performed over the images captured from rail left and right cameras. A decision tree is created using the features obtained. Via the decision tree, the straight lines in the image are classified and the rail components are detected. Then, the rail surface is obtained and the damages on it are monitored. In the method for monitoring of rail line, the images captured by the overhead camera are used. From these images, the straight lines representing the rail line are obtained and also the angle data as well as turning direction of these lines are identified. In this study, two different methods are combined to detect rail components and monitor the rail line condition. Also, the damages on the rail surface detected are monitored. Thus, a condition-monitoring system is developed for railway using multiple cameras.
Acknowledgement
This study has been supported by The Scientific and Technological Research Council of Turkey (TUBITAK 1001 Programme) under Research Project No: 114E202.
Footnotes
This study has been supported by The Scientific and Technological Research Council of Turkey (TUBITAK 1001 Programme) under Research Project No: 114E202
References
Cite this article
TY  - JOUR
AU  - Mehmet Karakose
AU  - Orhan Yamanand
AU  - Kagan Murat
AU  - Erhan Akin
PY  - 2018
DA  - 2018/01/01
TI  - A New Approach for Condition Monitoring and Detection of Rail Components and Rail Track in Railway*
JO  - International Journal of Computational Intelligence Systems
SP  - 830
EP  - 845
VL  - 11
IS  - 1
SN  - 1875-6883
UR  - https://doi.org/10.2991/ijcis.11.1.63
DO  - 10.2991/ijcis.11.1.63
ID  - Karakose2018
ER  -