
Genetic Algorithm Approaches for Improving Prediction Accuracy of Multi-criteria Recommender Systems
- DOI
- 10.2991/ijcis.11.1.12How to use a DOI?
- Keywords
- Multi-criteria recommender systems; Genetic algorithms; Aggregation function; Evaluation metrics; Prediction accuracy
- Abstract
We often make decisions on the things we like, dislike, or even don’t care about. However, taking the right decisions becomes relatively difficult from a variety of items from different sources. Recommender systems are intelligent decision support software tools that help users to discover items that might be of interest to them. Various techniques and approaches have been applied to design and implement such systems to generate credible recommendations to users. A multi-criteria recommendation technique is an extended approach for modeling user’s preferences based on several characteristics of the items. This research presents genetic algorithm-based approaches for predicting user preferences in multi-criteria recommendation problems. Three genetic algorithms’ methods, namely standard genetic algorithm, adaptive genetic algorithm, and multi-heuristic genetic algorithms are used to conduct the experiments using a multi-criteria dataset for movies recommendation. The empirical results of the comparative analysis of their performance are presented in this study.
- Copyright
- © 2018, the Authors. Published by Atlantis Press.
- Open Access
- This is an open access article under the CC BY-NC license (http://creativecommons.org/licences/by-nc/4.0/).
1. Introduction
Recommender systems (RSs) are intelligent decision support systems that have been employed extensively over the last few years to assist users in solving various decision-making problems43 20. Several techniques have been deployed to build RSs, and they are mostly used to categorize the systems. Adomavicius and Tozhilin5 classified RSs based on the techniques the system used to make meaningful recommendations. They are collaborative filtering, content-based filtering, and hybrid-based filtering that combines the two techniques in different ways.However, as most of the existing RSs used a single rating to represent the opinion of the user, current research has also confirmed that users’ preferences for items may depend on several characteristics, which need to be taken into consideration while making recommendations 44, 11, 18. Therefore, one of the most outstanding issues in the RSs research community is to overcome the limitations of using just one rating technique to recommend items 4.
Multi-criteria recommendation techniques are considered as extensions of the single rating techniques which use multiple ratings from various characteristics of items to model users’ preferences and make more accurate and effective recommendations. This is because different users may have different tastes on items subject to numerous features of the items. For example, in a movie recommendation problem, some users may like a movie based on its action or story, while others may like the same movie by its direction, visual effects or any other combinations of the distinct characteristics of the movie. Therefore, measuring similarities between users should be subjected to the tastes of users on several basic features of the items.
While the advantage of considering multidimensional ratings has been acknowledged and its accuracy has been tested by the RSs community 4, the challenge now focuses on choosing an efficient modeling approach for predicting users’ preferences based on multiple criteria ratings. The aggregation function approach has been used in different ways by many researchers such as Adomavicius & Kwon 2, Teng and Lee 42, Lakiotaki et al. 32, and most recently by Jannach et al.27 26 who used support vector regression to model multi-criteria recommendation problems. However, some of these approaches have some weaknesses. For instance, Teng and Lee proposed the use of data query technique to solve multi-criteria recommendation problems. In their study, recommendation problem was taken to be a query problem, and as such, they employed data query technique to solve multi-criteria recommendation problem. However, as the study did not consider the multi-criteria recommendation problem as an optimization problem, the feature weights of the criteria ratings were not taken into consideration. Similarly, the support vector regression (SVR) used by Jannach et al. 27, to model the criteria ratings has some drawbacks, as working with the SVR requires the choice of appropriate hyper parameters that would allow for sufficient generalization of performance. Also, as the SVR uses a kernel trick, choosing a suitable kernel function could be a problem as well 9. Further, the multi-criteria user modeling approach by Lakiotaki et al., which uses utility additive algorithms (UTA) 41 could only work with sufficiently enough ratings available for the active user. Therefore, more research on modeling multicriteria recommendation problems are required to improve the accuracy of the systems
Consequently, in 2011, Adomavicius et al. 3 challenged the RSs research community to use some of the sophisticated machine learning algorithms such as genetic algorithms, artificial neural networks, and the likes to model multi-criteria recommendation using an aggregation function approach. The work of Jannach et al. 27 was among the first attempts to follow this challenge. Furthermore, the same people repeated this call after five years while acknowledging the initial efforts to encourage researchers to apply powerful machine learning techniques to address multi-criteria recommendation problems 4. This challenge engenders our motivation to use genetic algorithms for improving the prediction accuracy of multi-criteria RSs.
The goal of this research is to use the standard genetic algorithm and the optimized genetic algorithms (adaptive and multi-heuristic) to enhance the prediction accuracy of multi-criteria RSs using the aggregation function approach. We used genetic algorithm because, unlike gradient-based that are required to satisfy certain mathematical properties like differentiability, convexity, and continuity, the genetic algorithm does not have these restrictions in solving many real-life problems. Another advantage of genetic is the use of crossover and mutation operators, which make it popular and more diverse and thus, more immune to being trapped in local minima 36. This study aims to contribute to this growing area of research by providing a comprehensive methodological framework that combines genetic algorithms techniques with the single rating collaborative filtering techniques to model multi-criteria rating problems. The study also adds to our understanding of the expected accuracy improvements of the MCRSs over single rating techniques. The article consists of five sections, including this introductory section. Section 2 presents a comprehensive overview of the related background. Section 3 elaborates on the research methodology, while section 4 presents the experimental results and discussion, and finally, section 5 focuses on the conclusion and future research directions.
2. Related Background
In this section, we introduce some basic concepts that will be used extensively throughout the paper. In particular, section 2.1 contains an introduction to multi-criteria recommendation and explanations of the two main approaches of modeling multi-criteria ratings. Section 2.2 gives the general overview of genetic algorithms.
2.1. Multi-criteria recommender systems
Traditionally, RSs recommend items to users based on a single rating between users and potential items 16, 17 ,19 ,22. Their rating function f measures the degree of likeness of an item by a user as f : user × item → ro, where ro is the predicted rating. This function is used to calculate ro between each user-item pair. However, users’ interests may depend on several items’ characteristics. For instance, as mentioned earlier, a user may prefer to watch a movie by its direction and/or visual effects, while another user may be interested only in the story and/or action of the same movie. This will be difficult if not impossible for a single rating technique to know whether such users are similar or not. Multi-criteria RSs (MCRSs) constitute a new recommendation technique that uses multiple ratings (criteria ratings) from different characteristics of items to predict the acceptability of an item by the user. Its utility function extends that of traditional techniques to account for multiple criteria ratings, as in the relation presented in (1), for n distinct criteria.
2.1.1. Aggregation function approach
The aggregation function is a model-based approach that builds a predictive model to evaluate and compute unknown ratings through training and learning from a dataset 21. While other approaches consider the overall rating ro as another criterion, the aggregation function approach assumes ro to be an aggregation of the other n-criteria ratings as shown in (2).
The basic recommendation operations of the aggregation function approach can be summarized in three steps:
- 1.
Decompose the n-criteria ratings into n separate single rating problems
- 2.
Use any traditional technique to predict new criteria rating r′i ∀i ∈ [1,n].
- 3.
Use the proposed aggregation to learn the relationship between ris and ro as in (2).
- 4.
Integrate step 2 and 3 to predict new r′o.
- 5.
Recommend items based on the strengths of the r′o
Furthermore, Fig 1 provides a pictorial description of the execution of the proposed GA-based aggregation function models. Each of the proposed models follows this same procedure to predict unknown overall rating r′o and provide top-N recommendations.
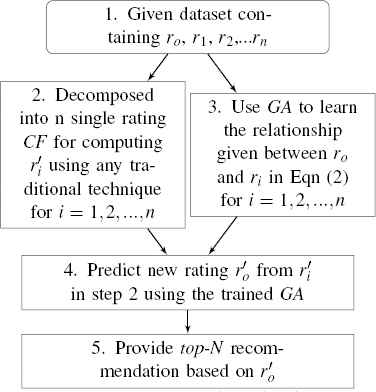
Operation principles of the GA-based aggregation function models
2.1.2. Heuristic-based Approach
In traditional similarity-based collaborative filtering (CF), a rating rui of a user u on new item i is estimated using the ratings given by users v ∈ U(i) who already rated i and have similar opinions with u as shown in (3), where
Heuristic-based MCRSs approaches extend the computation of the above mentioned CF technique to account for the criteria ratings. Unlike the aggregation function approach that works based on the criteria ratings, heuristic-based approaches incorporate similarities between users based on individual criteria to predict the overall rating. The similarities based on each criterion k can be computed as simk(u,v) using (4), and the overall similarity can be obtained by modeling the simk(u,v) for k = 1,2,…,n. Different approaches have been proposed for computing the overall similarities. An average and a worst-case similarity calculation techniques shown respectively in (5) and (6) are among the more commonly used techniques for computing the overall similarity 4. After calculating the similarity (using either (5) or (6)), the overall rating ro is estimated the same way the traditional CF estimates rui in (3).
However, even though the efficiency of heuristic-based approach has been proved 2, one of its major drawbacks is that it can only work with the traditional similarity-based CF.
2.2. Genetic algorithms
In the 1970s, John Holland developed an optimization algorithm called the genetic algorithm (GA for short) 24. It is an adaptive and heuristic search technique that mimics parts of natural evolution and genetics. GA was mainly designed to imitate the activities of natural biological systems that are required for evolutional processes 10, particularly those that follow the postulate of the ”survival of the fittest”, given initially by Charles Darwin 15. It follows the principle of survival of the fittest between individuals across successive generations for solving optimization problems. Every generation is made up of a population of solutions that are similar to biological chromosomes. Every one of the individuals acts as a point in the search space and represents one possible solution. Then the process of evolution takes place between the individuals in the population.
This optimization technique is much better than conventional artificial intelligence in terms of robustness and its ability to resist slight changes, and it works reasonably well even in the presence of noise. Moreover, it offers significant benefit compared to older techniques when searching an n-dimensional surface, or a multi-modal or large state-space. To understand the fundamental operations of the GA, some of its basic terminologies need to be understood. The common ones among them are:
- •
Genes: The elements or building blocks of chromosomes that cannot be further divided.
- •
Chromosomes: Each chromosome consists of strings of genes, and it represents one possible solution to the problem.
- •
Population: A collection of chromosomes which can reproduce new chromosomes when genetic operators are applied to them.
- •
Mutation: A genetic operator that altered the arrangement of genes within a chromosome to produce new traits.
- •
Crossover: Another genetic operator where some of the genes from two chromosomes are combined to produce new candidate solutions.
- •
Fitness: A computational value produced by each chromosome that determines the degree to which an individual is considered to be well-fit for solving the problem.
- •
Selection: A technique of choosing the parent chromosomes that can produce a future population.
GA implementation starts with a random initialization of the population of chromosomes (or just candidate solutions). Then their fitness will be evaluated to determine the candidate chromosomes that can be chosen to reproduce and generate the next population. The operators mentioned above are to ensure that only the fittest chromosomes and their genes are maintained and combined in a well-defined manner in the future generation. Fig 2 is a flowchart that gives a pictorial representation of the steps involved in GA operations 39.
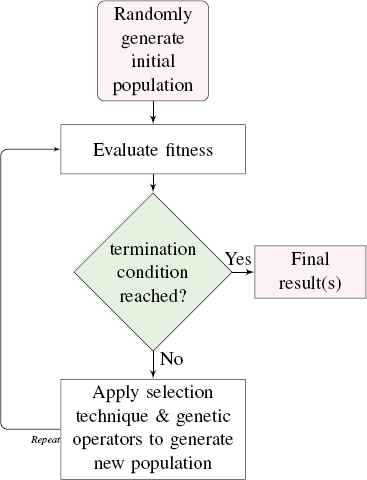
Basic operations of standard genetic algorithm
While the process of solving optimization problems using GA follow the same basic concepts, different specifications can cause their implementation to be performed differently. Choosing the right genetic parameters is at the heart of determining how optimal the final solution produced by a particular implementation of the algorithm is. Every GA experiment will have some basic parameters such as the mutation rate, crossover rate, population size, maximum epoch, and elitism number, which are briefly defined below:
- •
Mutation rate: The probability that determines whether a particular gene in the chromosome will be mutated.
- •
Crossover rate: The measure of the likelihood of how often the crossover operation will be performed.
- •
Population size: An integer number that represents the population of candidate solutions at every generation.
- •
Elitism number: A technique for selecting and retaining the fittest chromosomes called elites, to survive to the next generation. The Elitism number is the total number of elites to be chosen.
- •
Epoch: The maximum number of training cycles for the experiment.
- •
Termination condition: A statement that determines when the training should stop.
3. Methodology
The study began with extracting the experimental data set followed by modeling the aggregation function using the GA approach. This section consists of the detailed analysis of the data set and the modeling techniques. The explanation of the dataset used for the experiments is given in section 3.1. Section 3.2 shows how to use the three versions genetic algorithm for modeling the criteria rating. Setting the experimental parameters is demonstrated in section 3.3. Finally, the mechanisms on how the overall rating could be predicted and the evaluation metrics used for measuring the accuracy of the systems are contained in sections 3.4 and 3.5 respectively.
3.1. Dataset
A dataset for multi-criteria recommendation problems extracted from Yahoo!Movie website 32 was used to test the efficiency of the GA-based aggregation function approaches. The dataset contains rating information from users on movies, evaluated on a scale of 13 values from A+ to F, representing the highest and lowest users’ preferences respectively. Four criteria c1(action), c2(story), c3(direction), and c4(visual effects) of movies were used as the criteria for recommending movies to users. A rating value ri ∈ [A+,F] for i ∈ [1,4] was assigned to each ci. Similarly, the overall rating is represented by ro ∈ [A+,F]. However, the original data set was transformed into a numerical rating matrix with 13 representing A+ and in a like manner, the number 1 representing F in the original dataset. The dataset was cleaned by removing all cases of incomplete ratings for each criterion and cases of users who rated less than five items to guarantee a sufficient set of items for each user. This compressed the dataset to 62,156 multi-criteria ratings from 6,078 different users on 976 movies.
3.2. Modeling the proposed GA-based MCRSs
As explained in the introductory section, the article proposed three GA-based models. This section presents how the criteria ratings are modeled and the methods that each model updates its training parameters. Sections 3.2.1 discussed the modeling techniques using standard GA, while section 3.2.2 contains explanations of the two optimization techniques.
3.2.1. Standard genetic algorithm (SGA)
The experiment has designed an aggregation function that will be used to compute the fitness of chromosomes and the ro. The proposed aggregation function model is shown in (7), where ωi are the genes of a chromosome for i = 1,2,3,4, since there are four criteria ratings so that each ωi will measure the significance of ri in computing ro. Each ωi is a randomly generated real number in the interval [0,1]. The numerator in the right-hand side of (7) is the weighted sum (
The usual crossover operation that mates two parents to produce two offspring was used throughout the experiments. Although different permutations can be formed since the genes are selected randomly from parents, Fig 3 gives some basic combinations of parents’ genes to produce offspring. The operation chooses half of the total number of genes from each parent at random to form two new chromosomes.
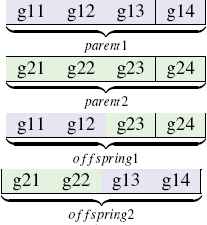
Sample of the crossover operation
The crossover operator could be formulated mathematically, given two parent chromosomes Ch1 = {e1,e2,…,eL} and Ch2 = {g1,g2,…,gL}, each of length L, then a chromosome Ch3 = {h1,h2,…,hL} is said to be the resulting offspring of the crossover between Ch1 and Ch2 if and only if every hi ∈ Ch3 equals atleast one of the corresponding genes (ei and gi) in c1 and Ch2 respectively. That is ∀i : hi ∈ {ei,gi} ⇔ Ch3 ∈ [Ch1,Ch2]. Also, the crossover operator can be expressed as a probabilistic mapping
procedure SWAPGENE(int L, Chromosome Ch) |
index1 ← random(0,L) |
index2 ← random(0,L) |
while index1 == index2 do |
index2 ← random(0,L) |
end while |
flag ← Ch(index1) |
Ch(index1) ← Ch(index2) |
Ch(index2)← flag |
end procedure |
Mutation operation
Furthermore, as chromosomes are to be selected from the population for reproduction, the issue now is how to choose the parent chromosomes so that only the best one will survive and produce new offspring. To date, various methods have been introduced and used to measure the chromosomes’ fitness and select the fittest to generate a new population. These methods include rank selection, steady-state selection, roulette wheel selection, and a tournament selection. The roulette wheel selection technique has been demonstrated in much GA-based research 29 and its efficiency has been established. Therefore, for this study, the roulette wheel selection was used during the selection operation. It works based on fitness values to select the parent chromosomes so that fittest chromosomes will have the chance to be selected (survival of the fittest). To reveal the process of roulette wheel selection, assume that the roulette wheel where all chromosomes are placed is represented by a circle and the area occupied by an individual chromosome depends on its fitness value (see Fig 4), and a die is thrown at random onto the surface of the circle to select a chromosome. It is evident that chromosome c1 occupying 46.6% of the surface will have a high chance of being selected. In addition to its easiness in implementation, the roulette wheel selection technique was used because, as we can see from the figure, the fittest chromosome can be selected many times. This is good since we are not selecting chromosomes of the next generation but the parents, and it is possible for one chromosome (especially the fittest ones) to be parents multiple times.
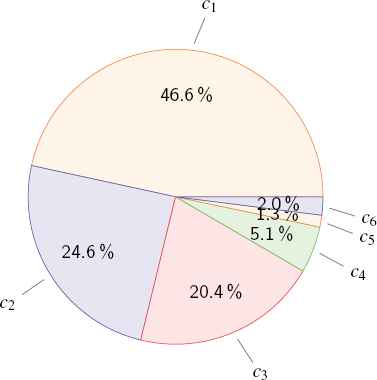
Roulette wheel selection
3.2.2. Optimization of GA-based approach
The experiment did not only used the standard genetic algorithm (SGA) technique to train and learn the aggregation function, other subsets of the GA have been considered as well. This becomes necessary due to the large volume of the dataset and various complex computations required to complete the operations explained above. The optimization techniques are mainly for improving the computation speed and the general performance of the SGA. The two additional techniques used are explained as follows.
- •
Adaptive genetic algorithm (AGA) Traditionally, SGA needs trial and error method to choose the best training parameters that might produce an optimal solution. AGA is one of the two subsets of the GA used in this study to improve the performance of the usual operations of the SGA. It works by adjusting the training parameters automatically while the training is in progress, with a hope that it may lead to choosing the best parameters at any given time. AGA uses information about the fitness of individual chromosome, the current fittest value, an average of the population’s fitness, and the current parameters to dynamically calculates the best parameters to use in the next iteration. This can help to determine how well each of the chromosomes is performing by comparing its fitness with that of the fittest individual so that chromosomes with the poor performance can be dropped and those with better performance can be retained. This dynamic update of parameters is the most preferred way to enable the algorithm itself to adaptively make the necessary updates. Moreover, it increases the operational performance of the algorithm when the population begins to converge, and chromosomes start to come closer to a particular point in the search space. In such a situation, the increase in rates can allow the chromosomes to reach other points in the solution space.
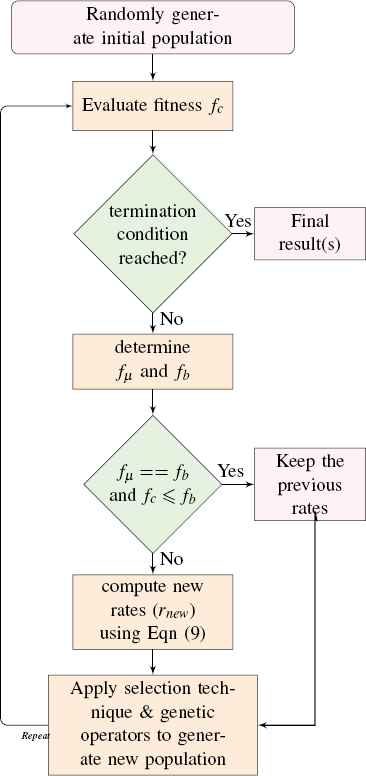
To formulate this technique, let fb, fμ, fc and ri represent the best population’s fitness, the average fitness of the population, the fitness of the current chromosome, and the initial parameter value (e.g., mutation rate) respectively. (9) computes the best rate that was implemented in this study to update the crossover and mutation rates.
Furthermore, it is interesting to present the step by step workflow of the optimized GA. Fig 5 in the next page shows a flowchart that contains the execution steps of the AGA. As we can see from the figure, the AGA works with the average of the fitness values of the population fμ, the fitness of the fittest chromosome fb, and the fitness value of individual chromosome fc. To avoid division by zero in (9) and to prevent losing chromosomes with the high fitness values, the algorithm updates the rates of only individuals whose fitness values are strictly less than fb.
- •
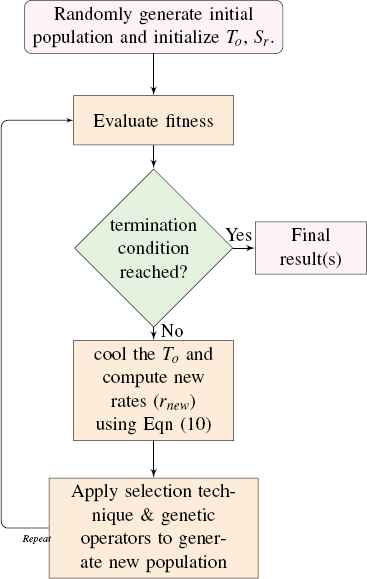
Multi-heuristic genetic algorithm (MGA) The second optimization technique used for achieving remarkable performance improvements was the multi-heuristic approach 10, which combines the principal features of two or more heuristic approaches to form a single algorithm for enhancing the prediction performance. This phase of the experiment integrates the SGA with a hill climbing technique that was aimed to decrease the rate of accepting the worse chromosomes. A simulated annealing was the heuristic used which is a member of local search techniques alias threshold algorithms 1. Implementing multi-heuristic technique help in preventing premature convergence 25 to improve the search process. Similar to the adaptive method, multi-heuristic was implemented to update the crossover and mutation rates, which are to be set initially at a high rate and the technique will reduce the rate slowly as the algorithm is executing. However, since this technique requires some additional parameters known as starting temperature To, and the slow rate Sr, for slowing down the rates so that the crossover and mutation rates will be updated from ri to rnew and cool the To using (10).
Additionally, Fig 6 summarizes the execution steps of MGA, where it extends the SGA by applying some heuristics to update the rates automatically. The main difference between SGA and MGA is the cooling state shown in the figure that computes rnew from the current rate ri using the additional parameters (To and Sr).
3.3. Setting the experimental parameters
In an experiment involving the use of GA and other evolutionary algorithms, selecting suitable experimental parameters would improve the computation time and the solution accuracy. The population size is one of the key GA parameters that determine the convergence of the search space and an approximate number of iterations (epoch) to be used to produce optimal solutions. Other relevant parameters such as the mutation and crossover probabilities are required to be carefully selected to prevent jumping over the solutions they are close to and prevent getting stuck in local minima. Many research on optimal parameter settings in GA have been conducted 12, 13, 6 and presented the ways and benefits of choosing the optimal experimental parameters. As it was investigated by Alajmi and Wright 6, selecting a small population size, high crossover probability, and low mutation rate are considered to be the most appropriate control parameters that could provide optimal solutions. Therefore, in our experiments, the same population size N = 100 chromosomes has been used in all the GA-based models. Other common parameters are the elitism number n = 5, the maximum number of iterations epoch = 200, the minimum (target) error e = 0.01, and the termination condition depends on the epoch and e. In SGA, we set the crossover and mutation probabilities to 0.85 and 0.2 respectively. These parameters were chosen after several trial and error experiments. Similarly, the 0.85 and 0.2 were used to initialize the crossover and mutation rates in AGA, and the values keep updating as the algorithm is running.
Basic operations of AGA
Basic operations of MGA
To recap, the MGA works by starting with high (hot) crossover and mutation probabilities and cools the values slowly as the algorithm runs. We initialized To to 1.00, and Sr to 0.012. The crossover rate begins at 1.00, and the mutation rate was initialized to 0.50.
3.4. Overall rating prediction
Before using any of the GA techniques to estimate the overall rating ro, the n-dimensional rating problem was decomposed into n separate single-rating recommendation problems so that each criterion will be treated independently as a traditional recommendation problem. This indicates that a traditional collaborative filtering technique is required to estimate ri ∀i ∈ [1,n] as f : user × item → ri 2. The current study uses two popular model-based collaborative filtering techniques to conduct several experiments and compare their performance with the proposed GA-based approaches. A singular value decomposition (SVD) and a slope one algorithm were used as the traditional techniques for predicting ri during the experiments.
SVD is a matrix factorization model that maps items and users to k-dimensional joint latent factors†space to model user-item relationships as an inner product in that space 30. According to the SVD technique, each item is related with a vector Vi ∈ ℝn. Also, each user is related to another vector Vu ∈ ℝn, so that for any given item i, the entries of Vi determine the degree to which the item possess those latent factors. Similarly, entries of Vu determine the extent at which a user u is interested in the top-level items on the corresponding factors. Therefore,
In 2005, Lemire et al. presented a paper 33 that proposed a collaborative filtering algorithm called slope one algorithm that was considered to provide a high prediction accuracy than other similarity-based recommendation techniques. Slope one algorithm is a single rating technique that intuitively works based on the principle of “popularity differential” between items for users 34. It is a collaborative filtering technique based on predictors of the form f(y) = y + a, which was the reason for the name “slope one” 7. It predicts any missing rating by computing the average deviation in rating
3.5. Methods of measuring ratings prediction accuracy
Different accuracy metrics have been used in various literature to empirically measure the prediction and recommendation accuracy of RSs by estimating how well the systems can predict nearly exact ratings between every user-item pair. This study evaluates the accuracy of the systems based on the popular metrics broadly classified by Herlocker et al. 23 into three classes: the predictive, the classification and the correlation metrics. The predictive accuracy metrics are to estimate how similar are the predicted ratings with the actual user ratings from the data set. Two metrics that measure statistical differences between the predicted and the actual ratings are used to establish the significance level of prediction accuracy of the proposed GA-based aggregation function approach. A mean absolute error (also known as MAE) was used to estimate the average absolute differences between predicted and the actual ratings. The second metric that is related to MAE is the root mean square error (RMSE) that squares the error differences. It was used in addition to MAE so that emphasis on significant errors can be determined.
Furthermore, regarding determining how often the systems could precisely make the right decision concerning whether or not an item is good for the recommendation. Precision, recall, and F1 measures are among the popular candidate metrics recommended for measuring top-N ranking accuracy 31, and they are therefore used in a similar passion as used in several collaborative filtering research works, such as the work of Sanwar et al. 40.
Additionally, three evaluation metrics for measuring the ranking accuracy of RSs have been used to differentiate between the relevant and non-relevant recommendations carefully, and also to evaluate the ranking accuracy of the algorithms. The area under the curve (AUC) of a receiver operating characteristics (ROC), the normalized discounted cumulative gain (NDCG), and the fraction of concordant pairs (FCP) were used to ensure the correct measurement of the ranking accuracy. Finally, a Pearson correlation coefficient was used to measure the linear relationships between the actual from the data set and the predicted ratings.
4 Results and Discussions
Before experimenting the proposed GA-based approaches, we tested and analyzed the efficiency of each of the two traditional collaborative filtering algorithms. Therefore, the experiments are divided into four parts, and results of each experiment are demonstrated in the following subsections.
4.1. Single-rating techniques
As mentioned in section 3.1, each row of the dataset contains the criteria ratings and the overall rating, this experiment considered the overall ratings as the single rating between for a user to the corresponding item and uses them to learn the relationships between users and items. This was done to monitor their execution time and analyzed their performance regarding prediction, ranking, and classification accuracy. Although the SVD has high training complexity than the slope one algorithm 8, it can be seen from the data in Table 1 that the SVD technique reported significantly more accuracy than slope one algorithm. In other words, from this result, we can see that the SVD technique shows lowest values of MAE and RMSE and highest values for all the remaining metrics. Note that, despite the low performance of the slope one algorithm shown in this table, the subsequent experiments were conducted with both SVD and slope one technique to see the performance of each of the MCRSs and to analyze the result subject to the traditional CF used. This could be interesting as it will show whether there is a high dependency between MCRSs and the single rating technique that was used to model the systems.
| Evaluation metric | SVD | Slope one |
|---|---|---|
| MAE | 2.031 | 2.131 |
| RMSE | 2.857 | 3.048 |
| F1 | 0.793 | 0.786 |
| FCP | 0.767 | 0.739 |
| NDCG | 0.927 | 0.925 |
| AUC | 0.755 | 0.720 |
Evaluation results of traditional SVD and Slope one techniques.
4.2. SGA-based Approach
Recall that both the traditional SVD and slope one-based RSs used only the overall ratings to learn users’ behavior and predict ratings to new items. However, the SGA-based MCRS determines the relationships between criteria ratings to estimate the weights ω in (7) and uses them to calculate ro. The purpose of the SGA-based experiment is first, to determine how much the accuracy of the system could be improved compared to the corresponding traditional SVD and slope one RSs. Secondly, to use the results for comparison with the remaining optimization techniques and possibly with some of the previous methods proposed in the literature for modeling the criteria ratings.
Table 2 presents the breakdown of the performance of SGA-based MCRSs according to the same measures of accuracy used in subsection 4.1. In the table, there is a clear trend of decreasing errors (MAE and RMSE), which is by far, better than the accuracy observed previously in Table 1. The lower errors indicate that the predicted ratings of this technique are much closer to the actual ratings than the traditional techniques. Furthermore, the increase in values of the other six evaluation metrics shows the ability of SGA-based MCRSs to make correct decisions about whether an item is suitable for the recommendation or not.
| Evaluation metric | SVD-based | Slope one-based |
|---|---|---|
| MAE | 1.218 | 1.335 |
| RMSE | 1.747 | 1.931 |
| F1 | 0.869 | 0.864 |
| FCP | 0.908 | 0.866 |
| NDCG | 0.994 | 0.994 |
| AUC | 0.912 | 0.894 |
Evaluation results of SGA-based MCRSs.
One other significant finding is that comparison between Table 1 and Table 2 showed that the same way SVD-based in Table 1 has better accuracy than slope one-based. The SGA-based MCRSs that worked with SVD algorithm has high accuracy than the one that was modeled using the slope one algorithm.
4.3. MGA-based Approach
The difference between MGA-based and SGA-based MCRSs was that instead of using trial and error to chose parameters for the genetic operators (crossover and mutation) in SGA-based technique, the MGA-based uses heuristics (simulated annealing in this case) to cool down the parameters as the algorithm was executing. The rationale behind this experiment is to find out whether using the MGA-based MCRSs could provide higher performance than the SGA-based system. Table 3 shows the results obtained from the preliminary analysis of the performance of MGA-based MCRSs. As expected, the MGA-based MCRSs show significant improvement to the SGA-based MCRSs. The only single point where the two systems showed the same accuracy is the NDCG of the slope one-based MCRSs. With regards to the comparison of this result with that of single techniques in Table 1, the performance of MGA-based MCRSs accords with our earlier observations in section 4.2, which showed that the MCRSs has the highest accuracy and also the performance is subject to the single rating techniques used. The results also provide further support for the assumption that optimizing the GA could achieve significant performance improvements. Furthermore, the results in this section indicate that the AGA-approach in the next section would possibly provide another promising performance.
| Evaluation metric | SVD-based | Slope one-based |
|---|---|---|
| MAE | 0.961 | 1.190 |
| RMSE | 1.396 | 1.670 |
| F1 | 0.896 | 0.881 |
| FCP | 0.913 | 0.867 |
| NDCG | 0.996 | 0.994 |
| AUC | 0.916 | 0.896 |
Evaluation results of MGA-based MCRSs.
4.4. AGA-based Approach
The AGA approach uses information about the fitness of the individual chromosome to update the mutation and crossover rates.
The AGA is another method analogous to MGA that are among the more practical ways of improving the accuracy of SGA. The main reason for this particular experiment is to establish whether the AGA could be better than the two previous approaches, especially the MGA approach that has already shown significant improvement over the SGA. The results of the performance analysis of AGA-based MCRSs are presented in Table 4. Although no difference greater than MGA-based MCRSs was observed from this table, there was a significant improvement compared to the performance of SGA-based technique illustrated in Table 2. Furthermore, a comparison of the two results in Tables 3 and 4 reveals that based on slope one algorithm, the MGA- and AGA-based MCRSs have the same values of RMSE, FCP, and NDCG. Turning now to the experimental evidence from SVD algorithm, the MGA-based MCRSs outperforms the corresponding AGA-based MCRSs on all the evaluation metrics except on NDCG where they all have the same value.
| Evaluation metric | SVD-based | Slope one-based |
|---|---|---|
| MAE | 1.164 | 1.199 |
| RMSE | 1.691 | 1.670 |
| F1 | 0.879 | 0.869 |
| FCP | 0.911 | 0.867 |
| NDCG | 0.996 | 0.994 |
| AUC | 0.913 | 0.894 |
Evaluation results of AGA-based MCRSs.
4.5. Comparative analysis
Together, the results in Tables 1, 2, 3, and 4 provide important insights into the kinds of traditional technique to use while modeling multi-criteria rating problems using an aggregation function approach, and they also show the effectiveness of using the optimized genetic algorithms (MGA and AGA). The results in Table 1 are consistent with those of Cacheda et al. 8 whose findings showed that SVD-based RSs are more efficient than the slope one-based RSs. Furthermore, the findings confirmed to us that there is an association between performance of MCRSs that are designed using aggregation approach and the performance of the corresponding single-rating technique. In summary, these results indicate that MCRSs that were developed and integrated with the SVD-based traditional techniques are more efficient than the slope one-based approaches, and specifically, the MGA-based approach has the highest accuracy. These findings are further supported by Table 5, which shows the percentage of inter-correlations between the actual ratings of the users from the dataset and the predictions of each approach. The first part column of the table contains the correlation between the predicted values of all the slope one-based techniques and the true ratings, while the second column is for the SVD-based techniques. From this data, we can see that MGA-based MCRSs resulted in the highest correlation with the true users’ ratings. The present study confirms previous findings and contributes additional evidence that suggests that crossover and mutation operators are the most important driving factors that determine the accuracy of GA-based systems. Furthermore, to highlight the significance of introducing the optimization techniques, Table 6 gives the percentage differences between the SGA and the MGA and AGA with respect to the traditional CF techniques.
| Techniques | SVD-based | Slope one-based |
|---|---|---|
| SGA | 89.18 | 85.37 |
| MGA | 92.57 | 89.86 |
| AGA | 90.30 | 86.85 |
Percentage correlations between actual ratings and predicted values for each technique
| Evaluation metric | SVD-based | Slope one-based | ||
|---|---|---|---|---|
| MGA | AGA | MGA | AGA | |
| MAE | 21.10 | 4.43 | 10.86 | 10.19 |
| RMSE | 20.09 | 3.21 | 13.52 | 13.52 |
| F1 | 3.11 | 1.15 | 1.97 | 0.59 |
| FCP | 0.55 | 0.33 | 0.11 | 0.11 |
| NDCG | 0.20 | 0.20 | 0.00 | 0.00 |
| AUC | 0.44 | 0.11 | 0.22 | 0.00 |
Percentage improvements of MGA- and AGA-based MCRSs over the SGA-based approach.
Moreover, it is encouraging to compare these results with that of the heuristic-based approach that uses similarities between users based on individual criteria to compute the overall rating. To do this, a separate experiment was conducted using a heuristic-based multi-criteria rating approach described in section 2.1.2. We used the worst-case similarity computation in (6) which has been proved to be among the best-performing techniques of measuring the similarity between users 2 27. We used item-based CF technique with the number of neighbor k=40. The decision of using item-based comes after considering that our dataset contains more users than the number of movies (see section 3.1), which could prevent a situation where some users may not have neighbors due to the limitations in the number of movies. Table 7 provides the results obtained from the heuristic-based MCRSs. As it can be seen from this table, no increase in accuracy was found compared with our GA-based approaches.
| MAE | RMSE | F1 | FCP | NDCG | AUC |
|---|---|---|---|---|---|
| 1.354 | 1.934 | 0.865 | 0.862 | 0.9716 | 0.881 |
Results of heuristic-based approach
In addition to the comparison with heuristic-based multi-criteria rating approach, it is also interesting to compare the result of the study with the previous works that use other machine learning and statistical techniques to model the criteria ratings. Although direct comparison may not be possible due to the differences in the data set and the choice of the single rating techniques, we can make this comparison by taking the percentage improvement of proposed MCRSs in each study with respect to the single rating technique used to model the system. For instance, in terms of improvements with regard to prediction accuracy, the MGA in Table 3 column one has MAE = 0.961 and RMSE = 1.396, and the corresponding single rating SVD in Table 1 has MAE = 2.031 and RMSE = 2.857, the percentage decrease in
This is far better than the 16% decrease in MAE of support vector machine approach that was investigated by Fan and Xu 14, not to talk of a linear regression method, which only reduces the error by 15% 35. The same comparison can be made with other approaches such as the fuzzy-based approach 38, the hybrid approach 37 which combined selforganizing map (SOM) with fuzzy techniques to improve the prediction accuracy, Jannach et al. 27 who proposed a support vector regression method for improving the accuracy of multi-criteria, and so on. It is also important to note that these comparisons can be made not only on MAE and RMSE, the performance based on the remaining metrics can be done as well.
5. Conclusion and Future work
The present study was designed to determine the effectiveness of various genetic algorithms techniques for improving the accuracy of MCRSs. The experiment was conducted on the SGA which its parameters are set using trial and error, and two additional techniques that update their parameters dynamically when the experiment is executing. The two optimized GA-based techniques are the AGA that uses fitness values of the population to update the learning parameters and the MGA technique that uses the concept of a simulated annealing algorithm to cool down the learning parameters to avoid premature convergence. Each of these techniques has been used in conjunction with two separate collaborative filtering techniques to model the criteria. The two traditional single rating techniques used are the singular value decomposition (SVD) and the slope one algorithm. A total of six MCRSs have been developed in addition to the two single rating RSs. The preliminary results of the eight experiments have been investigated and presented in this paper. The results of this investigation show that the proposed techniques are by far better than the corresponding traditional recommendation techniques, the heuristic-based methods, as well as other aggregation-based approaches that have been developed using some machine learning and statistical techniques. These were confirmed by making a comparative analysis between the proposed GA-based techniques and the state-of-the-art in multi-criteria rating problems. According to the experimental findings of the current study, MGA-based MCRSs achieved the most significant performance improvements. This evidence has further suggested that the MGA-based approach is the efficient way of modeling MCRSs problems.
However, the GA is only one among the most popular types of evolutionary algorithms that could be applied to solve multi-criteria optimization problems, similar algorithms such as an ant colony, a particle swarm optimization, gravitational search algorithms, and so on, need to be tested to investigate the degree to which they might improve the prediction accuracy of MCRSs. Another, area for future research might be to explore the use of GA to train artificial neural networks or a hybrid of GA with other popular training algorithms like the gradient-descent backpropagation algorithms to train the network. Moreover, a greater focus on combining fuzzy-based approaches 45 with GA, to estimate the overall rating could provide impressive results.
Footnotes
latent factor is a measure of common characteristics of items
References
Cite this article
TY  - JOUR
AU  - Mohammed Hassan
AU  - Mohamed Hamada
PY  - 2018
DA  - 2018/01/01
TI  - Genetic Algorithm Approaches for Improving Prediction Accuracy of Multi-criteria Recommender Systems
JO  - International Journal of Computational Intelligence Systems
SP  - 146
EP  - 162
VL  - 11
IS  - 1
SN  - 1875-6883
UR  - https://doi.org/10.2991/ijcis.11.1.12
DO  - 10.2991/ijcis.11.1.12
ID  - Hassan2018
ER  -