
A fuzzy based churn prediction and retention model for prepaid customers in telecom industry
- DOI
- 10.2991/ijcis.11.1.6How to use a DOI?
- Keywords
- Churn Prediction; fuzzy classification; feature selection; telecommunication; retention strategy
- Abstract
Accurate and timely identification of the potential churner, also known as churn prediction, is crucial to devise effective retention strategies. A number of churn prediction models have been proposed in the past, however, the existing models suffer from a number of limitations due to which these models are not applicable on real world large size telecom datasets. Firstly, the feature selection methods adopted in majority of the previous models neglected the information rich variables present in Call Details Records (CDRs). Secondly, the present models have been validated mainly with benchmark datasets which don’t provide a true representation of a large scale real world data in telecom sector. Thirdly, there is very limited amount of work reported in literature that has extended the prediction models towards automatic and intelligent retention mechanisms. Moreover, categorization and severity of the predicted churners has not been focused in the past for targeted and intelligent retention campaigns. Motivated by the aforementioned limitations, we propose a novel churn prediction and retention model for achieving the aim of accurate identification and targeted retention of churners. Primarily, our contribution is the accurate identification of churners at different severity levels using fuzzy based classifiers. Secondarily, our model automatically generates intelligent retention campaigns by mining customer usage and complaints patterns. Experimental results on real world telecom data of a South Asian company revealed the supremacy of fuzzy classifiers in terms of classification by achieving 98% accuracy of churner class. Moreover, the proposed retention strategy based on churner severity and categorization managed to retain 87% of the potential churners.
- Copyright
- © 2018, the Authors. Published by Atlantis Press.
- Open Access
- This is an open access article under the CC BY-NC license (http://creativecommons.org/licences/by-nc/4.0/).
1. Introduction
In telecommunication sector, Customer Relationship Management (CRM) department plays vital role in predicting and retaining the potential churners. Churn prediction is all about accurate identification of customers who are about to leave a service provider also known as churners. While, customer retention is concerned with retaining those correctly identified churners by the prediction models. It has been highlighted in the past research that acquiring a new customer is very expensive as compared to retaining the existing customer [1]. Therefore, it is financially feasible to retain the existing customers. It is reported in [2] that the average churn rate per month in telecom sector is 2.2% whereas telecom companies operating in South Asia face even a higher churn rate of 4.8% per month [3]. That is why there is a fierce competition among telecom service providers in South Asia to retain their existing customers.
In order to combat customer churn, a number of Machine Learning (ML) based churn prediction models have been proposed in the recent past. To name a few, Multilayer Perceptron [4–6], Linear Regression (LR) [7], classification based on Support Vector Machine (SVM) [8–10], Association Rules [11], advanced rule induction [12], Decision Tree (DT) [13], ensemble of hybrid methods [14], churn prediction by feature selection techniques [15, 16], Bayesian network classifiers [17] and improved balanced random forests [18]. The primary objective of these previously reported prediction models is to utilize large amount of telecom data to identify potential churners. However, the proposed models in the literature suffer from a number of limitations which put strong barriers towards the direct applicability of these in a real world environment where large amount of data is present.
Firstly, the feature selection methods adopted in majority of the previous models neglected, with the exception of [13], the information rich variables present in call details record (CDRs) for model development. Instead, features from service logs [14], complaints data [11], customer demographics [12], bill and payment data [15], contractual data [13] and operation support system (OSS) data [18] has been used. Moreover, the selection of important features in the past was done only through statistical methods [11]. Although statistical methods have been applied successfully in diverse domains, however, these methods alone without the integration of domain knowledge have the tendency to yield erroneous results and poor performance of predictive model.
Secondly, the previous models have been validated mainly with benchmark datasets [7, 10, 12] which don’t provide a true representation of real world telecom data consisting of noise and large number of missing values. The presence of noise and missing values in the variables degrades the performance of the prediction models. There is a requirement of developing the models which effectively deal with the noisy data and could work well for a typical real world telecom data containing large number of missing values and noise. Moreover, the classifiers used in the previous models, with the exception of [19] neglected the use of fuzzy classification methods which perform reasonably well for datasets with noise.
Thirdly, there is very limited amount of work reported in literature that has extended the prediction models towards automatic and intelligent retention mechanisms. One major drawback of the existing models is the absence of churner categorization. Some customers churn because of voice service problems while the others leave a service provider due to unattractive data packages. Therefore, churner categorization based on usage pattern in telecom domain is extremely important. Likewise, in the reported literature, a potential churners is simply marked as churner without considering his/her severity to churn, we believe all churners should not be treated in same fashion. Some are very likely to churn while the others might be less likely to leave a service provider. We believe that the capability of the prediction model needs to be extended to automatically generate retention campaigns to the targeted set of churners.
Motivated by the aforementioned limitations, we propose a Fuzzy based prediction and retention model in this paper. The proposed model has been validated using a real dataset of CDRs and complaints, provided by a telecom company. The country and company names are not disclosed due to confidentiality. In order to evaluate and measure the performance of Fuzzy classifiers, experiments have been performed and results evaluated in terms of lift curve and Area Under Curve (AUC). Furthermore, prediction performance of proposed model has been compared with the predominant classifiers reported in the telecom churn prediction domain. It has been observed through experimental results that the proposed model is more accurate in terms of identifying the churners by achieving 98% accuracy. Moreover, our proposed retention strategy based on churner severity and categorization managed to retain 87% of the potential churners.
The remainder of this paper is organized as follows. Section 2 provides a review of the related work to highlight the challenging issues. Section 3 gives an overview of our proposed model followed by Section 4 in which implementation details and experimental results have been discussed. Finally, in Section 5 conclusions are drawn along with the limitation of the existing work to highlight the necessity of the future work in this research area.
2. Related Work
In this section, we review the related work in the area of machine learning based churn prediction models. The purpose of this review is to critically evaluate the predominant machine learning based models to identify the gaps in the area which motivated us to develop our proposed model.
Feature selection methods have been adopted in past by different researchers to select most important features for accurate churn prediction model building. For prediction model building, 84 different features have been selected in [18], however the dataset under experiments contains various features other than CDRs. In this work, supervised, semi-supervised and unsupervised learning algorithms have been used to get most important features. Moreover, some statistical features like most frequent connection locations and average data download/upload speed have been considered in undertaken dataset for experimentation.
Likewise, for selecting finest feature subsets to enhance churn prediction, a modified technique of NSGA-II was proposed in [14]. The algorithm for modified version of NSGA-II (i.e. MNSGA-II), was developed to search domination sets. The outcomes suggest that the anticipated technique is capable for positively selecting features. However, in this work, relatively small dataset with 18,600 instances is used moreover the features have been selected from customer demographics, information of grants and account information instead of customer CDRs.
Feature selection for prediction model in land-line telecommunication services was proposed in [15] by introducing a new window technique with two predictors. The new features resulted in higher accuracy and prediction rates increased from 3% to 5% in different evaluation criteria. Although new proposed features selected through statistical method, gave better prediction results, however underlying dataset was from a landline instead of wireless telecom company. Moreover, dataset with relatively small number of features and instances were employed for model building.
A mathematical model based novel filter approach presented in [20] for features selection. The main idea used in the new proposed approach is finding relationship between categorical values of features and class so that selection or otherwise of features can be decided. The novel proposed approach is effective by using 04 classifiers namely Decision Tree, Naïve Bayes, Logistic Regression and SVM. As DMEL shows unexpected results and has computational cost so it is impractical for selection of attributes in telecommunications for customer churn prediction.
On the other hand, various data mining techniques have been compared using dataset containing the variables like contract details, service status, customer demographics, billing information, service change logs and CDRs [21] however very limited work is carried out using CDR dataset with exception [21, 22] where experiments were conducted on dataset with small number of instances. Moreover, previous research was carried out on postpaid subscribers, the author [21] has worked on prepaid clients of Polish cellular company and selected top 50 out of 1381 attributes based on student’s t-score. In this work, CDR dataset is used however feature selection is performed only through statistical method instead of domain knowledge.
In addition, feature selection methods adopted in past neglected the rich information present in CDRs, with the exception of [13] where contractual features like length of service, payment type and contract type were also used along with CDRs. Moreover, feature selection through domain knowledge with the help of churn indicators is completely missing in literature.
In the quest of prediction model building, different researchers have used benchmark datasets for performance evaluation. To build a prediction model in [10], four different datasets have been taken from UCI repository in order to validate the proposed methodology. The proposed technique is not applicable in telecom domain due to the large size of customer dataset and associated variables. Moreover, the recall and precision is not measured separately to get the overall performance of classification techniques.
In another research [10], a new method of churn prediction was proposed and comparison made between a number of classification techniques. The proposed methodology enjoys the best hit rate, accuracy rate, lift coefficient and covering rate and therefore in result proposed methodology gives an efficient measurement. The proposed technique is not applicable in telecom domain due to the large size of customer dataset and associated variables. It is evident from literature review that majority of previous models have been validated with benchmark datasets which do not provide a true representation of real world telecom data consisting of large number of records.
Moving forward with choice of classifier in model building, there are number of classification algorithms applied on various datasets by different researchers. A telecom service provider in Taiwan compared different data mining techniques [21] and concluded that liner models are much constant than Decision Trees. The author has not recommended usage of Decision Tree with reasoning that these are not stable in high percentile of the lift curve. Moreover, usage of black-box models such as SVM and random forests were declared improper for churn prediction.
In oppose to earlier work using decision trees, a research carried out in [23] using data of 106,000 customers with usage behavior of three months on well-known algorithms of Decision Trees Regression Analysis and Artificial Neural Networks (ANNs) to identify possible churners and found decision trees as most accurate classification algorithm for predicting customers churn in telecommunication.
In order to identify most appropriate classifier, a research conducted in [24], consisted of three levels, which are classification techniques, oversampling and input selections. The classifications methodologies includes benchmarking experiments of twenty-one classification techniques on eleven different datasets. In the re-sampling, minority class was oversampled while in input top twenty variables based on their score were selected for further analysis.
While comparing classifier in another research [10], a new method of churn prediction was proposed and comparison made between a number of classification techniques such as, decision trees (DT), naive Bayesian classifier, logistic regression (LR) and artificial neural network (ANN). The proposed methodology enjoys the best hit rate, accuracy rate, lift coefficient and covering rate. and therefore in result for customer churn prediction, the proposed methodology based on SVM gives an efficient measurement.
Similarly, another comparison of classifiers was performed in [25] with seven different classifiers. In this work, new set of features were proposed. The analysis revealed that new set of features were more effective for prediction than the existing ones. Moreover, in this work author claims that suitability of classifier or prediction model depends upon the objectives of the decision makers.
Social network analysis for customer churn prediction is another emerging technique that has been used by many researchers [26–29] to identify the potential churners accurately. Cross Validation and grid search based two parameter techniques utilized in machine learning technique, SVM [8]. For logistic regression and random forest techniques, predictive performance of SVM is benchmarked in experimentation for the purpose of validation.
For traditional statistical and time variant data, prediction model based on Neural network is proposed in [6] using a mixed process Neural Network (NN). For preprocessing, orthogonal based approach with an optimized cMPNN is presented to simplify the structure. Neural Network for customer churn prediction has been used by different researchers in the past [30, 31] as Neural Networks can better predict the churners, moreover hybrid neural network [6] gave better performance in terms of prediction accuracy.
K nearest neighbor (KNN) and logistic regression were combined together and a hybrid approach presented [7] for churn prediction to build a classifier. Hybrid KNNLR has been used and divided the classification into two phases. For each predictor attribute, KNN technique has been applied in phase 1 whereas with the help of new predictor variable, LR is trained in phase 2 to get better prediction results.
On the other hand, a rule based approach has been proposed in [32] which rely on rough set theory for accurate churn prediction. A most promising technique fuzzy based classification has been experimented [19, 33] which gave better results in terms of prediction performance however experiments were performed on relatively small size dataset with limited features for customer churn prediction.
In churn prediction domain, more recently fuzzy classification technique has been used [34] in banking sector but in this research prediction is done for credit card users instead of telecom customers. Prediction mechanism of both banking and telecom domain is completely different.
Literature review related to classification techniques revealed that fuzzy classifiers never got attention for prediction model building in telecom domain. Moreover, the retention mechanism for identified churners was never combined with prediction model.
Nevertheless, the existing literature showed that for accurate identification of the potential churners, a number of prediction techniques exist however those techniques suffer from various issues due to which implementation of such models gives incorrect results for accurate churn prediction. Keeping in view the prediction capability of Fuzzy classifiers, we believe that building a prediction model using Fuzzy classification techniques is a need of the day.
Finally, the retention strategy is never proposed except [35], however, in this work churners are not categorized to devise an effective retention strategy. Moreover, complain dataset was never integrated for better retention. Customer complaints give very useful information which can help in designing the relevant campaigns. Therefore, we argue that there is a strong need of customer complaints integration in order to pitch the most appropriate offers to relevant customers at right time. This motivated us to develop a prediction model which not only predicts the potential churners accurately but also devise a retention strategy intelligently based on usage pattern and complaints frequency. In next section, overview of proposed model is presented for accurate prediction and intelligent retention.
3. Proposed model for accurate prediction and intelligent retention
In this section, we provide an overview of our proposed model. Fig 1. shows our proposed model for accurate prediction and targeted retention. We explain the components of our model in a step by step manner. We would like to clarify at this point, that our proposed model works only for CDR dataset. Most of the CDRs have the same type of variables which could be handled effectively by our model.
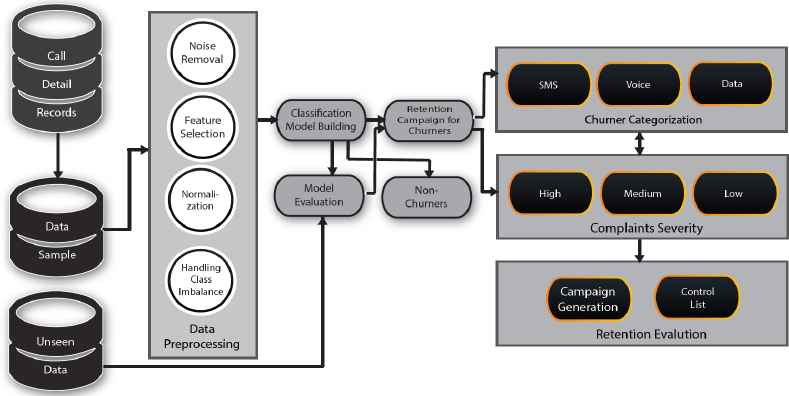
Proposed model for accurate customer churn prediction and retention
3.1. Data Pre-processing
Data pre-processing is the first component of our proposed model. Usually, CDRs consist of noisy and inconsistent data and the first step is to clean the data before passing it for training. The main steps of data pre-processing are given below.
3.1.1. Data Sampling
As size of a typical CDR dataset is large therefore we take the sample of the CDR data for further processing. We suggest stratified sampling of data to ensure that the sample has the same distribution of churner and non-churner class as it was in the original dataset.
3.1.2. Noise Removal
In the next step, we remove the noisy data from the sample taken in our last step. Noise hinders in most of the data analysis, so removing noise is most important goal of data cleaning. Noisy data can lead to inappropriate and erroneous results, so removing such data before training a classifier is very important step. Duplicate or missing data may also cause incorrect or even misleading results. In telecom dataset, generally, there exist a lot of garbage, missing, inappropriate and incomplete values like spaces, ‘Null’ or any other special characters that need to be removed or replaced with appropriate values. For instance, most of the CDR data columns have “Null” values and those could be replace with “0” for efficient processing. In order to remove inconsistencies, outliers are identified and removed from sample at this stage.
3.1.3. Feature Selection
Once noisy data is removed, the next step is the select the important features from the sample taken for processing. Here, we suggest that firstly the features should be selected on the basis of domain knowledge. For instance, there are some common churn indicators such as spend rate decline, outbound call decrease, increase on days with zero balance, decrease in recharge frequency, balance burn out rate, increase in calls to one competitor, decrease in voice call frequency and increase in inactive days.
Such indicators are very helpful in filtering out the variables which are not relevant to the prediction task. In general, these are the main indicators which help analysts and domain experts in identifying the potential churners before they actually decide to churn. With the help of these indicators, analysts can easily remove the non-informative features.
In the second phase, we suggest to apply Principal Component Analysis (PCA) technique to select the information rich variables. The rationale behind using PCA is that it captures the variance of large dimensional dataset in low dimensional set. It is a established statistical technique and have been applied in various data domains successfully. We argue that feature selection through and integrated approach of using domain knowledge and statistical methods allows the selection of the most information rich variables which yields near to accurate prediction results.
3.1.4. Normalization
After selecting the information rich variables, the next step is to apply data normalization on the selected variables. In this step, we use min-max data normalization technique, numeric values are transformed into a range from 0–1. Min-max normalization is a simple technique in which we fit the data, in a pre-defined boundary or interval, that is [C, D]. The complete formula is given in equation (1).
Where min-max normalized data is represented by B given that C, D are the pre-defined boundaries. A is the original value which becomes normalized with the help of formula given in equation 1
3.1.5. Handling Class Imbalance
In telecom churn prediction, ratio of churner is very low as compared to non-churners, which lead towards class imbalance problem. So, class imbalance has to be handled by enhancing the instances of churner class in final dataset. We used over-sampling of minority class to balance both classes.
3.2. Classification Model Building
In this step, we split the pre-processed data into training and testing sets. 70% of the data is used for training the fuzzy classifier and the remaining is utilized for testing purpose. We pass the labelled training data to our set of fuzzy classifiers for learning. Although at the pre-processing stage, we tried to clean the data, however, the selected data for training still has the tendency of noise. To handle such noise and incomplete data, fuzzy classifiers especially Vaguely Quantified Nearest Neighbors (VQNN) play a vital role and help in building accurate models. In the next section, we highlight the difference between the fuzzy and non-fuzzy classifiers to demonstrate the reasoning behind our choice of fuzzy classifiers instead of the traditional non fuzzy classifiers which have been predominantly used in the literature.
3.2.1. Fuzzy Vs. Non-Fuzzy Classifiers
The primary objective of any classifier is to infer some rules from a training set where both class labels are available to build a model. Once model is ready, it has been used to predict the class of unknown objects with different features. There are various classification techniques that have been applied in literature for model building in churn prediction domain, ranging from classical ones like linear classifiers to the advanced machine learning such as boosting and support vector machine. There are two main groups of methods, among all, one is fuzzy and other is non-fuzzy classifiers. Fuzzy based classification technique generally calculates the class conditional probabilities and make decision of the class based on the estimated probability. In contrast, non-fuzzy classification techniques directly estimate the class boundaries without estimation of class probabilities.
The choice of using a classifier for model building entirely depends on nature of classification problem, learning goal and dataset on which classification is applied. A single classifier is not going to work best all the time for all problems. There is a variety of classifiers available that can be applied in telecom domain to build a model for churn prediction. The choice of classifier for churn prediction is dependent on underlying dataset and features extracted for prediction of potential churners.
3.2.2. Fuzzifying the Numeric Attributes
Numeric attributes need to be fuzzified into linguistic terms before they can be considered to build prediction model through appropriate algorithm. Fuzzification process can be done manually or through some automated process using certain rules and clustering algorithm. Similar instances have been grouped together using a simple algorithm that create a membership function against numerical data.
Suppose, in a domain X, ai attribute contains the numerical value x. X can be classified into k linguistic terms Vi,j, j=1,2,3,….,k, where size of k has been defined manually. Below mentioned membership function has been used in 1st linguistic term Vi,j
For Vi,j when j=2,3,4,…..,k−1 has the following triangular membership function:
Finally, for last linguistic term Vi,k , the membership function is as following:
Algorithm 1 shows the steps to fuzzify the numeric attributes.
Input: X – a set of values, n(t) – reperesents the learning rate through monotonic scalar function. |
Output: M= {m1, m2, ….. ,mk} |
Set mi distributed evenly within range of X |
t ← 1 |
repeat |
Draw sample x out of X |
Find the closest center mc to x. |
mc ← mc + n(t) . (x − mc) |
t ← t + 1 |
|
until D(X, M) converges |
Fuzzifying the Numeric Attributes
There are two primary motivations of using fuzzy classifiers in model building using CDRs dataset. Since most of the features in CDRs are numeric, 1st motivation is the flexibility and abstraction in patterns while 2nd is the degree of belongingness of a customer to churner or non-churner class. Fuzzy classifiers gave better prediction accuracy as compared to non-fuzzy classifier, hence few of the variations of fuzzy classifiers used in building prediction model, have been explained as following.
3.2.3. Fuzzy NN
In order to classify an object based on likeness and similarity with another one, the Fuzzy K nearest neighbor (FNN) algorithm is introduced. Let’s suppose an object y belongs to class C which can be expressed as following.
Where yʹs K nearest neighbors is N, and R(x, y) is the [0, 1] – similarity of x and y. It can be written as following.
3.2.4. Quantified Nearest Neighbors (VQNN)
VQNN is the variation of FRNN where R↓C and R↑C have been replaced by R↓ Qu C and R↑ QlC, respectively. In other words, VQNN2 is a variant of FRNN2 in which R↓Rdz and R↑Rdz are replaced by R↓ QuRdz and R↑ QlRdz, respectively. The use of K in FRNN have no importance and its impact is very limited as R(x, y) gets smaller because x have only have a minor influence on (R↓C)(y) and (R↑C)(y). For VQNN and VQNN2, this may generally not be true, As R(x, y) is in the denominator and in nominator so for VQNN and VQNN2 generally it’s not true.
3.2.5. OWANN
Fuzzy-rough ownership identifies the homogenous regions for each class in test data. It also handles the fuzzy and rough uncertainties caused by insufficient knowledge i.e. attributes in training data. For any object y, the fuzzy-rough ownership function τC of class C can be represented as.
3.3. Model Evaluation
After completing the model building step, We evaluate the different fuzzy classifiers. This evaluation helps the analysts to pick the most suitable classifier. In other words, evaluation helps in picking the best classifier for future predictions. It is important clarify at this point that our evaluation is two-fold. Firstly, we evaluate the fuzzy classifiers with our 30% testing data using the two evaluation measures AUC and TP rate. Later on, we select the top two classifiers and test those with our validation data set. Validation data set is kept separately as it is a completely unseen data which helps in determining the final classifier which could be used for actual implementation of model. So from the top 2 classifiers, we select the one which performs well on our validation set. Again, we use the same evaluation measures i.e. AUC and TP rate. The rationale behind using these two measures is that these are the two commonly used performance measures int the literature. AUC measures the models performance regardless of change in proportion of churners. The AUC is the plot between the sensitivity (true positive rate) and 1-specificity also known as false positive rate. We need to look into the entire curve to compare the model’s performance. Fig. 2 represents a sample AUC where area under the curve shows the accuracy of prediction model.
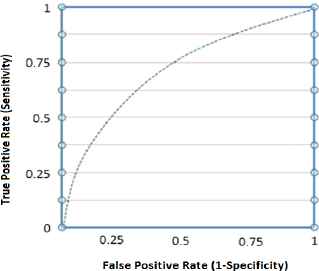
Sample AUC
3.4. Categorization based on usage pattern
In this step, the identified churners by the fuzzy based model are categorized on the basis of their usage trend in observation period. Churners fall under ‘Voice’ category if the usage of voice calls is below than average voice usage of all non-churners. Same rule is applied for remaining two services i.e. ‘Data’ and ‘SMS’.
It is noteworthy that if customer has never subscribed or used a particular service then that particular customer is not selected while designing an appropriate category based retention campaign. For instance, a customer who never used ’Data’ service, will not be selected for retention campaign. In another scenario, if customer falls under more than one category like ‘Voice’ and ‘Data’ then the service with most usage has been offered as it depicts that customer is more inclined toward that particular service.
It is quite possible that a customer is marked as potential churner, however, he/she doesn’t fall under any of the aforementioned service categories. These customers will not be targeted for any retention campaign as their usage pattern are similar to those identified as non-churners. This happens because of the incorrect classification by the prediction model.
3.5. Categorization based on Complaints data
In this step, identified churners are categorized based on complaints data provided by the operator. Complaints dataset contain the information like complaint type, number of complaints and resolution time that is whether complain resolved within agreed time or not. Complaint type is marked by operator either critical or normal, based on nature of complaint registered by customer.
In general, identified churners with critical complaints have been categorized into ‘High’ whereas the customer with ‘Normal’ complaint types are categorized as ‘Medium’ and rest are marked as ‘Low’. There are three factors involved in deciding the categorization of a churner. First is complaint type, followed by the number of complaints registered by the same customer and finally the time taken to resolve the problem.
In case complaint is not resolved within agreed time and customer has registered the same complaint more than once with type ‘Critical’, then churner severity is marked as ‘High’. Similarly, churn severity is marked as ‘Medium’ against which there is only a single complaint is registered under complaint type ‘Normal’ and resolved within agreed time.
Table 1. represents the churner categorization based on complaints data against all possible combinations of complaints for identified churners. Churner fall under ‘Low’ categorization if there is no complaint registered. So, this categorization primarily decides the churner severity and priority of targeted campaign to be pitched to a particular potential churner.
| Complaint Type | Resolved within Agreed Time | Number of complaints (more than 1) | Churner Categorization |
|---|---|---|---|
| Critical | No | Yes | High |
| Critical | No | No | High |
| Critical | Yes | Yes | High |
| Critical | Yes | No | Medium |
| Normal | No | Yes | High |
| Normal | No | No | Medium |
| Normal | Yes | Yes | Medium |
| Normal | Yes | No | Medium |
Churner categorization based on complaints data
3.6. Campaign Generation and Evaluation
Once potential churners are identified along with their severity and categorization based on complaints data and usage pattern, next step is to broadcast most suitable offers through SMS or outbound calls as part of retention campaign. Algorithm 2 gives the step by step procedure to generate a campaign based on usage pattern and complaints severity. As purpose of a campaign is to retain the potential churners, it is quite possible that a customer don’t churn after getting most suitable offer. So, in order to measure the accuracy of our proposed retention strategy, few of the randomly selected customers called ‘control list’ are kept out which have never been part of any retention campaign. Retention would be most effective in case all ‘control list’ customers have churned. Similarly, in case 50% of the ‘control list’ customers have churned, retention would be 50% effective.
Similarly, we evaluate the effectiveness of our retention campaign by measure what percentage of the identified churners didn’t churn because of the timely and targeted campaign. For instance, out of 1000 potential churners if 800 didn’t churn then our retention accuracy becomes 80%. Finally, the overall accuracy of the proposed model is evaluated by looking at the churn percentage in the control list and the retention accuracy of targeted list.
Input: |
Average Voice Revenue of non-churners |
Average Data Revenue of non-churners |
Average SMS Revenue of non-churners |
Complaint Severity (High, Medium, Low) |
List of Potential Churners PC |
VoiceC, DataC and SmsC of all PCs |
Output: Churner Categorization (‘Voice’, ‘Data’, and ‘Sms’) |
Method: |
avgVoiceNC←AverageVoiceRevenue (non-churners) |
avgDataNC←Average Data Revenue (non-churners) |
avgSMSNC←Average SMS Revenue (non-churners) |
for each PC |
if VoiceC < avgVoiceNC and VoiceC > 0 |
add PC to VoiceList |
if DataC < avgDataNC and DataC > 0 |
add PC to DataList |
if SmsC < avgSmsNC and SmsC > 0 |
add PC to SmsList |
if PC fall in more than 1 List then |
getMaxUsage(VoiceC, DataC, SmsC) |
and add to respective List |
else if PC don’t fall under any list then |
Check Complaint Severity (High, Medium, Low) |
if Complaint Severity is High then |
getMaxUsage(VoiceC, DataC, SmsC) |
and add to respective List |
end if |
else |
No Campaign |
end if |
end for |
Return List[Vocie], List[Data] and List[Sms] |
Campaign generation based on usage pattern and complaints
4. Experimental Results and Discussion
In order to validate and demonstrate the accuracy of our proposed model, a case study approach is followed in which experiments have been conducted on a real world large size dataset. For experiments purpose, WEKA software is used on Core i7 machine with 20GB RAM. Eleven different classification techniques, including fuzzy and non-fuzzy classifiers have been applied to validate the proposed model on sample dataset taken for training purpose. Dataset description and step by step implementation of proposed model is given in following sub-sections.
4.1. Dataset
A telecom company operating in South Asia, provided the dataset for experimentation. Dataset consist of 1,000,000 instances of customers with 722 attributes taken from a CDR dataset containing variables like data, voice and SMS usage detail. It covers 3 months usage information of Jan, Feb and Mar 2016 along with complaints data of same months. In this dataset, churner and non-churner information is provided against individual customers. As shown in Fig. 3. independent dataset of another 3 months Apr, May and Jun 2016 is taken for testing and validation purpose on which customers are not marked as churner or non-churner. Prediction was performed at the end of Jun, 2016. Validation dataset contain 50,400 unseen customers that are not provided to model during model building process. Finally, the outcome evaluation has been done in Oct, 2016 because after period of 3 months, a customer gets tagged as churner or non-churner as per operator policy.
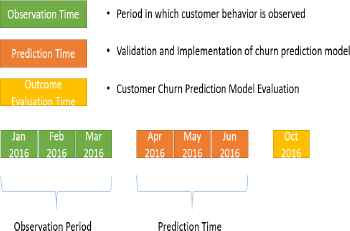
Timeline of Churn Prediction Model
4.2. Data Preprocessing
4.2.1. Data Sampling and Noise Removal
A stratified data sample is taken from original CDR dataset. Selected data sample contains consistent ratio of churner and non-churners same as in original dataset. There are total 200,000 instances selected in which 9.1% are churners.
In provided dataset, there were a lot of missing and inappropriate values like “Null” and outliers. In 1st step, columns with maximum missing values have been identified and filtered out from original dataset. In 2nd step, outliers with (±5%) values removed from complete dataset. Moreover, there were some duplicate values which have been simply removed. Remaining ‘Null’ values were replaced with zero as CDR dataset contains only numeric values.
4.2.2. Feature selection, Normalization and Handling Class Imbalance
Important features have been selected using domain knowledge and through statistical method PCA. Through domain knowledge, 254 most important features that can influence a customer’s churn decision, have been selected by a domain expert. In next step, PCA has been applied on selected features. Table 2 represents subset of 35 top most ranked features that have been extracted through PCA. Fig. 4. represents the feature selection through domain knowledge and PCA.
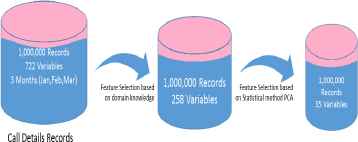
Feature selection based on statistical method PCA and domain knowledge
| Rank | Variable |
|---|---|
| 1 | M1_IC_ONNETMOUS_FREE |
| 2 | M2_IC_ONNETMOUS_FREE |
| 3 | M3_IC_ONNETMOUS_FREE |
| 4 | M1_MIN_GPRS_CONS_INACT_DAYS |
| 5 | M1_AVG_GPRS_CONS_INACT_DAYS |
| 6 | M1_MAX_GPRS_CONS_INACT_DAYS |
| 7 | M2_MIN_GPRS_CONS_INACT_DAYS |
| 8 | M2_AVG_GPRS_CONS_INACT_DAYS |
| 9 | M3_MAX_GPRS_CONS_INACT_DAYS |
| 10 | M3_AVG_GPRS_CONS_INACT_DAYS |
| . | - |
| . | - |
| . | - |
| 34 | M1_MAX_ANY_CONS_INACT_DAYS |
| 35 | M3_MIN_GPRS_CONS_INACT_DAYS |
Feature selection using domain knowledge and PCA
Once important features are selected, normalization is performed in WEKA to get all numeric values in the range of 0 to 1. In normalized dataset, ratio of churners and non-churners was very low i.e. 9.1 and 90.9 respectively in stratified sample dataset. So, class imbalance problem is rectified by enhancing the instances of churner class in final dataset. Sampling technique SMOTE has been applied to balance both classes. As depicted in Fig. 5. Non-churner to churner ratio is 60 to 40 respectively in final dataset.
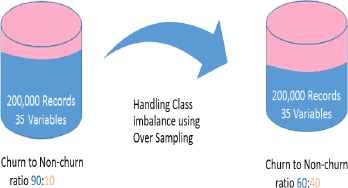
Handling Class Imbalance
4.3. Model Building and Evaluation
In this step, a number of classifiers have been applied on a sample train and test dataset with ratio of 70 and 30 respectively. As shown in Fig. 6. Fuzzy classifiers FuzzyNN, VQNN, FuzzyRoughNN and OWANN have been applied while the non-fuzzy predominant classifiers include Decision Trees, SVM, Neural Networks and Ensemble classifiers. Table 3 gives different performance measures like TP Rate and FP rates along with AUC. While comparing fuzzy and non-fuzzy classifiers in Fig. 6, its very clear that performance given by fuzzy classifiers in terms of AUC and TP rate is much better as compared to non-fuzzy classifiers like Multi-layer perceptron, C4.5 and SVM classifiers. From non-fuzzy classifiers, the best prediction accuracy is given by Multilayer perceptron i.e. 0.65 in terms of AUC as compared to SVM decision trees and ensemble classifiers.
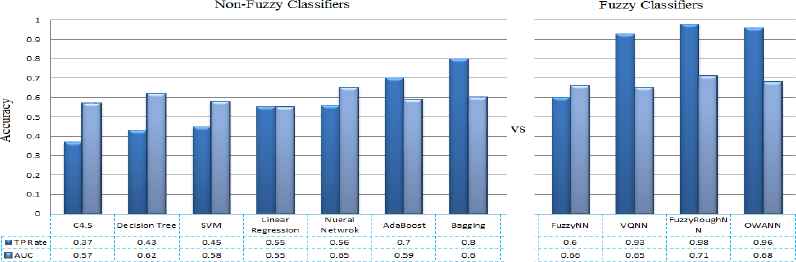
Performance analysis of different classifiers
| Classifier | TP Rate | FP Rate | AUC |
|---|---|---|---|
| C 4.5 | 0.37 | 0.04 | 0.57 |
| Decision Tree | 0.43 | 0.15 | 0.62 |
| SVM | 0.45 | 0.15 | 0.58 |
| Linear Regression | 0.55 | 0.14 | 0.55 |
| Neural Network | 0.56 | 0.32 | 0.65 |
| AdaBoost | 0.70 | 0.32 | 0.59 |
| Bagging | 0.80 | 0.75 | 0.60 |
| FuzzyNN | 0.60 | 0.42 | 0.66 |
| VQNN | 0.93 | 0.94 | 0.65 |
| FuzzyNN | 0.60 | 0.42 | 0.66 |
| VQNN | 0.93 | 0.94 | 0.65 |
| FuzzyRoughNN | 0.98 | 0.87 | 0.71 |
| OWANN | 0.96 | 0.92 | 0.68 |
Classifiers Performance
In model building, FuzzyRoughNN and OWANN gave better prediction in terms of AUC i.e. 0.71 and 0.68 respectively. So, validation through unseen dataset was performed only on these classifiers and FuzzyRoughNN resulted in higher AUC, hence it has been applied for model building and retention. Fig. 7 represents AUC of only FuzzyRoughNN classifier.
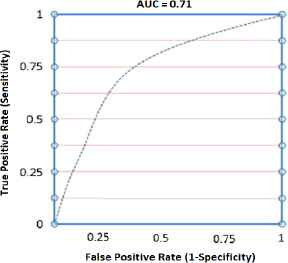
AUC for FuzzyRoughNN fuzzy classifier.
4.4. Churner Severity and Categorization
4.4.1. Churner Severity based on Complaint data
Complaint dataset has been integrated with prediction results obtained using Fuzzy classifier FuzzyRoughNN. There are total 11,541 customers that have been marked as churners. Table 4 represents the categorization of churners for retention campaigns.
| Category | Total |
|---|---|
| High | 197 |
| Medium | 3,410 |
| Low | 7,779 |
| Total | 1,1541 |
Churner categorization based on complaints
4.4.2. Categorization based on usage pattern
Segregation of churners is performed based on service usage pattern and further categorized into Data, SMS and Voice for retention Campaigns. Average revenue of all non-churners is calculated and amount for data, sms and voice are 14.98, 0.92 and 122 Rs. respectively. Identified churners with less than these figures have been categorized respectively. Table 5 represents the segregation of churners based on usage pattern.
| Data | SMS | Voice | Total |
|---|---|---|---|
| 1,883 | 4,964 | 4,694 | 11,541 |
Churner categorization based on usage pattern
4.4.3. Retention Campaign Evaluation
From previous result set, there were total 11,541 churners marked out of 50,400. Churners falling under ‘High’ category are 197 and they must be targeted first with appropriate offers based on their usage trend. Usage pattern of 197 churners have been further analyzed and categorized into data, voice and SMS with 37, 87 and 73 churners respectively in each category. Table 6 represents the split of churners based on complaints data and usage pattern.
| Category | Data | SMS | Voice |
|---|---|---|---|
| High | 37 | 87 | 73 |
| Medium | 677 | 1,374 | 1,359 |
| Low | 1,132 | 3,438 | 3,209 |
Churner categorization for retention campaign
In order to evaluate the accuracy of prediction model, identified churners have been further divided into two groups. One is control list of 10% churners, taken from each category, which are not part of any retention campaign while the other are 90% churners who are targeted with appropriate offers as part of retention campaign. The control contained 1,154 churners out of which 990 customers have churned with accuracy of 85%. On the other hand, targeted customers were 10,387 who have been part of retention campaign and 9,245 customers were retained successfully whereas 1,142 customer churned even after sending appropriate offers, giving accuracy of 87%. While considering both campaign and control list, the overall accuracy of retention campaign was up to 88%.
5. Conclusion and Future Work
In this paper, a fuzzy classifier based customer churn prediction and retention model has been proposed for telecommunication sector. The proposed model utilizes the fuzzy classifiers to accurately predict the churners from a large set of customer records. Experiments performed on the CDRs dataset of a real telecom company of South Asia, showed that the proposed model is able to achieve AUC score of 0.68 with TP rate up to 98%. A number of predominant classifiers in the literature, namely, Multilayer Perceptron, Linear regression, C4.5, SVM and Decision Tree have been compared with fuzzy based Nearest Neighbor classifiers to highlight the supremacy of fuzzy classifiers in predicting the accurate set of churners.
Moreover, an automated and targeted retention strategy has been proposed for the potential churners by categorizing the customers intelligently based on complaint severity and customer’s usage pattern. Finally, appropriate campaign is created automatically for targeted potential churners and successfully managed to achieve the retention accuracy up to 88%.
Future work is mainly intended towards using the fuzzy based feature selection methods i.e. fuzzy rough subset, to see the effect of fuzzy feature selection on classifier’s prediction accuracy. Moreover, we plan to do a comparative analysis of prediction model building time with respect to different classifiers in order to assist telecom analysts to pick a classifier which not only gives accurate results in terms of AUC but also scales well with high dimension and large volume of call records data.
References
Cite this article
TY  - JOUR
AU  - Muhammad Azeem
AU  - Muhammad Usman
PY  - 2018
DA  - 2018/01/01
TI  - A fuzzy based churn prediction and retention model for prepaid customers in telecom industry
JO  - International Journal of Computational Intelligence Systems
SP  - 66
EP  - 78
VL  - 11
IS  - 1
SN  - 1875-6883
UR  - https://doi.org/10.2991/ijcis.11.1.6
DO  - 10.2991/ijcis.11.1.6
ID  - Azeem2018
ER  -