
Topology Modeling and Analysis of a Power Grid Network Using a Graph Database
- DOI
- 10.2991/ijcis.10.1.96How to use a DOI?
- Keywords
- Graph Database; Conditional Search; Shortest Path; Neo4j; Power Grid Network; Topological Analysis
- Abstract
We introduce a new method for storing, modeling, and analyzing power grid data. First, we present an architecture for building the network model for a power grid using the open source graph database Neo4j. Second, we design single- and multi-threading systems for initial energization analysis of the power grid network. We design the shortest path search function and conditional search function based on Neo4j. Finally, we compare the functionality and efficiency of our graph database with a traditional relational database in system initial energization analysis and the shortest path function problems on small to large data sets. The results demonstrate the efficiency and effectiveness of topology modeling and analysis using graph database for a power grid network.
- Copyright
- © 2017, the Authors. Published by Atlantis Press.
- Open Access
- This is an open access article under the CC BY-NC license (http://creativecommons.org/licences/by-nc/4.0/).
1. Introduction
In the big data era, power grid systems face new challenges and new development opportunities.1,2 Large data sets facilitate better resource management, more effective decision support systems and more reliable disaster warning. Computational intelligence is an enabling technology for the future development of power grid networks. However, it is challenging to build systems to intelligently manage and process the explosive growth in data volume and variety.3,4,5
Power grid data falls into three categories: structured data, semi-structured data and unstructured data. Structured data refers to information that has a high degree of organization and is readily searchable, such as tabular data in relational databases; semi-structured data, such as XML, only has a medium degree of organization; and unstructured data is disorganized and difficult to search6.
Currently, the volume of unstructured power grid data is growing exponentially, but most information storage systems for power grids still use relational databases. Relational databases are a poor fit for dynamic unstructured data due to data redundancy and performance degradation problems. Instead, NoSQL7 avoids these issues.
Lu et al.8 introduced Hadoop for electrical power monitoring. Hadoop is a column family technology based on NoSQL which allows distributed processing of big data. Hadoop is only used to store data that can be decomposed into the key-value model, and does not provide efficient native support to analyze structure relationships between objects. Consequently, Hadoop is not as useful for analyzing the network topology of power system, where we are especially interested in the relationships between nodes.
Considering the dynamic nature of the data and complex data relationships, graph database is a logical choice for data analytics. In this paper, we explore the open source graph database Neo4j9 and its application in power grid network modeling and analysis. We design and implement functions to compute initial energization, shortest path and conditional search using Neo4j. Finally, we compare our graph database approach to a relational one.
2. Related work
2.1. Relational Databases
Relational databases organize data into tables10 and model data relationships using key constraints and other constraints. PostgreSQL 11 is the most advanced open source database server. It can handle large volume of data, including data storage, rapid data retrieval and complex data analysis.
Relational databases are highly inefficient at describing and traversing complex connections and relationships. Usually several tables must be joined to extract multiple relationships among entities. With the increasing complexity and heterogeneity of relationships in the real world, the number of joining tables in relational databases increases rapidly and unsustainably. Complex relational databases also have high maintenance costs and are difficult to evolve to continuously changing business needs.
2.2. NoSQL
Most NoSQL databases, whether key-value-, document-, or column-oriented, store sets of disconnected documents/values/columns12. This makes it difficult to use them for connected data graphs. NoSQL is suitable for simple structured big data instead of data with plentiful properties and labels. If we add relationships to NoSQL data, aggregate joining operation are needed at the application level, which is prohibitively expensive for large data volumes.
2.3. Graph databases
With the increasing integration of components, the structure and characteristics of the power grid become more and more complicated. Many researchers have applied the complex network theory to study real networks,13–16 mainly focusing on small size power grid network computing. They have made great progress in tracking, detection and control. Graph database is useful for power grids because of the continuously increasing scale of the power grid, extremely wide distribution of power station and high-performance requirement of power grid needed.
Neo4j17, an open source graph database written in Java and Scala, implements generic graph models with full database characteristics such as ACID transaction compliance, cluster support, runtime failover, and query language. It denotes the different roles by nodes with multiple labels, and represents the relationships by paths between nodes. Due to the path-oriented data model, path-based operations in Neo4j are highly efficient and suitable for use in production scenarios.
3. Neo4j Architecture
3.1. Architecture
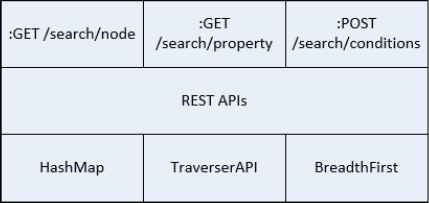
The main components of Neo4j’s architecture are its REST-based API, cache, transaction log, and record files (Fig. 1). Neo4j provides GET, POST, and PUT calls to discover service information. The Traverser API allows users to traverse the graph using callbacks. Users can define an approach to search a graph or subgraph using specific rules and algorithms, such as depth-first or breadth-first. Neo4j also exposes certain core APIs that can be directly used by JVM-based languages for working with graphs.
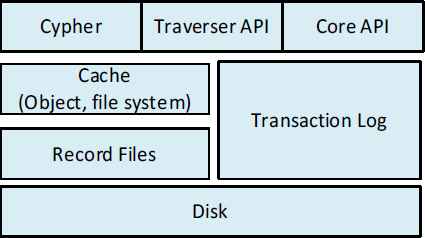
Neo4j Architecture
Caching is one of the most important components in Neo4j because it directly affects read and write performance. Neo4j provides two different types of caching layers. One is the file buffer cache which uses off-heap memory to cache data stored on disk. The other is an object cache. All writes and reads are performed through these caches to improve throughput. All writes are written to the caches and data in these caches are flushed to durable storage only when the logical logs are rotated. Neo4j also improves write performance by batching small writes.
Transaction logs maintain all the events and operations that happen over a Neo4j database, which is helpful in scenarios where the database needs to be recovered from a crash.
Record files are files that store information on nodes, relationships and properties. Neo4j recommends using ext4 or ZFS to support features such as flush (fsync, fdatasync) that help guarantee ACID properties.
3.2. Scalability and Redundancy
Neo4j high availability (HA) uses a master-slave cluster architecture18. As the Fig. 2 illustrates19, there are two parts to each Neo4j instance. One part is the database itself, the other is the cluster management component. The cluster management component continuously stays in sync with all instances in the cluster, keeping track of any instances joining or leaving. When a master election becomes necessary, the cluster management component ensures that a new master is consistently elected. The database layer manages the rest of the system.
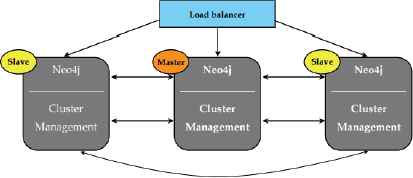
Neo4j Cluster Architecture
In a Neo4j HA cluster, the full graph is replicated to each instance in the cluster20. Regardless of the number of instances that fail, all the data is kept safe as long as one instance remains available. One single instance of Neo4j can house at most 34 billion nodes, 34 billion relationships, and 68 billion properties.
3.3. Cypher
Cypher is a declarative graph database query language21. It is simple and expressive, closely resembling the natural way of representing patterns in graphs through ASCII art diagrams.
In this paper, we mainly use the Traverser and Core API. Cypher is mainly used for the Shortest Path function.
4. System Design and Function Descriptions
4.1. Data Augmentation
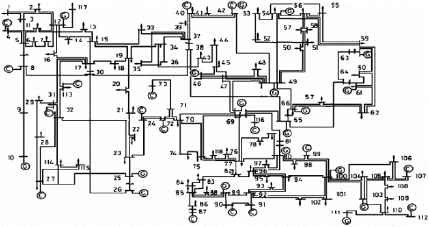
IEEE 118-bus system whose network data can be found in 22 is used for this study.
IEEE 118-bus system
The IEEE 118-bus system is expanded to 200 thousand, 2 million, 20 million and 200 million buses system respectively. Experiments are done separately to simulate the real power grid network environment.
Fig. 4 shows the process of expanding a single 118-bus system to 4n connected 118-bus system. In the expanded system, four 118-bus systems form a small highly connected unit and the expanded system consists of these units.
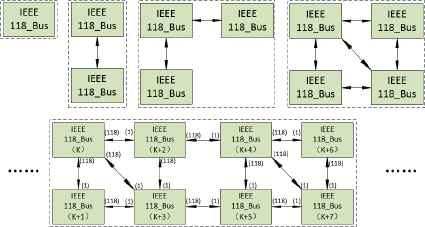
Expanding IEEE 118-bus system
4.2. Database Models
Currently most power grid network data are stored in relational database (RDBMS) with all information located in numerous complex correlated relational tables23.
For the graph database structure, only two tables are used to build database. One is node table, and the other is connection table. In the node table, one row represents one node as well as its labels. As for the connection table, each row represents a connection and its corresponding properties. Fig. 5 gives a simple demonstration of information stored in these two tables.
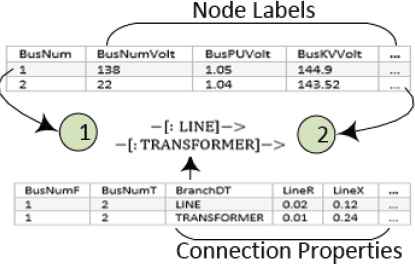
Topology of Graph
Table on the top is a node table with two nodes, and the table on the bottom is the connection table with connection information between node 1 and node 2. As it shows in the figure, two nodes can have multiple relationships with different properties.
4.3. Initial Energization of Power Grid Network
System initial energization analysis is the process for determining what equipment has power if power is provided to certain nodes. Each node represents a physical bus. The inputs to energization analysis are the primary energized nodes. The output is a list of all the nodes that are connected to these starting nodes, through one or more paths.
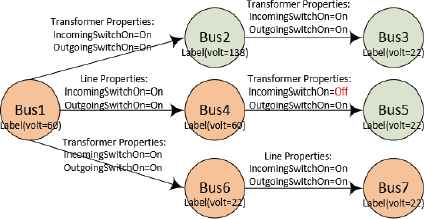
In Fig. 6, orange nodes are energized, and green ones are not energized. Voltage for each bus is shown in the figure. Connections are either lines or transformers, with “IncomingSwitchOn” properties and “OutgoingSwitchOn” properties. Transformer is the connection between two nodes with different voltage, and line is the connection between two nodes with the same voltage. Assuming that the starting node is Bus1, the output energized nodes should be nodes {Bus4, Bus6, Bus7}. Other nodes {Bus2, Bus3, Bus5} are un-energized in that voltage of Bus2 is lower than that of Bus1 (affecting Bus2 and Bus3) or connection properties indicate either “IncomingSwithOn” or “OutcomingWitchOn” is off (affect Bus5).
Initial Energization Process
4.4. The Shortest Path Search
Breadth-First24 search is the foundation of numerous classical graph algorithms, including Dijkstra’s algorithm25. Dijkstra is used to find the shortest path between two nodes in a graph. It is very efficient because it computes only the lengths of a relatively small subset of the possible paths through the graph. When we have solved a node, the shortest path from starting node is then known, allowing all subsequent paths to safely build.
The A* algorithm26 improves the classic Dijkstra algorithm with a best-first search and distance-plus-cost heuristic function, that finds the least-cost path from an initial node to a goal node. A* is particularly good for path finding and shortest path search over the graph. Neo4j provides APIs of A*.
4.5. Conditional Topological Search Analysis
The goal of system conditional topological search is to store the entire topological structure into graph database and perform conditional topological search.
The input of this model consists of a specified node (bus number), the path number to be traversed, and some termination conditions.
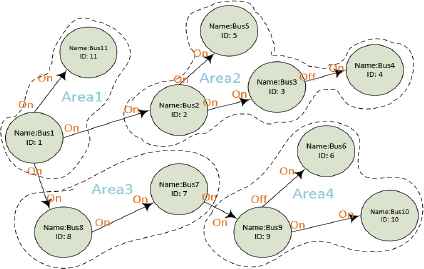
Common termination conditions include arriving at the input node, reaching the node with status “stop” or going through a connection with either “IncomingSwithOn” or “OutgoingWitchOn” off. The search will also be stopped when reaching to a bus in some specific area. In real power grid networks, some buses belong to a specific power station, such as central stations used for generating electricity. When reaching such buses, the search will be stopped.
Fig. 7 shows the Conditional Topological Search structure. In the end, this process returns all the paths and corresponding nodes as result.
Conditional Topological Structure
5. Function Implementation based on Neo4j
5.1. Energization
5.1.1. Initial Energization
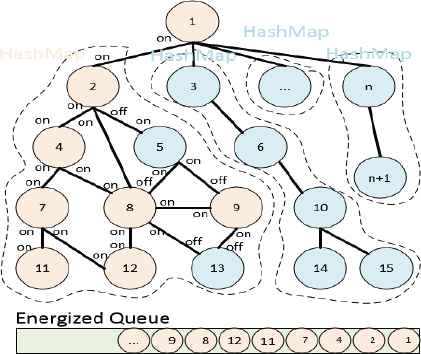
Initial energization uses one node as the starting node, then applies Breadth-First search to this node to find all the adjacent nodes which satisfy energized conditions (Sec 4.3). The subtree for each node adjacent to the starting node is stored in a HashMap. Thus, the graph is divided into the starting node and a group of HashMap.
In each HashMap, we use Depth-First search to check the properties of connection and labels of nodes (‘IncomingSwitchOn’, ‘OutgoingSwitchOn’ and voltage) between two buses (Nodes), then add satisfied energized buses to the Energized Queue.
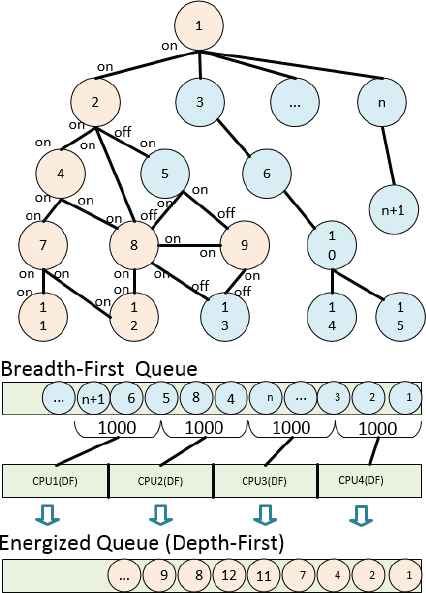
Fig. 8 shows the architecture of initial energization of power grid network. Before energizing a bus (node), we need to check whether this bus is in the Energized Queue or not. If this bus is already in queue, then there will be an early stop. This implementation is effective when testing on 10,000 nodes. However, when testing on 20,000,000 or more nodes, the search takes a long time. Because real-world power grid networks have over 200 million nodes, we must implement a more efficient initial energization approach.
Initial Energization of Power Grid Network
5.1.2. Multi-threading platform
In the former initial energization model (Sec 5.1.1), CPU occupancy is up to 90%, therefore, further improvement of the efficiency requires multicore processing. A multiple worker framework, which depends on the CPU number, is set up to boost the efficiency. Breadth-First search method is used to put all the buses into Breadth-First Queue. All the workers will automatic pull buses from Breadth-First Queue (each time 1000 buses). If the bus is not in the Energized Queue, then use Depth-First search to energized the remaining buses. After that, insert the bus into the Energized Queue as shown in Fig. 9.
Initial Energization on multi-threading
Depending on the data size, multi-threading or single thread searching can be implemented accordingly. Multi-threading is more suitable for data size over 20,000,000.
5.2. Shortest Path Search
Neo4j provides the shortest path function based on A* algorithm. We preprocess the power grid data and implement the shortest path query based on Cypher. For comparison, Dijkstra’s shortest path algorithm is also performed based on PostgreSQL using Java.
5.3. Conditional Search
Traversal API provided by Neo4j implements BreadthFirst function to go through all graph database. We also design a HashMap function which can save nodes from Traversal API. In addition, a REST API environment is get up to obtain all the nodes from HashMap. Fig. 10 demonstrates the data flow of the model.
Data Flow on Conditional Search
REST APIs provide GET and POST function for conditional search. These functions can be called either from PowerShell or directly from Neo4j client.
6. Experimental Results
REST request is a simple HTTP request. There is no additional overhead. Therefore, in all the tests of the experiment conditions, REST API is used.
6.1. Test Environment
Hardware environment: CPU Intel(R) Core(TM) i5-4460 (3.20GHz), 4 Cores, installed memory (RAM) 12.0 GB. Software environment: using the Neo4j community version 3.1.0, Windows PowerShell version 5.0, Apache Maven 3.3.9, Java version 1.8.0_101, PostgreSQL version 9.5.
The basic model of test data is shown in Fig. 5. There is only one type of node: Bus with 20 labels, whereas two types of relations are presented: Line and Transformer, each with 20 properties.
6.2. Test Method
There are four different data sizes and two functions in test scenario 1, as shown in table 1.
| Data 1 | 200,000 nodes, 260,000 relationships, 4,660,000 properties, 180 MB database disk usage |
| Data 2 | 2,000,000 nodes, 2,600,000 relationships, 46,600,000 properties, 1.28 GB database disk usage |
| Data 3 | 20,000,000 nodes, 26,000,000 relationships, 466,000,000 properties, 12.4GB database disk usage |
| Data 4 | 200,000,000 nodes, 260,000,000 relationships, 4,660,000,000 properties, 123GB database disk usage |
| Energization | Initial Energization Analysis |
| Shortest Path | Find the shortest path from Bus A to Bus B |
Test Scenario 1
As shown in Table 2, three conditional searches are performed in the test scenario 2.
| Data | 150,000 nodes, 399,944 relationships, 1,150,000 properties, 92 MB database disk usage |
| Conditional Search | A: find a node (Bus) X by label |
| B: find a specific node by id | |
| C: find a set of nodes that has a property equal to a value (Area) |
Test Scenario 2
All queries above have been executed 10 times where the first time is ignored since it warms up Neo4j caches. The values are averaged over 10 executions.
There are 3 different sizes of dataset and 2 functions running on Neo4j and PostgreSQL in these process, as shown in table 3.
| Data 2 | 2,000,000 nodes, 2,600,000 relationships, 46,600,000 properties, 1.28 GB database disk usage |
| Data 3 | 20,000,000 nodes, 26,000,000 relationships, 466,000,000 properties, 12.4GB database disk usage |
| Data 4 | 200,000,000 nodes, 260,000,000 relationships, 4,660,000,000 properties, 123GB database disk usage |
| Energization | Neo4j vs Postgresql |
| Shortest Path | Neo4j vs Postgresql |
Test Scenario 3
All queries above have been executed 10 times. Each query time including the data warm up on Neo4j and PostgreSQL. The data warm up time is included since Read I/O (read from DB to caches) is also one of features in these databases. The values are average over 10 executions.
6.3. Test Results
6.3.1. Test Cases
Test case 1: Fig. 11 and Fig. 12 show the running time comparison for the test on Neo4j: All datasets (data1-4) and energization. The time unit is milliseconds, and the results are shown in Fig. 11 and Fig. 12.
Test case 2: Fig. 13 is the results for Data and Conditional Search in Table 2. Running time is recorded in milliseconds. The horizontal axis shows the different conditions and conditions combination.
Test case 3: Fig. 14 and Fig. 15 present the testing results for Neo4j vs PostgreSQL Energization test in Table 3. Vertical axis represents time in milliseconds. The horizontal axis stands for results for different datasets. The blue bar is the time consumption for Neo4j, and the orange is runtime from PostgreSQL. Fig. 14 shows the single thread results, and Fig. 15 presents the 4-thread results of different databases.
Test case 4: Fig. 16 and Fig. 17 demonstrate the result of Shortest Path test for Neo4j vs PostgreSQL. The horizontal axis in the plot represents different search conditions on datasets with different sizes.
Energization with Neo4j (small data size)
Energization with Neo4j (large data size)
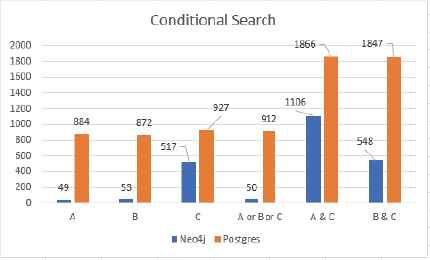
Conditional Search Results
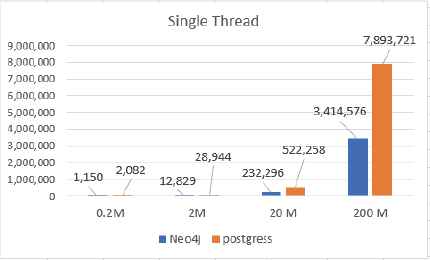
Neo4j vs PostgreSQL (Energization)
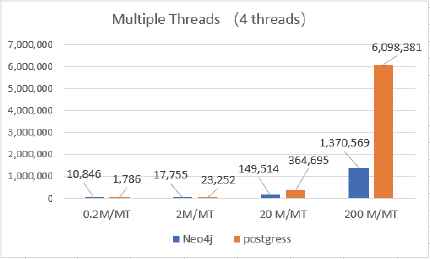
Neo4j vs PostgreSQL (Energization)
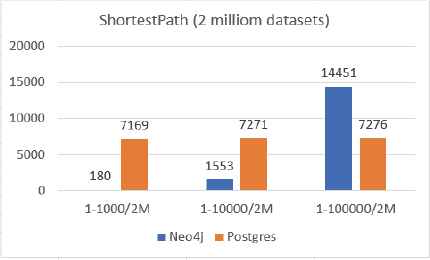
Neo4j vs PostgreSQL (the Shortest Path, 2 million dataset)
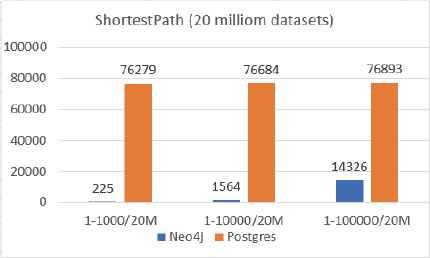
Neo4j vs PostgreSQL (the Shortest Path, 20 million datasets)
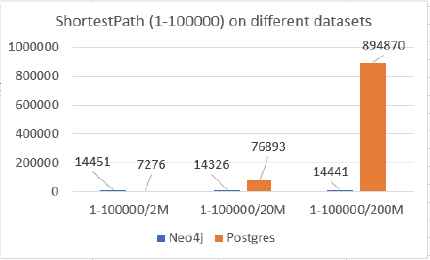
Fig. 18 shows the testing results of conditional search on dataset with different sizes. The blue bar and orange bar present the time consumption on Neo4j and PostgreSQL respectively.
Neo4j vs PostgreSQL (the Shortest Path)
6.3.2. Impact of dataset size on energization performance
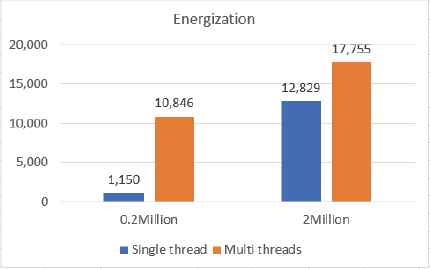
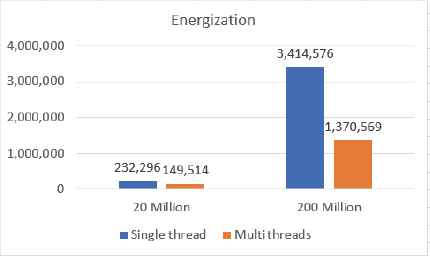
The impact of data sizes is fully reflected on initial energization analysis. Comparing Fig. 11 and Fig. 12, we can see that if data size is small (e.g. around 0.2 million), the energization performance of these two methods (single process, blue color or multiple threads, orange color) is independent of the amount of data.
6.3.3. Impact of multiple threads on energization performance
In the initial energization analysis, comparing the orange bar and blue bar in Fig. 11 and Fig. 12, we can see that if the value of data size is relatively small, the performance of single process is better than that of multiples threads. However, if the data size is large (e.g. 200 million), implementing multiple threads is a better choice.
6.3.4. Impact of query complexity to query performance
Fig. 13 demonstrates the impact of multiple conditions on the query performance. If combining these condition queries with ‘or’, the performance is determined by the quickest search condition. If we combine these condition queries with ‘and’, the running time is almost the same as the sum of these queries’ running time.
6.3.5. Energization performance on different datasets (PostgreSQL vs Neo4j)
Fig. 14 shows the energization performance using single thread on Neo4j and PostgreSQL. There is not much fluctuation of running time on relative small datasets (datasets less than 20 million). However, when implemented on large scale data (more than 200 million), the performance of Neo4j is much better than that of PostgreSQL. The reason is that Neo4j provides Traversal API and Core API which can access memory with high affinity and usually faster than any SQL-based query languages, including Cypher.
Fig. 15 shows the energization performance using multiple threads (4 cores) on Neo4j and PostgreSQL. The results indicate that running time of small dataset has no big difference on these two databases. When the dataset has more than 200 million nodes, multiple threads in Neo4j performs better than in PostgreSQL. Consequently, multithread communication on Core API in Neo4j is more efficient than in PostgreSQL.
6.3.6. Shortest Path performance on different datasets (PostgreSQL vs Neo4j)
In PostgreSQL database, the shortest path is computed with Dijkstra’s algorithm, and it is compared with the implementation of Dijkstra’s algorithm in Neo4j. From the results shown in Fig. 16 and Fig. 17, it can be concluded that Neo4j’s shortest path running time depends on the query criteria. The more results of data, the longer the running time; the PostgreSQL’s shortest path performance depends on the size of database. The larger size, the longer running time. Fig. 18 provides more evidence to the above claims. We try to find the shortest path from node 1 to node 100,000 on different sizes of database. Neo4j uses almost the same time on different sizes of database which is totally different from the PostgreSQL’s results. It demonstrates that when PostgreSQL attempts to handle data with large amount of relations among nodes, the performance degrades. Therefore, Neo4j is a better choice for the big data with complex relations.
7. Conclusion
Graph databases can achieve significant performance improvements for complex data relations. We build a graph database structure for power grid network based on Neo4j, and develop single and multithreading systems for initial energization analysis of power grid network. The experiments demonstrate that energy network analysis using Neo4j has better performance than using PostgreSQL. In addition, we implement a shortest path search function based on Neo4j’s Cypher and conditional search function based on Neo4j’s Traversal API. Experiments show that for more than 20 million nodes, using multiple threads is much faster than using single thread for initial energization analysis. However, in small data sets, multi-threading introduces extra communication time costs, leading to longer runtimes than using single thread. It is also shown in the experiments that with data sets of 200 million nodes, shortest path performs much better in Neo4j than in PostgreSQL. Our test results demonstrate the effectiveness and efficiency of using a graph database for power grid network modeling and analysis.
Acknowledgment
This work was supported by State Grid Corporation technology project SGRIJSKJ(2016)800.
Reference
Cite this article
TY  - JOUR
AU  - Bowen Kan
AU  - Wendong Zhu
AU  - Guangyi Liu
AU  - Xi Chen
AU  - Di Shi
AU  - Weiqing Yu
PY  - 2017
DA  - 2017/09/14
TI  - Topology Modeling and Analysis of a Power Grid Network Using a Graph Database
JO  - International Journal of Computational Intelligence Systems
SP  - 1355
EP  - 1363
VL  - 10
IS  - 1
SN  - 1875-6883
UR  - https://doi.org/10.2991/ijcis.10.1.96
DO  - 10.2991/ijcis.10.1.96
ID  - Kan2017
ER  -