
Novel Approach to Tourism Analysis with Multiple Outcome Capability Using Rough Set Theory
- DOI
- 10.1080/18756891.2016.1256574How to use a DOI?
- Keywords
- Rough Sets; Tourism; Customer Satisfaction; Decision Making; Rule Induction
- Abstract
To explore the relationship between characteristics and decision-making outcomes of the tourist is critical to keep competitive tourism business. In investigation of tourism development, most of the existing studies lack of a systematic approach to analyze qualitative data. Although the traditional Rough Set (RS) based approach is an excellent classification method in qualitative modeling, but it is can’t deal with the case of multiple outcomes, which is a common situation in tourism. Consequently, the Multiple Outcome Reduct Generation (MORG) and Multiple Outcome Rule Extraction (MORE) approaches based on RS to handle multiple outcomes are proposed. This study proposes a ranking based approach to induct meaningful reducts and ensure the strength and robustness of decision rules, which helps decision makers understand tourist’s characteristics in a tourism case.
- Copyright
- © 2016. the authors. Co-published by Atlantis Press and Taylor & Francis
- Open Access
- This is an open access article under the CC BY-NC license (http://creativecommons.org/licences/by-nc/4.0/).
1. Introduction
As tourism becomes the largest industry in the world, its impact on the global economy is widely recognized. To keep business competitive, one of the key and preliminary elements in the planning process is to study characteristics of customers in order to understand the relationship between tourist tasks and decision ( Zalatan, 1998). That is to customize their product offerings and strengthen marketing policies to an appropriate degree in order to respond to the shifting importance and growing complexity of customer choice. To date, most of the existing causal studies of tourism research apply quantitative models that use mathematical functions. These models are established on the basis of many statistical assumptions and limitations. However, it is unrealistic to assume that all tourism data are numeric. The tourism industry often possesses numerous qualitative data in flight scheduling databases, retail store employee files, and airline reservation repositories ( Law & Au, 2000). The qualitative nature of the data makes them difficult to analyze by standard statistical techniques.
The rough set approach has been developed as an interesting technique for discovering knowledge from data (Pawlak, 1991a). It is suitable for processing qualitative information that is difficult to be analyzed by standard statistical techniques ( Heckerman, Mannila, Pregibon, & Uthurusamy, 1997). Moreover, it provides an effective means for analysis of data by synthesizing or constructing approximations (upper and lower) of set concepts from the acquired data ( Pal & Mitra, 2003). One of the reasons for using the rough set as an approach to mine data is due to the fact that the qualitative nature of the data (e.g., gender and vegetarian) being analyzed makes it difficult for applying standard statistical techniques ( Heckerman et al., 1997; Simoudis, Han & Fayyad,1996).
Traditional rough set theory has no ability to consider multiple outcomes. It’s hard to analyze a data set with more than two outcomes, only then do segments and reduct and provide one single consideration for each outcome. Therefore, this study proposes an approach that applies the rough sets theory for solving multiple outcome situations. Moreover, the direct use of the result, provided by the reduct generation procedure, may lead to many reducts that contain features that are not meaningful. In order to identify meaningful reducts and ensure the strength and stability of rules, this study proposes a ranking based approach to induct and apply each reduct to the test data set corresponding to the training set and collect information regarding the support and accuracy of the reduct in new data for rule extraction.
The objective of this study is to propose a novel reduct extraction approach for multiple outcomes in a tourism case. The aim is to understand the preferences of the customers there for exploring relationship between tourist tasks and decision. The remaining part of this study is organized as follows: Section 2 presents literature review related to tourism and several rough set based approaches. Section 3 develops the solution approach to operate multi-outcomes, while the tourism related case study and computation results based on the proposed approach are depicted in Section 4. Finally, Section 5 concludes the findings and provides suggestions for future research.
2. Literature Review
In this section, literature review related to tourism and rough set based approaches is presented.
2.1 Tourism
Nowadays tremendous growth of tourism as a field of study, coupled with increasing demand for tourism education has led to a heightened focus on research and publications ( Jogaratnam, Chon, McCleary, Mena, & Yoo, 2005). This field has seen the development of numerous associations, journals and research consortia, and is linked to groups of researchers in other domains such as business and information technology ( Racherla & Hu, 2010). Research topics in the tourism domain are various, for example, sustainability tourism ( Divino & McAleer, 2009; Miller &Twining-Ward, 2006), marketing ( Butcher, 2010; Frochot, 2010), data mining and knowledge discovering (Buultjens, Brereton, Memmott, Reser, Thomson & O’Rourke, 2010; Liao, Chen & Deng, 2010), quantitative approach ( Enright & Newton, 2004; Jang, 2004) such as rules induction ( Au & Law, 2002; Cardoso, Themido & Pires, 1999).
Walle (1997) argued that formal scientific methods are needed in tourism research. This would ensure generality of the empirical outcomes as well as maintain the quality and credibility of research findings. Ever since the introduction of formal statistical techniques to the tourism field, researchers have been focus on the application of mathematical functions to model the quantitative relationships between some phenomena in tourism data. At present, the quantity of tourism demanded modeling techniques consist primarily of time series model ( Nelson, Dickey & Smith, 2009), needs-functions model to consider more fully the activities that occur in different settings from the market through to the destination and from one sector to another. ( Pearce, 2008), dynamic model (Garín-Muñoz & Montero-Martín, 2007), Bayesian model ( Wang, Hsiehb, Yehc & Tsai, 2004), and the use of statistical techniques to model the phenomena of numeric tourism oriented data in mathematical functions has achieved certain degree of success in relationship modeling and forecasting ( Witt & Witt, 1995). Moreover, most of the existing studies on tourism demand forecasting apply economic models that use mathematical functions, which require many statistical assumptions and limitations ( Law, Goh, & Pine, 2004).
However, it is unrealistic to assume that all tourism data are numeric. The tourism industry often possesses numerous qualitative data in flight scheduling databases, retail store employee files, and airline reservation repositories ( Law & Au, 2000). The qualitative nature of the data makes them difficult to analyze by standard statistical techniques. In addition, due to quick changing of information technology (IT) today, some techniques (i.e. rough sets and data mining tools) have become important research trends to both practitioners and academicians ( Chen & Cheng, 2009). One of the solutions to resolve the issues is the rough set approach. A rough set approach can capture useful information from a set of mixed data and output this information in the form of decision rules ( Pawlak, 1984). This makes the rough set approach an excellent rule induction method in qualitative modeling. Therefore, this study proposed a new approach that applies the rough sets theory. Having discussed Information System (IS), information reduction and decision rules induction in the next section.
2.2 Rough Set Approach
The Rough Set Model (RSM) was proposed by Pawlak in the early 1980s ( Pawlak, 1982) as a powerful mathematical tool to deal with imprecise or vague concepts. It allows users to classify objects into sets of equivalent members based on their attributes ( Dasgupta, 1988). In recent years, a rapid growth of interest in rough set theory and its applications are witnessed ( Swiniarski & Skowron, 2003) through demonstrating that rough set model is applicable to a wide range of practical problems pertaining to supplier selection ( Bai & Sarkis, 2010), investment portfolios ( Shyng, Wang, Tzeng & Wu, 2010), marketing ( Cheng, Chen, & Lin, 2010), EEG analysis ( Ningler, Stockmanns, Schneider, Kochs & Kochs 2009), multiple criteria classification ( Zhang, Shi & Gao, 2009; Dembczyński, Greco & Słowiński, 2009), expert system ( Shao, Chu, Qiu, Gao & Yan,, 2009), time series analysis ( Yao & Herbert, 2009; Teoh, Cheng, Chu & Chen, 2008; Sarkar, 2006), image compression & segmentation ( Mushrif & Ray, 2008; Petrosino & Ferone, 2008), boolean reasoning ( Pawlak & Skowron, 2007).
The rough set theory offers a large collection of tools for knowledge discovery from data. Many of these methods, like decision rule induction, classifier construction, discretization, decision tree construction, and representative association rule induction, are based on computing the most relevant sets of attributes called reducts ( Nguyen, 2003). A reduct is defined as a minimal sufficient subset of a set of attributes, which has the same ability to discern concepts as when the full set of attributes is used (Pawlak, 1991a; Ziarko, 1994). Basically, the reducts represent necessary condition attributes in decision making. Furthermore, a subset of the attributes has more than one reduct; hence the simplification of reducs (called reduct rues) is required to extract significant rules (called decision rules) does not yield unique results. Therefore, a rough et based approach ofen contains two parts: Rduct generaion and decision rule extraction.
2.2.1 Reduct Generation
According to the rough set theory, I = {U, A} is an information system, where U is a finite set of objects and A is a finite set of attributes. With every attribute a ∈ A, a set of its values Va is associated. Assume A = C ∪ D, B ⊂ C, where B is a subset of C; the positive region POSB(D) = {x ∈ U: [x]B ⊂ D} can be defined. The positive region POSB(D) includes all objects in U which can be classified into classes of D, in the knowledge B. The degree of dependency between B and D can be defined as:
In order to find dispensable attributes, an examination of each attribute of the object is required. It might also have to drop one attribute at a time and check whether the intersection of the remaining attributes is still included in the decision attribute. In most case, if one or two features in a reduct formed, the procedure stops because too many features to form a reduct rule will reduce advantage of the rough set theory. The reduct rule would be useless without finding critical features. However, the case of multiple outcomes fairly common in the real world hasn’t been seriously considered in traditional rough set theory. Bai and Sarkis (2010) define the data set with ten conditional attributes and two decision attributes for the illustrative application.
The reduct generation procedure is required for improvement and evolving into a powerful tool for decision makers and researchers, especially in complex decision environments associated with multiple outcomes. For example, the multiple outcomes table in Table 1 represents the final classifications. Objects 1 and 2 have the same value of features but difference outcomes ({X1} = [R, 3, 0]o1,o2,o3 ≠ {X2} = [A, 3, 0]o1,o2,o3, and so do objects 3 and 4 in Table 1. After performing the reduct search procedure, no other reduct was generated.
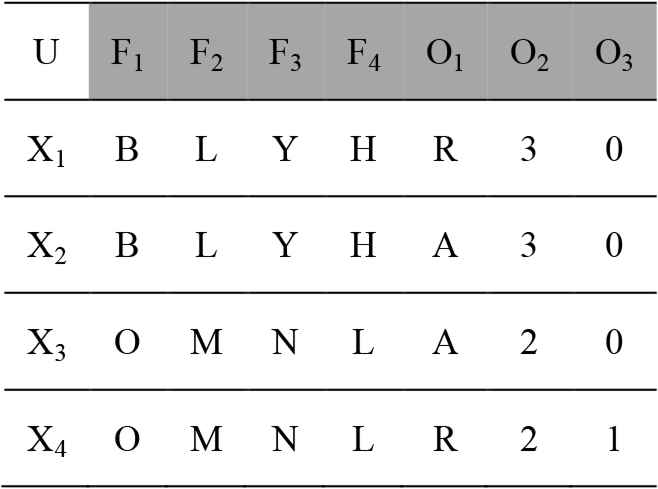
The multiple outcomes.
2.2.2 Rule Induction
The direct use of the results provided by the reduct generation procedure may lead to many reducts that contain features that are not meaningful. And another challenge of rough set based rule induction is the fact that finding all reducts is NP-hard ( Ziarko, 1990). Law and Au (2000) present a decision rules induction approach that incorporates rough set theory to model the relations that exist among a set of mixed numeric and non-numeric tourism shopping data. The decision rules induction approach was formed a decision rule is in the form of IF_condition(s)_THEN_decision(s). But without consideration of threshold (e.g., a strength index), it may generate a few redundant rules Furthermore, the relationship among the reducts is not explored. In order to identify meaningful reducts and ensure the strength and stability of rules, a comparison between the rules and how they react with data must be carried out. In previous studies, a rule extraction algorithm ( Tseng and Huang 2007) has been developed for discovering preference-based rules according to the reducts which contain the maximum strength index, and relatively small number of induced rules with reasonable domain interpretation. However, the desired reducts may not be unique. Extension of the strength index is required for improvement.
In addition, the RS approach has to encode outcomes of decision table to distinguish the individual outcome features, for example, the outcome (1, 2) is different from (1, 3), but both are included in (1, *). It requires a coding tool to represent the hierarchy of the outcomes. From those points of view, this study proposed a multiple outcome reduct generation algorithm and a multiple outcome rule extract algorithm based on rough set theory to generated multiple outcome rules.
Through literature review, the desires to developing the multiple outcome reduct generation algorithm and multiple outcome rule extraction algorithm based rough set are as follows:
- 1.
The tourism industry often possesses numerous qualitative data in flight scheduling databases, retail store employee files, and airline reservation repositories (Law & Au, 2000). The qualitative nature of the data makes them difficult to analyze by standard statistical techniques. One of the solutions to resolve the issues is the rough set approach, which can capture useful information from a set of mixed data and output this information in the form of decision rules (Pawlak, 1984).
- 2.
Although numerous maching learning approaches have considered multiple outcomes (Richard et al., 2013; Thomas et al., 2008), unfortunately most rough set approaches do not consider the issue of multiple outcomes. For example, if there is a dataset withthree features and two outcomes, the traditional reduct generation procedure has to be performed twice for each outcome. In addition, a decision rule always consists of a single outcome. It is not easy to understand the commonality of rules in those two outcomes;
Therefore, next, the multiple outcomes problem is defined.
3. Mutiple Outcome Problem
In this section, a multiple outcome table for the representation of the relationship between condition features and outcome features is used. Alternatively, a feature and an attribute are exchanable due to their similarity. In Table 2, the element (eij) denotes the value of feature (Fj) (j = 1 to m) that an object (tuple) (Xi) (i = 1 to n) contains, while Oj (j = 1 to p) depicts the different outcome set of the corresponding tuple. In addition, the number of values is incorporated in this table.
| Condition features (Fj) | Outcomes features (Op) | ||||||||
|---|---|---|---|---|---|---|---|---|---|
| Object (Xi) | F1 | F2 | … | Fm | Outcome(Oj) | O1 | O2 | … | Op |
| 1 | e11 | e12 | … | e1m | 1 | o11 | o12 | … | o1p |
| 2 | e21 | e22 | … | e2m | 2 | o21 | o22 | … | o2p |
| ⋮ | ⋮ | ⋮ | ⋮ | ⋮ | ⋮ | ⋮ | ⋮ | ⋮ | ⋮ |
| n | en1 | en2 | … | enm | n | oq1 | oq2 | … | oqp |
Fundamental structure of a multiple outcome table.
In this study, the RS multiple outcomes problem is defined as:
Given
- •
An information set I = (U, A), where U is a finite set of objects and A is a finite set of features. The elements of A are called condition features.
- •
A decision table I = (U, A ∪{d1, d2,…, dn}), where any di in {d1, d2,…, dn} ∉ A is a distinguished outcome feature.
Objective
Minimize the subset of U, in which the specific outcome feature of decision rules (ri) has the highest Strong Index (SI) and the maximal level number.
Subject to the following constraints:
- 1.
A = C ∪ D,
- 2.
B ⊂ C
- 3.
POSB(D) = {x ∈ U: [x]B ⊂ D}
- 4.
For any a ∈ B of C, K (B, D) = K (C, D), and K (B, D) ≠ K(B−{a}, D)
POSB(D) is the positive region and includes all objects in U which can be classified into classes of D, in the knowledge B.
Attribute a ∈ A, set of its values
4. Solution Approach
The solution approach includes two algorithms: The Multiple Outcome Reduct Generation (MORG) algorithm and Multiple Outcome Rule Extraction (MORE) algorithm.
4.1 The MORG Algorithm
The MORG algorithm generates reducts with multiple outcomes. All steps are described as follows: (1) Input training data set and initialize each object in the beginning; (2) Generate interaction set and combination set of outcomes; (3) Check all subsets of value sets of outcomes, if the interaction set is a subset of value set of outcomes, and then generate combination set of features; (4) Check all subsets of value sets of outcomes, if the value set of features is a subset of value set of outcomes, and then output the result into reduct table; (5) Stop the multiple outcome reduct generation procedure and repeat the above steps until running out all objects. Figure 1 illustrates the step by step instructions to describe the MORG algorithm.
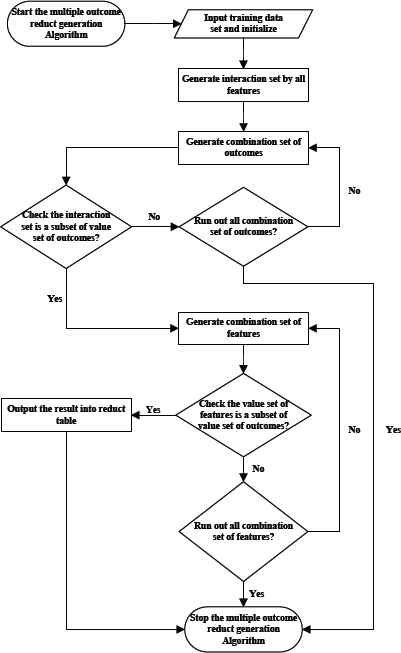
The flow chart to describe the MORG algorithm.
- Ta:
The training data set used for training rules.
- Treduct:
The ad hoc data set used for store the results.
- Out_N:
The total number of outcomes.
- Fea_N:
The total number of features.
- Fi,j:
The objects where each F,j feature contains Fi,j.
- Oi,p:
The objects where each O,p outcome contains Oi,p.
- F_Interaction():
A generation features interaction set function. E.g., F_Interaction(i) = {[Fi,1]}∩ {[Fi,2]} ∩ {[Fi,3]} ∩ … ∩ {[Fi,final]} = [Fi] ∩ Ta.
- F_Combination():
A generation combination set function. E.g., F_Combination(3, 2) can generate a set of two possible from a set {1, 2, 3}, and the result is {12, 13, 23}, i.e., F_Combination(3, 2) is equal to
The Multiple Outcomes Reduct Generation (MORG) Procedure
Input: Ta.
Output: Treduct.
Step 1. Initialization: List all objects in Ta.
Step 2. Generate the reducts for each object.
Step 2.1. for i = 1 to n do
Loop:
Step 2.2. Set new_Out_Set = ∅
Step 2.3. Set mini_Set = F_Interaction(i)
Step 2.4. for out = Out_N to 1
Step 2.5. Set comb_ Out_Set = F_Combination(Out_N ,out)
Step 2.6. for each p in comb_ Out_Set
Step 2.7. if mini_Set ⊂ {[O,p] ∩ [Oi,p]} then Add p into new_Out_Set
endfor
Step 2.8. if new_Out_Set = ∅ then Go to Step2.4
Step 2.9. for fea = 1 to Fea_N − 1
Step 2.10. Set comb_ Fea_Set = F_Combination(Fea_N ,fea)
Step 2.11. for each p in new_Out_Set
Step 2.12. for each j in comb_Fea_Set
Step 2.13. if {[F,j] ∩ [Fi,j]} ⊂ {[O,p] ∩ [Oi,p]}
Step 2.14. then the reducts for Xi is formed
Step 2.15. else the reducts for Xi is not formed
endfor
endfor
if any reducts for Xi is formed
then break Loop
else the reducts for Xi is not formed
endfor
endfor
endfor
Step 3. Termination: Stop and output the results into Treduct.
4.2 The MORE Algorithm
The steps in the MORE algorithm include: (1) Input training data set, (2) Test data set, (3) Reduct table, (4) Rule table, and initialization in the beginning. Moreover, calculation of four indexes (support and accuracy of the training data set, support and accuracy of the test data set) into the information table for each reduct is required. For each reduct, it is required to calculate four indexes. If any values of the index is lower than the threshold value determined by the expert, then remove the reduct from information table. The decision maker requires to sort the rank of four indexes and the obtained ranking table id. Figure 2 presents the step by step procedure to describe the MORE algorithm. In order to determine which rules are the strongest ones, comparison between the rules and how they react with data must be made ( Yao & Herbert, 2009). Individual rules are ranked according to their strengthes (support and accuracy) and stability, which refers to the changes to support and accuracy from the training data set to testing data set. An overall rank can be determined based on the support and accuracy rankings.

The flow chart of the MORE algorithm.
- Tv:
The test data set used for validate rules.
- Tinfo:
Information table (There are six columns in this table: support and accuracy of training data set, support and accuracy of test set, change in support (%) and change in accuracy (%).).
- TRank:
Ranking table (There are five columns in this table: total support, average accuracy, change in support, change in accuracy and final rank for each rule.).
- F_CompareF():
A function is used for comparing the value of features of a particular rule with value of features of Ta and Tv.
- F_CompareO():
A function is used for comparing the value of outcomes of a particular rule with value of outcomes of Ta and Tv.
- F_Threshold():
A function is used for extracting the desired rule.
- Sup_N:
The total mach number of specific rules in the data set.
- Acc_N:
The total mach number of specific rules in the data set divided by the total mach number of features of specific rule.
The Multiple Outcome Rule Extract (MORE) Procedure
Input: Ta,Tv, Treduct and Trule.
Output: Tinfo and TRank.
Step 1. Initialization: List all reduct from Treduct and combine duplicate rule into Trule.
Step 2. Calculate four indices value into Tinfo for each reduct.
Step 2.1. for each row i in Trule
Step 2.2. Set Sup_N = 0 and Acc_N = 0
Step 2.3. for each row j in (Ta) & (Tv)
Step 2.4. if F_CompareF(i, j) = 1
Step 2.5. Set Sup_N += number of objects of row j
Step 2.6. if F_CompareO(i, j) = 1
Step 2.7. Set Acc_N += number of objects of row j
end for
Step 2.8. Set Support = Sup_N / total no. of objects. & Accuracy = Sup_N / Acc_N
Step 2.9. Assign the values of support and accuracy into Tinfo end for
Step 2.10.Calculator change in support (%) and change in accuracy (%) for each rule.
Step 3. Extract the rule by F_Threshold().
Step 4. Sort the rank of four indices and Finalize the ranking from Tinfo into TRank.
Step 5. Output Tinfo and TRank.
5. Case study
The objective of this case study is to extract the rules to reveal the tourist’s characteristics. The experiment results focus on the use of rules to classify the different features of the tourists and find out what they really care about; to help the tourism service providers satisfy the tourists with the desired travel package.
Middelkoop (2004) argues that tourists do not necessarily maximize their utility in selecting a travel mode; rather, their choice behavior is context dependent. Given particular conditions related to their family, the environment, and other aspects of the tourist experience, they are assumed to use different heuristics. Taking a vacation involves a decision-making process which may be simple or complex. Therefore, to study characteristics of tourist and to understand the relationship between tourism and decision, it is required to induce decision rules through historical data sets. In short, different characteristics of a tourist might influence the decision-making. The characteristics of a tourist are such as household income, number of trips yearly, presence of children, tourist’s age, vegetarian, pet ownership, etc., all have a certain influence on the decision-making process ( Harcar, Spillan & Kucukemiroglu, 2005; Zalatan, 1998). Moreover, Zalatan (1998) segments tourism decision-making tasks into 17 categories (see Table 3). And in general, arranging transportation, selecting restaurants and accommodation, purchase insurance, choosing the destination, purchasing tickets, etc., are included in the tourist package deal. So six characteristics are used in features and six tasks are used in outcomes in this study. Tables 4 and 5 present the description and the domain range of each input feature and the final outcomes, respectively. Two data sets are used for validating the solution approach, a training data set (20 objects) and a testing data set (10 objects).
| 1. Initial Trip Tasks |
|
| 2. Financing Tasks |
|
| 3. Pre-departure Tasks |
|
| 4. Destination Tasks |
|
The tourism decision-making tasks list.
| No | Features name and domain | |||||
|---|---|---|---|---|---|---|
| F1a Household income |
F2b No. of trips |
F3 Number of kids |
F4 Age |
F5 Vegetarian |
F6 Pet ownership |
|
| 1 | < 100 (L) | < 1 (N) | < 1 (N) | < 25 (YO) | Yes (Y) | Yes (Y) |
| 2 | 100∼200 (M) | 1∼2 (L) | 1∼2 (L) | 25∼50 (MA) | No (N) | No (N) |
| 3 | > 200 (H) | 3∼4(M) | 3∼4(M) | > 50 (OA) | ||
| 4 | > 4 (H) | > 4 (H) | ||||
Note:
F1 unit is US dollars.
F2* unit is a year.
Categorization of the features.
| No. | Outcomes name and domain | |||||
|---|---|---|---|---|---|---|
| O1 Selecting Destination |
O2 Purchasing Tickets |
O3 Arrangements Transportation |
O4 Arrangements Accommodation |
O5 Insurance |
O6 Selecting Restaurants |
|
| 1 | Short (S) | Yes (Y) | KTX (K) | Yes (Y) | Yes (Y) | Yes (Y) |
| 2 | Medium (M) | No (N) | Bus (B) | No (N) | No (N) | No (N) |
| 3 | Long (L) | Train (T) | ||||
| 4 | Car (C) | |||||
| 5 | Other (O) | |||||
Categorization of the outcomes.
After performing the reduct generation procedure in using training data set, the list of resulting reducts in Table 6 is obtained. The heuristic procedure is applied to determine the reducts.
| Object No. | Reduct No. | Rule No. | F1 | F2 | F3 | F4 | F5 | F6 | O1 | O2 | O3 | O4 | O5 | O6 |
|---|---|---|---|---|---|---|---|---|---|---|---|---|---|---|
| X1 & X2 & X3 | 1 | 1 | * | * | * | * | * | Y | * | * | C | Y | * | Y |
| X4 & X5 | 1 | 2 | M | * | M | * | * | * | S | N | C | Y | * | Y |
| 2 | 3 | * | M | * | * | * | Y | S | N | C | Y | * | Y | |
| 3 | 4 | * | * | M | MA | * | * | S | N | C | Y | * | Y | |
| 4 | 5 | * | * | M | * | * | Y | S | N | C | Y | * | Y | |
| X6 | 1 | 6 | L | H | * | * | * | * | M | Y | C | Y | Y | Y |
| 2 | 7 | L | * | H | * | * | * | M | Y | C | Y | Y | Y | |
| 3 | 8 | L | * | * | * | * | Y | M | Y | C | Y | Y | Y | |
| 4 | 9 | * | H | H | * | * | * | M | Y | C | Y | Y | Y | |
| 5 | 10 | * | H | * | * | * | Y | M | Y | C | Y | Y | Y | |
| 6 | 11 | * | * | H | YO | * | * | M | Y | C | Y | Y | Y | |
| 7 | 12 | * | * | H | * | * | Y | M | Y | C | Y | Y | Y | |
| 8 | 13 | * | * | * | YO | * | Y | M | Y | C | Y | Y | Y | |
| X7 & X8 | 1 | 14 | M | * | H | * | * | * | S | * | T | Y | Y | * |
| 2 | 15 | * | L | H | * | * | * | S | * | T | Y | Y | * | |
| 3 | 16 | * | L | * | * | * | N | S | * | T | Y | Y | * | |
| 4 | 17 | * | * | H | MA | * | * | S | * | T | Y | Y | * | |
| 5 | 18 | * | * | H | * | * | N | S | * | T | Y | Y | * | |
| X9 & X16 | 1 | 19 | L | N | * | * | * | * | * | N | * | * | Y | * |
| 2 | 20 | L | * | L | * | * | * | * | N | * | * | Y | * | |
| 3 | 21 | L | * | * | * | * | N | * | N | * | * | Y | * | |
| 4 | 22 | * | N | L | * | * | * | * | N | * | * | Y | * | |
| 5 | 23 | * | * | L | YO | * | * | * | N | * | * | Y | * | |
| X10 & X11 & X14 | 1 | 24 | * | * | N | * | * | * | L | * | O | * | * | * |
| X12 | 1 | 25 | H | * | L | * | * | * | M | Y | B | N | N | Y |
| 2 | 26 | * | H | L | * | * | * | M | Y | B | N | N | Y | |
| 3 | 27 | * | H | * | OA | * | * | M | Y | B | N | N | Y | |
| 4 | 28 | * | * | L | OA | * | * | M | Y | B | N | N | Y | |
| 5 | 29 | * | * | * | OA | N | * | M | Y | B | N | N | Y | |
| X13 | 1 | 30 | H | N | * | * | * | * | S | N | T | N | N | N |
| 2 | 31 | * | N | M | * | * | * | S | N | T | N | N | N | |
| 3 | 32 | * | * | M | YO | * | * | S | N | T | N | N | N | |
| X15 | 1 | 33 | H | * | N | * | * | * | L | N | O | N | Y | Y |
| 2 | 34 | * | H | N | * | * | * | L | N | O | N | Y | Y | |
| 3 | 35 | * | * | N | YO | * | * | L | N | O | N | Y | Y | |
| X17 & X18 & X19 & X20 | 1 | 36 | * | * | * | * | Y | * | * | * | * | Y | * | Y |
The list of resulting reducts (Treduct).
Next the MORE algorithm is applied. The information in Table 7 is computed and the ranking of the rules in Table 8 are obtained. Table 7 clearly shows the strength or weakness of the rule through its relative strength and stability measure. Therefore, through the threshold function, weak and unstable rules are not extracted and incorporated into the ranking table. Note that the unselected rules are marked in gray in Table 7. Moreover, Table 8 shows the ranking of the rules in detail. Basically, the heuristic procedure is applied to extract the rules. For example, there is significsnt discrepancy (e, g., 20% diffeerence) in the change of support and accuracy from the training data to the test data. These rules, for example, #2, #3, #6, etc. (in gey color) are concluded as an unstable rule and excluded in decision rules, since the margin of error of 20% is considerably high from professosional perspective in the field. The rules, for example #1, #9, #12, etc in Table 7 show the low percentage of change in support and no change in accuracy. Basiaccly, they are highly stable and will be included in final decision rules. Furthermore, a threshold function, F_Threshold(), to extract the rules is described as follows: If the candidate rule and its accuracy is higher than 0.7 and then the rule is extract as final decision rules.
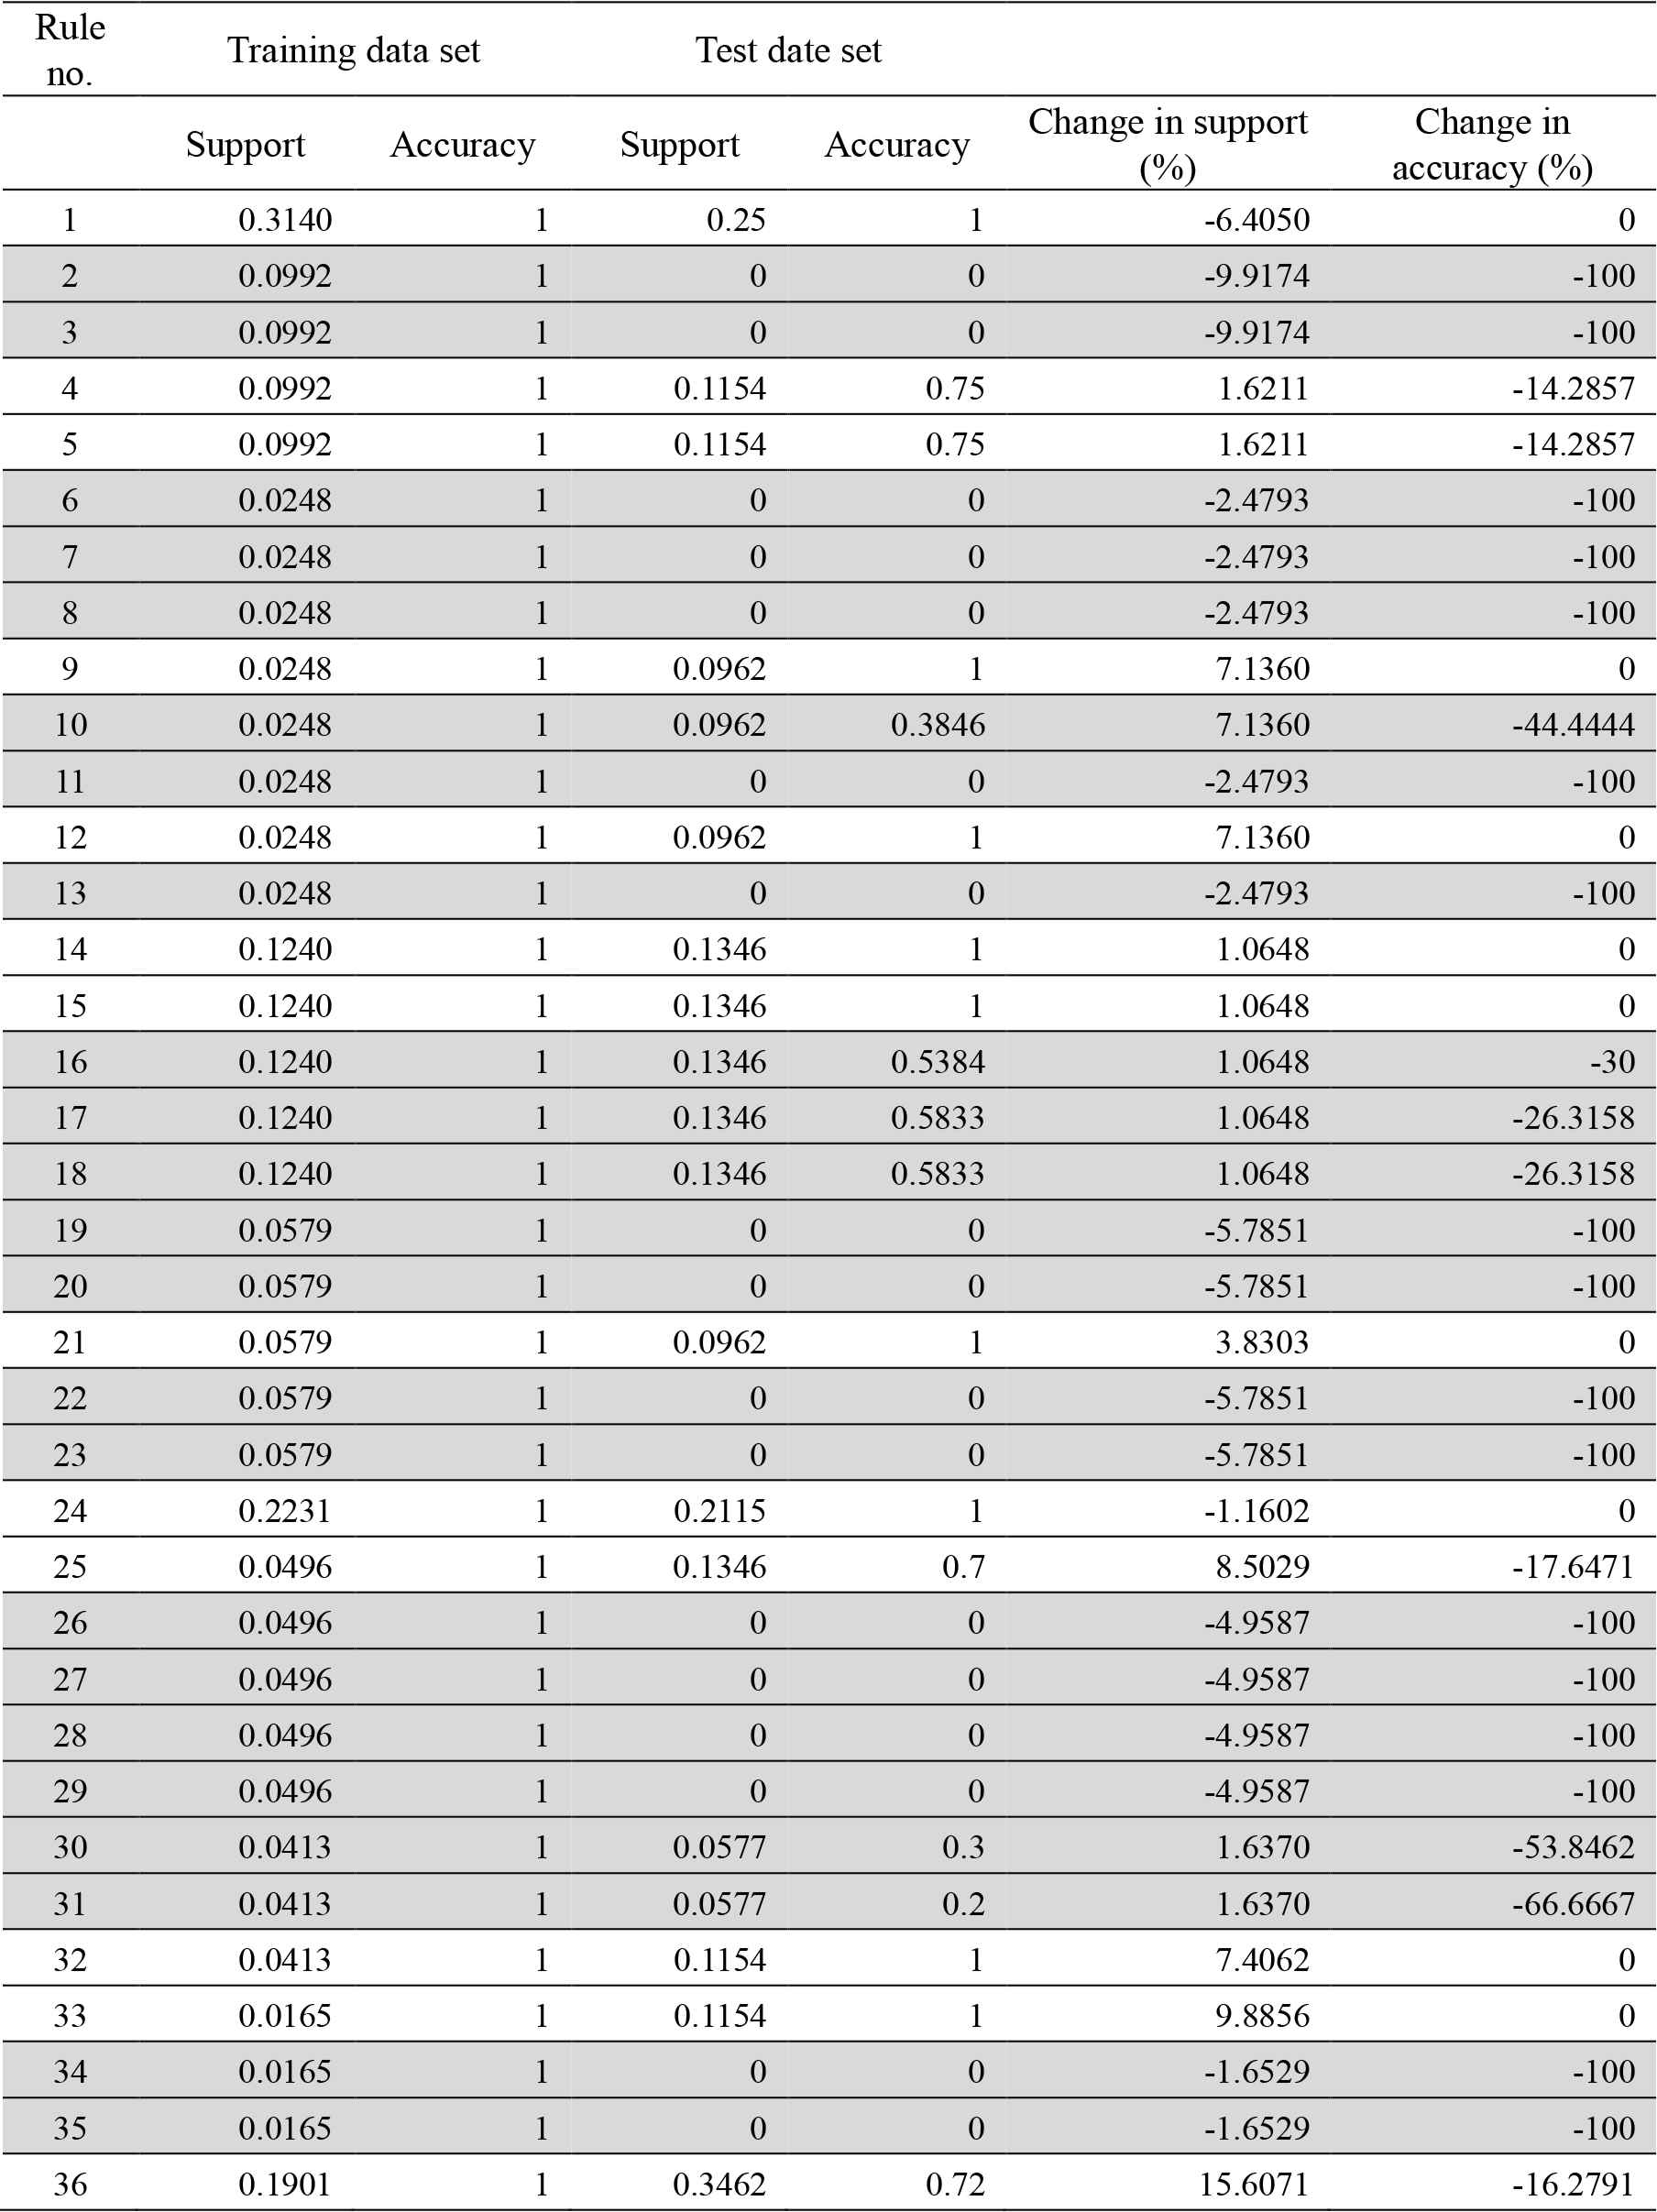
The information table (Tinfo).
| Rule no. | Total support | Total accuracy | Change in support | Change in accuracy | Final rank |
|---|---|---|---|---|---|
| 1 | 1 | 1 | 7 | 1 | 4 |
| 4 | 6 | 10 | 4 | 10 | 10 |
| 5 | 6 | 10 | 4 | 10 | 10 |
| 9 | 11 | 1 | 8 | 1 | 6 |
| 12 | 11 | 1 | 8 | 1 | 6 |
| 14 | 4 | 1 | 1 | 1 | 1 |
| 15 | 4 | 1 | 1 | 1 | 1 |
| 21 | 9 | 1 | 6 | 1 | 5 |
| 24 | 3 | 1 | 3 | 1 | 3 |
| 25 | 8 | 13 | 11 | 13 | 13 |
| 32 | 10 | 1 | 10 | 1 | 8 |
| 33 | 11 | 1 | 12 | 1 | 9 |
| 36 | 2 | 12 | 13 | 12 | 12 |
| Weight | 1 | 0.8 | 0.9 | 0.7 |
The ranking of the rules (TRank).
According to the final rankings, Table 9 shows the first five rules with their rankings, where the relationships between the characteristics of the tourist’s and tourism decision-making tasks. Rules could be interpreted as if the tourist conforms to those features, and then infers he/she would be more concerned about what tasks are on travel arrangements. For example, the fourteenth and the fifteenth rules are the most accurate and stabile. The forteenth rule shows if a tourist has a household income of $100∼200K and has more than four kids; then he/she might care about some tourism tasks like take a short destination trip by train, purchase pre-arranged accommodation and insurance.
| Rule No. | Rank | Contents of rule |
|---|---|---|
| 14 | #1 | IF (Household income = 100∼200) AND (No. of kids = > 4) |
| THEN (Selecting Destination = Short) AND (Arrangements Transportation = Train) AND (Arrangements Accommodation = Yes) AND (Insurance = Yes) | ||
|
|
||
| 15 | #1 | IF (No. of trips = 1∼2) AND (No. of kids = > 4) |
| THEN (Selecting Destination = Short) AND (Arrangements Transportation = Train) AND (Arrangements Accommodation = Yes) AND (Insurance = Yes) | ||
|
|
||
| 24 | #3 | IF (Number of kids = < 1) |
| THEN (Selecting Destination = Long) AND (Arrangements Transportation = Other) | ||
|
|
||
| 1 | #4 | IF (Pet ownership = Yes) |
| THEN (Arrangements Transportation = Car) AND (Arrangements Accommodation = Yes) AND (Selecting Restaurants = Yes) | ||
|
|
||
| 21 | #5 | IF (Household income = < 100) AND (Pet ownership = No) |
| THEN (Purchasing Tickets = No) AND (Insurance = Yes) | ||
Induced decision rules.
Table 10 depicts comparison of coverage between the MORE algorithm and the traditional rough set reduct procedure in this case.
| Algorithm | Number of reducts | Number of objects can generate reduct | Total number of Objects | Coverage |
|---|---|---|---|---|
| The MORE | 36 | 20 | 121 | 100% |
| The reduct generation procedure through RST | 19 | 4 | 16 | 13% |
Comparison of coverage between the MORE algorithm and the traditional rough set reduct procedure in this case study.
| Algorithm | 103 objects | 106 objects | 109 objects | |||
|---|---|---|---|---|---|---|
| 4 outcome | 10 outcomes | 4 outcome | 10 outcomes | 4 outcome | 10 outcomes | |
| The MORE | 83.3% | 81.5% | 78.5% | 76.0% | 72.3% | 71.5% |
| The traditional reduct generation procedure | 15% | 14.7% | 14.3% | 13.1% | 13.8% | 13.7% |
Comparison of coverage between the MORE algorithm and the traditional rough set reduct procedure in the random dat set
Using the traditional RS approach, the results show there are only four objects can generate reducts. Although the MORE algorithm generate nineteen reducts and each reudct has 100% accuracy, but the total number of four objects is 13% (16 divided by 121) of the total number of training data. That means these reducts can make some special cases in the training data set only.
In addition, to validate practicability of the proposed approach, an experiment with 23 conditional features in different data was made. The benefits of the proposed approach are to extract more rules such that the coverage is higher than the traditional RS approach that distinguishes the individual outcome features. For example, the outcome (1, 2) is different from (1, 3), but it can not both be included in (1,*) with one unique entry for the outcome feature. Comparison of coverage between the MORE algorithm and the traditional rough set reduct procedure is presented in Tabe 11.
6. Conclusion
In tourism, most of the existing studies lack a method to analyze the qualitative nature of the data. Although the traditional rough set approach is an excellent classification method in qualitative modeling, but the approach has no consideration for multiple outcome situations. This study presents a novel solution approach, namely the MORG and MORE algorithms, to generate reduct and extraction rule. Moreover, a case study of tourism with multiple outcomes is used as an example and is compared the results with a traditional rough set and rule extraction algorithm. The contributions of this paper are summarized as follows: (1) The MORG algorithm overcomes traditional rough set’s drawbacks. The algorithm is not limited to analyze data set with more than a single outcome; (2) The MORE algorithm has stronger rule extraction capability. The algorithm is able to extract decision rules based both on strength and stability. And determines which rules are the strongest by rank.
To date, there are vey few work on multiple outcome rule induction, future research could focus on the following: (1) Using sensitivity methodology to assess the effects of features in tourism decision-making tasks; (2) Defining threshold values and weight by experts that are used to extract and rank rules; (3) In addition, unknown or incorrect features and outcome values often occur in real world applications. How to pre-process the data set is important; (4) Another consideration in reducing the set of rules is to determine ‘infeasible’ rules. Even the initial rules generated may miss some lower level performance results that cause infeasibility to occur (Bai & Sarkis, 2010); (5) Performance measurement of the proposed approach could include the precision recall, Receiver Operating Characteristic (ROC) curve; (6) More data sets and larger sample size will be used to validate the model.
Acknowledgments
This work was partially supported by the Ministry of Science and Technology in Taiwan (NSC 102-2410-H-260-045-MY3, MOST 105-2410-H-260 -019 -MY2) and the National Science Foundation (DUE-TUES-1246050). The authors wish to express sincere gratitude for their financial support.
References
Cite this article
TY  - JOUR
AU  - Chun-Che Huang
AU  - Tzu-Liang (Bill) Tseng†
AU  - Kun-Cheng Chen
PY  - 2016
DA  - 2016/12/01
TI  - Novel Approach to Tourism Analysis with Multiple Outcome Capability Using Rough Set Theory
JO  - International Journal of Computational Intelligence Systems
SP  - 1118
EP  - 1132
VL  - 9
IS  - 6
SN  - 1875-6883
UR  - https://doi.org/10.1080/18756891.2016.1256574
DO  - 10.1080/18756891.2016.1256574
ID  - Huang2016
ER  -