
A Multi-criteria Optimization Approach to Health Care Tasks Scheduling Under Resources Constraints
- DOI
- 10.2991/ijcis.2017.10.1.29How to use a DOI?
- Keywords
- Emergency department; Overcrowding; Decision support system; Multi-skill health care tasks scheduling; Evolutionary algorithm; Fuzzy logic
- Abstract
We are interested in this paper in studying and developing a decision support tool for multi-skill health care tasks scheduling in the Pediatric Emergency Department. We use an evolutionary algorithm and we propose the use of fuzzy logic to formulate an adapted fitness function. We consider the potential performance of the system and we set up a set of lower bounds characterizing criteria limits allowing to calculate the minimum waiting time for incoming patients and the corresponding latest ending time.
- Copyright
- © 2017, the Authors. Published by Atlantis Press.
- Open Access
- This is an open access article under the CC BY-NC license (http://creativecommons.org/licences/by-nc/4.0/).
1. Introduction
The interest in improving care quality through the evaluation of activity in health care institutions is becoming increasingly important. The majority of hospitals around the world must comply with new management rules to minimize the costs involved, to enhance the quality of health care provided to patients and maximize their comfort. Many researchers have studied this problem trying to come out with new organizational and planning strategies dedicated to hospitals. In order to improve practices, to anticipate possible crises and overcrowding situations, reduce costs and meet budgets increasingly tight, health sector has appealed to engineering sciences. Now, the analogy with the world of industry facts that any care process can be likened to an operating sequence of production units, involving a heterogeneous staff of various specialties. The collaboration of these different actors is the key to the evolution of health care process with a common goal: to ensure the best possible quality of care to patients, maximize their satisfaction and reduce costs. Obviously, a layer of expertise, technology and security is essential to achieve this goal without neglecting the ethical and regulatory aspects.
We focus our study on a particular service: the Pediatric Emergency Department (PED) particularly concerned with care quality issue since its activity is continuously growing. Many problems of organization and management have recently been highlighted. So that, reducing the waiting time of patients is one of the essential parameters for the evaluation of the quality of care in the ED. This setting also affects costs. In the PED patients are often dissatisfied; many feel that their expectation is not legitimate and that their care should be immediate. A wrong or imprecise prioritization of patients can also lead to their dissatisfaction and long waiting times.
The environment in the PED is fully stochastic and we can have different types of patients’ flow. The first one represents the random flow of patients’ arrivals to emergencies. Then, we have the already scheduled patients’ flow (for patients brought by the Mobile Service of Emergency and Intensive Care), and the last one is the non-scheduled and urgent patients’ flow. In addition to the variety of patients’ flow, a lack of human or material resources (waiting for a bed, a specialist release of a specific material, etc. ) can engender disturbances in the functioning of the PED and thus to long waiting times at different stages of a patient pathway due to the bottlenecks in the health care structure itself. These bottlenecks are generally due to the shortage of resources or sometimes simply to medical practices, e.g. the hydration of a child with gastroenteritis can reach 8 hours, or to a combination of both, for example: the waiting for biological results that may depend on both the medical procedure and the load in the analysis laboratory.
The design and the development of an IT tool for decision support is therefore necessary to deal with those issues and to enable practitioners to be more focused on their main task “treat patients” and to avoid data entry which sometimes is a source of errors and a waste of time in an environment requiring speed and reliability. A dashboard can be offered to health care activity monitors in real time to well manage their institution and to rapidly and easily detect the sources of anomaly in case of a crisis situation.
We are particularly interested in human resources planning in pediatric emergency organizations which is not yet processed according to the state of art analysis. This planning aims to determine the best balance between patient demand and involved human resources in order to meet needs for treatment while minimizing waiting times, optimizing the quality of health care services and reducing costs. This work belongs to HOST project (Hospital: Optimization, Simulation and Crowding Avoidance) supported and financed by the French National Research Agency (ANR). Its goal is to optimize the PED functioning. This project aims to better manage health care organizations, anticipate the overcrowding feature and establish its avoidance proposals. Our concerns focus on studying and developing an interactive scheduling approach based on an evolutionary algorithm for Multi-skill Health Care Tasks Scheduling (MHCTS). We consider the potential performance of the system and we set up a set of lower bounds characterizing criteria limits. The second part of this article presents a literature review about health care organizations and scheduling problems. Then the problem will be described in the third section followed by the mathematical formulation of the problem. We will after that present our problem resolution method: the lower bounds calculation for criteria and the aggregative approach. An application to an evolutionary algorithm is shown in the sixth section. The last part will be devoted to the simulation, the different results and conclusions of this research and directions for future works.
2. State of the Art
Many researches have been conducted in the PED. In the following section, we present a non-exhaustive list of a literature review about PED management, the problem of overcrowding, proposed approaches for PED management and medical staff scheduling.
2.1. Organization and Management of the Emergency Service
In current health care systems, emergency structure is a pivot link in the chain of patients’ care process. Considered as the main entrance and the central mission of health care facilities, emergency structures are influenced by the changes that have affected hospital systems. To these mutations are added the regularly increasing flows of patients in emergency structures leading to congestion and disruption in the functioning of these structures. The major challenges of these changes are the reduction of waiting times deemed excessive by patients, preventing the saturation of the structures and ensuring the safety and quality of care for patients. The multiplicity of nature and form of demands of emergency care explains the complexity of such an organization. Inflows and outflows to the emergency structure make the system management of emergency a complex interacting system. In addition, activity in emergency structures is characterized by the irregularity of the quantity and the nature of the work involved [1]. Patients’ satisfaction is far from being guaranteed due to waiting time which is sometimes excessive.
In France, the recognition of PED is today acquired and is part of the health policy emergency regional pattern and the regional health organization scheme. Indeed, the origin of the establishment of a dedicated structure exclusively to pediatric emergency is the need to treat children in a specific environment suited to the child. The need for adaptation is essential in the case of the care of children. This need is required in the case of the care of children and their families is all the more true that the child is young. This need is also explained by the large number of children attending hospital emergency departments. Given the growth in the number of pediatric emergency consultations, several studies have been conducted since the mid-90s to understand the causes and consequences in order to contribute to the improvement of pediatric emergency organizations.
For several years in France [2], as in Europe or elsewhere [3] [4], urgent pediatric care demand increases to clog all care systems (hospital pediatric centers, liberal pediatric care systems). Some studies talk about inflation, while others highlight the problems of false emergencies or the “perceived emergency.” In most of these studies, the emphasis is always put on children emergency consultations and believes they represent between 25 and 30% of hospital emergencies at national level. Although the majority of these consultations is in private practice, a significant number of patients turn to hospital emergency services leading to saturation.
The hospital system is qualified as a real care production system whose main mission is to provide the best care for patients. Field observations have shown the complexity of the hospital: multiple missions, prioritization, silos, heterogeneity of equipment and facilities, etc. [5]. There is also a wide range of professions. In addition to typical hospital professions there are some activities not directly related to the care activity (administrative, technical, computer, etc.). Finally, the care activity is intrinsically a complex activity, specific to each patient, which differentiates it from a conventional industrial production activity. The specificity of hospital activity is itself complex and can only increase the complexity of the organizations that are responsible. So the human characteristic seems to have an impact on the complexity of production operations as well as their duration and their quality. This complexity is enhanced by the diversity of demand and the interdependence of the care process (time dependence, spatial or related to possible sharing of resources).
2.2. Overcrowding Phenomenon in the Pediatric Emergency Department
One of the most discussed issues in PED is around overcrowding. This phenomenon is manifested by a lack of human and material resources (mainly admission beds) in front of an urgent demand for care [6]. This leads to the dissatisfaction of patients [7] [8] not finding the required care quality [9] [10] and a tired and overwhelmed staff [11], without neglecting the substantial financial losses [12] and the risk of mortality which is the most serious issue [13] [14] [15].
The overcrowding phenomenon occurs when the demand exceeds supply. This limits the scope for organization and planning. The situation is worse in the case where several patients arrive at the same time (case of food poisoning in a canteen for example). In [16] the overcrowding is defined as “a situation in which the identified need for emergency services exceeds the resources available to support patients in the emergency department, in the hospital or in both at once”. This definition has been widely adopted thereafter. However it does not focus on time horizon or the consequences whereas the overcrowding phenomenon is not a peak of activity. The overcrowding phenomenon can be extended over the term and the magnitude of its adverse effects is proportional to its duration in the time. That is why we propose the following definition: A state of overcrowding in PED is an imbalance between the flow of care and support capacity for a sufficient time which can lead to disturbances in the functioning.
Many researched have studied the problems in PED and various methods have been proposed but actually, there is no decision support system able to manage the PED and the problems corresponding to an overcrowding situation.
2.3. Decisional Models for the Pediatric Emergency Department management
The simulation is highly advantageous when it is used to model certain complex patient flow through the hospital and to test different scenarios by changing the control rules. This happens typically in the emergency department, where patients arrive stochastically and require a wide range of treatments (from light care to the management of severe injury), covering multi services and specialties. Wrong direction can cause a significant increase in waiting times and costs.
Centeno et al. consider four specific areas of maternity service to optimize (i) patients flow process and (ii) the use of resources. A flow diagram has been established, modeling the pathways of emergency patients (childbirth) and patients who have appointments for examinations or interventions. The studied system mixes stochastic arrival and deterministic process, which strengthens the interest of this study. Miller et al. have focused on improving the functioning of emergency services in order to minimize the length of stay of patients. This work has attempted to identify and analyze the various discrete patient-centered processes. It has proved a better understanding of the organization of the PED for medical staff. Samaha et al. show that an organizational problem is not necessarily related to the resources involved; the operation was to reduce the residence time of patients in the PED by identifying resources bottleneck and visualizing the different processes of this service. An experimental plan is used by Baesler et al. to estimate the additional demand that can be accepted by an emergency care service, while maintaining a reasonable waiting time for patients and considering the current material and human resources. It is therefore to estimate the maximum capacity of the service. Glaa et al. propose a model of the patient journey in an emergency service through GRAI methodology, with the aim of optimizing this route and improve the quality of patient care [17]. The models are characterized by great diversity in activities and by a large number of stakeholders. The simulation helped identify organizational problems of the system and evaluate several alternative organizations on the physical layout, staffing, etc.
2.4. Human Resources Scheduling
Resource management and planning known under the name of scheduling is to plan and give a chronological order to tasks (elementary activity) in a process to perform an activity in several steps, while using the available resources (labor, machinery, energy, transport, etc.). Generally there is obvious shortfall in resources. Moreover, this process evolves under various constraints (cost, deadlines, stock, priority tasks, etc.), which makes scheduling subject to combinatorial problems of NP complexity sometimes difficult to resolve [18] in a way optimal in practice [19]. Indeed, scheduling has invaded almost all areas as it has proven its benefits by optimizing the processes and increasing productivity. It is mainly applied in industry (scheduling workshops), but also in computing (scheduling of processes in operating systems) or construction (project monitoring) .etc. Several scheduling methods exist, each method has its specificities. Generally we classify them according to the nature of the solution (exact or approximate). Scheduling is commonly used in industrial looking to minimize manufacturing costs and increase productivity. Each process requires one or more human resources (doctors, nurses, anesthetists, stretcher …) and material (operating rooms, hospital rooms, medical equipment, imaging, radiology…) that can be shared in a common environment. The evolution of the process is done under the constraints (time, cost, regulatory).
Several works in the Operating Room made analogies with workshops and used heuristics [20] and genetic algorithms [21]. Other studies have used constraint programming [22]. For home hospitalization, Ben Bachouch et al. have studied how to assign tasks and balance the nursing workload [23]. The proposed mathematical model takes into account the availability of practitioners, skills and qualifications required by the tasks. In the emergency department the objective of Daknou et al. was to minimize the waiting time for patients and minimize costs while maintaining a good quality of care [23]. The author proposes scheduling based on List algorithm that takes into account the priorities assigned to tasks. The assignment of medical staff is a crucial problem for the proper functioning of the PED and more difficult because of the irregularity of the quantity and the nature of the activities characterizing the functioning of emergency organizations [24]. It is therefore essential to optimize the assignment of medical staff members respecting on one hand, skills and availability, and on the other hand, patient flow.
Hence, scheduling is no longer restricted to the industry and now health care field also needs to optimize its operation to better achieve its objectives based on the world of engineering.
In this paper, we are particularly focused on human resources planning in pediatric emergency organizations, which is not yet processed depending on the analysis of the state of art.
3. Problem Description
Health care systems are similar to production systems which always try to meet demands (patients for the hospital and customers for industry). A health care system can be considered as a full production system, constrained by limited material and human capacity in order to deliver the best care at the lowest cost. The numerous hazards such as the stochastic arrivals of patients and the complications that can occur during treatment process, the difficulty of standardization and the coordination of medical acts with the high number of actors make the planning a complex process. The implementation of generated plans requires sustained efforts.
The search for industrial excellence in corporate comes near to the concept of optimization of the quality of health care facilities. The specific feature of health care systems is that they cannot speculate on human suffering and for which the objective of profit must be dismissed. A Multi-skill Health Care Tasks Scheduling (MHCTS) is a combinatorial optimization problem. A classic job shop flexible is an NP hard optimization problem similar to a single-skill health care task scheduling which is a simple instance of MHCTS, an NP hard optimization problem as well. The problem of job-shop scheduling consists in organizing the realization of N jobs on M machines and a job j represents a number of nj non preemptive ordered operations. In MHCTS, jobs correspond to treatment tasks (a treatment task for each patient), machines are the medical staff members but health care operations being executed are preemptive to start a new more urgent operation. However, durations of health care operations are stochastic and cannot be known in advance as in production systems. In fact, durations depend on care providers’ skills and patients’ states and pathologies.
In this work, medical staff assignment is dynamic and reflects the level of expertise of the PED actors, their workloads, availabilities and constraints related to patients. The MHCTS problem is a problem of planning and organization of a set of tasks to be performed by a set of medical staff members with different skills. Two stages in its resolution are considered. The first is to judiciously assign tasks to the appropriate resources. The second step is the sequencing of tasks and determining their starting dates taking into account different constraints. Thus, several criteria may be considered in the analysis and resolution of this scheduling problem. Indeed, four major issues arise. The first is the minimization of the total average of patients’ waiting time. The second is the optimization of medical staff workload which includes the minimization of the total workload of medical staff and their workload balancing. The last criterion is about time constraints, it is the total execution time for all patient’s care tasks (Cmax). This variety of criteria makes difficult to assess the feasible solutions and the comparison between the methods.
When we first met with the medical practitioners, they explained the MHCTS like a classical optimization problem. After several meetings, we found out that a number of constraints are not classical and have not been considered in the benchmarks. For instance, the PED is characterized on one hand by several overcrowding periods generated by random patients’ arrivals, and on the other hand, the PED has to take into account 3 types of health care operations: programed operations, non-programed operations and urgent non-programed operations. This makes the MHCTS a very hard combinatorial optimization problem. Thus, the practitioner has to deal with the travel of patients between sites of the health care organization (RMI, radiology, biological exams, etc.) if two health care exams for the same patient are scheduled back to back. The practitioners also informed us that splitting exams into different periods is allowed at the PED. That being said, the MHCTS problem at the PED consists in assigning medical staff members and health care operations corresponding to patients to a set of periods and boxes while respecting the hard constraints.
Health care operations for the same patient are divided into two sets: splittable and non-splittable operations. Each medical staff member has a set of allowed periods and a set of allowed boxes. Periods can overlap and boxes are not available at all periods. Thus, a list of available boxes is associated to each period.
The hard constraints are the following:
- •
A medical staff member cannot treat two patients at the same period or at two overlapping periods.
- •
A medical staff member can be assigned to one or many periods.
- •
A non-splittable health care operation must be assigned to a unique box.
- •
The duration of the patient treatment can be equal to the duration of the period in which it is assigned or the sum of many consecutive or separated periods.
- •
The capacity of any box should not be exceeded at any period.
- •
The sum of the numbers of patients in the different sites of the PED (patients sent to radiology, echography, patients in boxes, etc.) should be equal to the total number of registered patients.
- •
A box can be used only at one period of a set of overlapping periods.
- •
Each health care operation should be assigned only once.
The medical practitioner considers the MHCTS feasible when all the hard constraints are met. The quality of the solution is measured using soft constraints. When a soft constraint is not satisfied, a penalty is applied. The soft constraints used to measure the quality of the solution differ from one PED to another.
The following definitions describe briefly the soft constraints used by health care practitioners:
- •
Operations related to one patient allocated back to back in two different boxes should be avoided.
- •
Two medical staff members mk and ml having patients in common, are placed at two periods back to back in the same day.
- •
Each medical staff member should be authorized to leave the patient after ending the health care operation allocated to him.
- •
In an overcrowding situation, shifting from one room to another should be authorized.
- •
The preemption of non-vital health care operations is allowed. Indeed, one operation allocated to one medical staff member needed for the execution of a more urgent health care operation can be reallocated to another medical staff member if this latter has the needed skill for its execution.
- •
Medical staff members allocated in different sites should be allowed.
- •
In a crisis situation, medical exams can occur in the PED corridors.
Hard constraints must be respected; however, soft constraints can be violated especially in a crisis situation.
4. Formulation of the Problem
We introduce the mathematical model used to formulate the problem and to assess the set of solutions obtained by MHCTS approach.
4.1. Parameters
4.1.1 Health care operations parameters
- NP:
a set of N patients to treat, NP={P1, P2,…,PN},
- MS:
a set of M medical staff members, MS={m1,m2,..,mM},
- k:
index of medical staff member mk,
- Oi,j:
i-th health care operation corresponding to patient Pj. For each Pj€NP, 1 ≤ j ≤ N, Pj = {Oi,j, 1 ≤ i ≤ nj}, nj number of health care operations corresponding to patient j,
-
subset of patients corresponding to splittable health care operations,
- Oi,j:
subset of patients corresponding to splittable health care operations,
- B:
set of edges [m1, m2] where m1 and m2 are two medical staff members who have patients in common,
- wkl:
number of patients in common between medical staff members mk and ml,
- wkl:
number of patients in common between medical staff members mk and ml,
- rj:
the earlier starting date of patient pj treatment,
- di,j,k:
theoretical execution time of the operation Oi,j executed by medical staff mk,
- Wk:
workload of medical staff member mk,
- W:
the workload of all medical staff members,
- ri,j,k:
the earliest availability date of the medical staff mk for operation Oi,j,
- Ci,j,k:
skill of the medical staff member mk needed for the execution of the operation Oi,j,
-
the entrance date of patient Pj,
- ti,j:
starting time of the operation Oi,j,
- γi,j :
the theoretical minimum duration of the health care operation Oi,j execution,
- cj:
the theoretical completion time of patient Pj treatment,
- dj :
the theoretical ending time for Pj treatment.
4.1.2. Health care rooms parameters
- S:
Set of sites in the CHRU of Lille (site for blood test, MRI, X-ray, etc.) and ns = |s| is the number of sites in this set,
- R:
Set of all available health care rooms,
-
Number of available treatment rooms in period p,
-
Capacity of health care room r € R.
4.2. Variables
4.2.1 Primary Decision Variables
- Xjpr:
boolean, 1 if a health care operation or a portion of it corresponding to patient j is placed at period p in health care room r,
- Xjp:
boolean, 1 if a health care operation corresponding to patient j is placed at period p.
4.2.2. Secondary Decision Variables
- Ajpr:
an integer representing the number of patients Pj, ≤N having splittable health care operations placed at period p in room r,
-
boolean, set to 1 if medical staff members ml and mk, having patients in common, are placed at two periods x and y back to back in the same day,
-
boolean, set to 1 if medical staff members ml and mk, having patients in common, are placed in two different sites at two periods spread by a gap,
- Ujpr:
boolean, set to 1 if multiple patients are being treated at period p in room r. The number of patients exceeds the capacity
- Ujpc:
boolean, set to 1 if one or multiple medical staff members are assigned at period p to patient Pj in the corridor c,
-
boolean, set to 1 if medical staff members ml and mk have patients in common and are placed in two periods spread by a gap and in health care rooms located at different sites. For this, a Travel T is necessary.
4.3. Institutional Parameters
- wT:
weight of patient travel penalty between the different sites in the health care organization,
- wc:
penalty weight of using the PED corridor c,
-
weight of exceeding the capacity of room r at the period p,
-
weight of the medical staff member mk over workload in period p,
- GPS:
gap of the treatment period Spread Penalty.
4.4. The objective Function
Minimize:
- C(wT):
Cost generated by patient travel penalty between the different sites in the health care organization.
- C(wc):
Cost generated by using the PED corridor.
-
Cost generated by exceeding the capacity of room r at the period p.
-
Cost generated by the medical staff member mk over workload.
- C(GPS):
Cost generated by the gap of the treatment period spread penalty.
The objective function is a sum of penalty terms. Each of the terms refers to a specific soft constraint.
4.5. Hard Constraints
The following hard constraints condition the feasibility of the solution.
Linking the variables Xjpr and Ajpr relative to splittable exams:
The two parts of equations above are required to check Xjpr = 1 if Ajpr ≠ 0.
Linking the variables Xjpr and Xjp relative to splittable operations:
At most
Equation (5) confirms that, when Xjp = 1, there is at least one variable Xjpr set to one and at most
4.6. Soft Constraints
The solution quality is determined through the following soft constraints.
MPCp: Whenever a Medical staff member is allocated to treat one or more Patients in the Corridor at period p, a corridor penalty is applied:
4.7. Criteria
4.7.1 Reduction of the total workload of MS members: Cr1
The total load is equal to the sum of the lengths of all health care operations executed according to any medical staff assignment. However, for each operation Oi,j, the length of execution time is greater than the minimum length γi,j where:
So,
4.7.2 Reduction of total waiting time of patients Cr2
This corresponds to minimize Cr2;
4.7.3 Reduction of the response time to health care tasks Cr3
It corresponds to minimize Cr3,
with
4.7.4 MS members Workload balancing Cr4
Let S be any assignment of a health care operation to a MS member, let
For the same assignment S, the workload of the MS member who has the highest workload is greater than the workload average, hence: ∀ S, we have:
The problem to solve is to ensure qualitative management of patients presenting to the emergency taking into account their emergency degree. The goal is to manage in the most possible efficient manner patient flows by prioritizing the most serious cases. The management should mobilize human resources in relation to their availability by promoting each time the staff deemed “most expert” for particular health care operation. The issue comes to organize the execution of N health care treatment operations by M medical staff members. Each patient j treatment corresponds to a number nj of ordered health care operations. Each operation Oi,j may be performed by one medical staff member with one skill needed for its execution. Each patient j needs multi skills for his treatment, simultaneously and/or sequentially.
Each staff member Mk has a level of skill defined by a percentage degree θi,j,k needed for the operation Oi,j execution. If θi,j,k = 100%, then Ci,j,k is the main skill for Mk. If not, 0 < θi,j,k < 100%, Ci,j,k is a secondary skill for Mk then the medical staff actor can only intervene when he is qualified by the health care organization to be able to execute the corresponding health care operation. Finally, if θi,j,k = 0 then the staff cannot do the related health care operation.
Assigning an operation Oi,j to a medical staff member Mk entails the occupancy of this medical staff member for a duration di,j,k (we assume di,j,k ∈ IN*). During this time, this care provider, considered as a renewable resource, is not available to execute any other health care operation.
In this issue, we make the following assumptions:
- •
the order of treatment operations for each patient is set since the beginning and is able to be changed in the cases where more urgent patients arrive to the PED or complications occur while the scheduling is being executed;
- •
a medical staff member can execute only a single operation at an instant t (resource constraint);
- •
the total number of operations to be performed is higher than the number of medical staff members.
Thus, the resolution of such a problem requires the assignment of each operation Oi,j to a medical staff member Mk, and then calculating the starting dates ti,j of different operations Oi,j.
In the following section we are going to solve the MHCTS problem respecting the constraints described above. So we are facing to a NP-hard combinatorial multi-criteria optimization problem.
5. Lower-Bounds for criteria evaluation
The resolution of the studied multi-objective optimization problem consists of two steps: the multi-objective evaluation which aims to define an adapted fitness function using a fuzzy aggregation of the objective functions in order to compute dynamically the weights of the different objective functions, and the resolution process.
5.1. Fuzzy homogenization criteria
According to the criteria we defined, we are interested in this part in the evaluation of solutions. These criteria have different weights and therefore are not of the same importance and the relation between them is complex and non-linear. Hence, to take into account these difficulties and to evaluate the obtained solutions, we will start with the definition of lower-bounds. For each objective function fq (.) related to a criterion we define a lower-bound
Let
Fuzzy Logic Application for Solving Scale Problem
εq is a little positive value designed to avoid the problem of dividing by zero (when
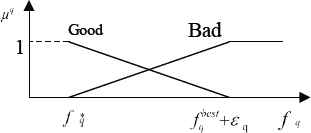
We consider two fuzzy subsets: good solutions and bad solutions for the qth objective. The result is a vector characterizing a solution where the components are homogeneous and belong all to the interval [0,1]. At the end we formulate the fuzzy fitness function.
• Definition 1
We consider that the assignment of a health care operation Oi,j to a medical staff member is possible when the minimum skill Ci,j,k is provided.
Each assignment is characterized by a set S as:
If the operation Oi,j is assigned to the medical staff member Mk, Si,j,k is equal to 1 otherwise it will be 0.
• Definition 2
For each patient treatment Pj, ζj is the sum of the execution times of its operations. For an assignment S, we have:
• Definition 3
Oi,j is the i-th health care operation for treating patient Pj, the minimum execution time of the operation is denoted γi,j :
• Definition 4
For each patient treatment Pj, the minimum execution time of all its corresponding health care operations is denoted ζ*j with:
• Definition 5
To evaluate the quality of functioning of the PED, we define the performance indicator TWT (Total Waiting Time) which reflects overcrowding situations and the inability of the PED to satisfy patients demand.
Remark:
ri,j will be calculated using the following formula:
5.2. Lower-Bounds Calculation
5.2.1 Criterion 2: Waiting Time for Each Patient: Cr2
• Lemma 1
Justification: Let
The wait average before the first consultation is W such as
Let Pt be the total number of patients waiting for health care treatment
Let Sj,t be the boolean value representing whether the first examination of a patient j at time t happened (Sj,t =1 if the examination did not happen and 0 otherwise), LoSj,t is the length of stay of a patient j at time t, with
This goes back to say that: for a patient Pj, we have:
So,
5.2.2 Criterion 3: Response Time to Health Care Tasks: Cr3
Lemma 2
We have also:
Justification: Let a patient Pj to be treated and S a possible assignment of medical staff members to health care operations. For the assignment S we associate the Schedule P(S). As we stated before, ζj is the sum of the execution times of operations corresponding to the patient Pj.
For an assignment S, we have:
Then the minimum of execution times is as follows:
So for each patient Pj, the response time for health care tasks request is higher than
So:
This justifies Lemma 2.
Criterion 4: Workload Balancing: Cr4
Because the workload of a medical staff members must be an integer, we will take the integer value of
• Lemma 3
The integer value of
So if
Recently, Evolutionary Algorithms (EAs) have been proposed in different fields (engineering framework, computer science and operation research) to solve Multi-objective Optimization Problems [25] [26] [27].
The principal advantage of this optimization technique is the fact that it operates on data without using preliminary knowledge on the processed problem. It also evolves from an initial population of possible solutions iteratively bringing a global improvement according to one predefined criterion [28] [29]. Therefore, the EAs can represent a suitable technique for implementation of the multi-objective optimization based on the aggregative approaches. The most common fitness function used to evaluate the quality of solutions is:
• Dynamic aggregative approach evaluation
In the EA we use the fitness function
Let
At the kth iteration of the EA, we evaluate the quality of solutions according to the qth objective function. The evaluation is done using the membership functions shown in figure 2.
Membership functions for objective function values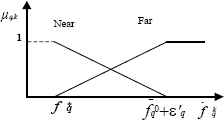
So, two fuzzy subsets could be distinguished:
- •
Nearq: the subset of solutions near the lower-bound value
- •
Farq: the subset of solutions far from the lower-bound value
As shown in figure 2, the membership functions could be formulated as follows:
The calculation of the weights
The application of the previous rule can be expressed as follows
The different weight vectors (W1, W2,.., Wk,.., WQ) will be calculated dynamically, by evolving from the kth generation Pk to the next generation Pk+1) according to the distance between the lower-bounds and the mean of the individuals of the generation Pk (showed by a black circles in figure 3). The objective is to explore the possible improvements of the solutions. The priority is given to the optimization of the objective functions whose values mean is far from the optimal value (or the lower-bound value). Thereafter, while using such a fuzzy technique, it would be possible to control the direction of search to construct a final set of solutions close to the optimal one. This final set will be used for selecting Pareto-optimal solutions and the others will be rejected.
Fuzzy dynamic control of search directions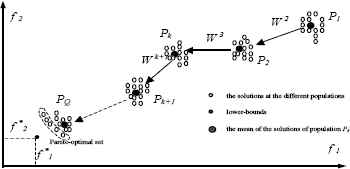
6. Application to an Evolutionary Approach
To check how far these lower-bounds reflect the potential performance of the health care system, several instances were tested. This test was conducted using an evolutionary approach. The objective of the simulation of these instances is not to evaluate the effectiveness of the approach. The considered aim is rather to measure the quality of bounds proposed by comparing the different values of the criteria attached to solutions provided by the mentioned method.
In this section, we explain the main features of the used evolutionary approach; then we present some treated examples and compare the criteria of the obtained solutions with the calculated values of lower-bounds.
6.1. Overview of the adopted method
The considered problem presents two sub-problems. The first is the assignment of each operation Oi,j to the medical staff member mk. The second is the calculation of starting time ti,j of each health care operation Oi,j.
To solve such a problem, we apply initially an assignment approach. It is used to assign operations to health care tasks taking into account the skills of medical staff members and the workloads of medical staff members to whom we have already assigned operations. Then, it solves the problem of tasks sequencing through a scheduling algorithm which calculates the execution start dates ti,j taking into account the availability of medical staff members and constraints precedence. Conflicts are resolved by applying conventional priority rules (FIRO, FIFO, LIFO and we get a set of scheduling according to the priority rules applied. In emergency department priority is given at first to the most urgent cases, then to the patient who has arrived first. The scheduling procedure is as follows: according to the availability date of a medical staff members and the availability of the corresponding health care operation, the starting time of the operation is the minimum date among the two availabilities’ dates. On the set of scheduling, we apply an evolutionary algorithm that will serve to the construction of new individuals and the acceleration of convergence. The objective is to make EAs more efficient and faster. Indeed, the construction of solutions is promoting reproduction of individuals respecting the schedule generated before and not from the entire set of chromosomes. More details will be given in the following section.
6.1.1 Assignment Process
This method allows assigning each health care operation to the most qualified medical staff member taking into account his skills, his availability date and workloads of health care providers to whom operations have been already assigned. To compute the availability date of each medical staff member a simple application of fuzzy logic is proposed.This procedure leads to create a set E of assignments (E = {Sz / 1≤z≤cardinal(E)}). For each health care operation Oi,j, we associate the frequency Schi,j,k to be assigned to a medical staff member mk then, it condenses the set U of medical staff members in the PED to a subset where the probabilities of having a good scheduling are higher. We consider that the assignment of a health care operation Oi,j to a medical staff member is possible when the percentage of the skill Ci,j,k is higher than the minimum level of skill needed to carry on the operation Oi,j. Schi,j,k indicates the value 0 when the medical staff member is not enough qualified for this health care operation and is equal to 1 when the assignment of the operation Oi,j to the medical staff member mk is possible. For each health care operation we can have one or more medical staff members who have the needed skills and are therefore qualified for its execution.
In the following part of this paper we will take into account the availability date of medical staff member
6.1.2 Availability Date Calculation: Fuzzy Logic
It consists on availability dates calculating for each medical staff member in order to execute the health care operation Oi,j in the same assignment table Sch. Calculation is based on analyzing the affordable skills, the evolution of the current treatment task, patient’s health state and pathology severity degree. These are the inputs. Then, we define for each input three sub-sets {“Low”, “Medium” and “High”}. Each subset is characterized by its trapezoidal Membership Functions (MF) meanwhile the state varies gradually. After the definition of MF of the variables or Inference which is based on decision rules depending on experts’ views and historical data, the result which is fuzzy value undergoes a defuzzification to obtain an exact number as final output using the Center Of Area method (COA). For the assignment, we choose to assign the health care operation to the medical staff member who corresponds to the highest fuzzy value which reflects his availability rate.
Let Evi,j be the evolution of the current health care operation Oi,j. Thus, if the operation is being succeeded then Evi,j is good, otherwise if there are some complication or the child being treated is highly agitated and the medical staff member is finding difficulties to treat him, the Evi,j is bad. Then, we apply fuzzy logic calculation on the couple (Ci,j, Evi,j). The result is the availability date of the medical staff member.
6.1.3 Starting Time Calculation
We calculate the starting date of execution ti, j according to the availability of medical staff members and their skills as shown in the following algorithm:
Starting Time Calculation |
BEGIN |
initialize the vector of medical staff availabilities Dispo_Staff[k]=0 for mK (k ≤ M); |
initialize the vector of operations ready to be executed Dispo_Op[i, j]=0 for each patient Pj (j ≤ N) and for each operation Oi,j, i ≤ nj; |
FOR (j=1 ;1 ≤ j ≤ N) |
FOR (i=1,i ≤ Maxj (nj)) |
construct the set Ei of operations to schedule from S: |
Ei ={Oi, j / Si, j, k =1, 1 ≤ j ≤ N}; |
classify the operations of Ei according to the chosen priority rule; |
calculate starting times by following the same order given by the classification of Ei according to the formula: |
Dispo_Staff[k]= Fuzzy Availability Processing (Ci,j,k, Evi,j,k); |
ti, j = Max(Dispo_Staff[k], Dispo_Op [j]) such that Si,j,k =1; |
updating of the vector of medical staff members availabilities: |
Dispo_Staff[k]= ti, j + Fuzzy Availability Processing (Ci,j,k, Evi,j,k); |
updating of the vector of treatment tasks availabilities: Dispo_Op [j]= Fuzzy Availability Processing (Ci,j,k, Evi,j,k); |
End FOR |
End FOR |
End |
6.2. Application of the Evolutionary Algorithm
In this step we apply an evolutionary algorithm based on the scheme theory application [25].
In this stage, we generate from the set of assignment constructed above, an assignment scheme to control the genetic algorithm. This scheme is going therefore to represent a constraint that must be respected by the new created individuals. This method consists in considering the assignments SZ given by the earlier scheduling method and to determine (for each operation) the set of possible medical staff members using a genetic algorithm.
The objective is to rapidly find out efficient solutions by starting only from individuals who respect the generated model. So, since the set E, we gather the set of assignments Az (1 ≤ z ≤ cardinal(E)) given by the application of the first steps. Besides, we define the set of medical staff members who may lead to a good scheduling solution. Thus, to limit the blind aspect of genetic operators, in order to obtain a viable chromosome without correction operators, we make genetic manipulations to accelerate convergence. After that, we make tests to check whether the individual respects what the assignment scheme has imposed. Finally, we apply multi-criteria evaluation based on Fuzzy Logic to decide about the solutions.
The crossover operator of our evolutionary approach is a Crossover Mask. The efficient applied coding was inspired from [1] respecting the constraints of our problem.
| Health Crossover Operator Algorithm |
| - Select 2 parents S1 et S2 randomly; |
| - Select randomly 2 integers j and j’ such that j≤j’≤N ; |
| - Select randomly 2 integers i and i’ such that i≤nj and i’≤nj’ (in the case where j=j’, i≤i’) ; |
| - The assignment in f1 must match the same assignments in S1 for the set of operations between the line (i,j) and the (i’,j’); |
| - The rest of assignments in f1 must match the same assignments in S2; |
| - The assignment in f2 must match the same assignments in S2 for the set of operations between the line (i,j) and the (i’,j’); |
| - The rest of assignments in f2 must match the same assignments in S1; |
| - Call to “Starting Time Calculation Algorithm” to calculate the starting and completion times; |
For mutation, we propose artificial mutation operators able to ensure this optimization referring to the criteria previously defined. For example, for the minimization of the response time to health care treatment for patient j, the proposed algorithm is as follows:
Mutation 1: Operator of mutation reducing the response time for treatment for patient j |
- Select randomly an individual S ; |
- Choose the treatment task j whose response time the most long : (Maxj{RTLj such that RTLj =∑i∑k Si,j,k.di,j,k}) ; |
- i=1; r = 0 ; |
- WHILE (i≤nj And r = 0) |
Find K0 such that Si,j,K0 =1; |
FOR (k=1, k≤M) |
IF (di,j,k < di,j,k0) Then {Si,j,K0 =0; Si,j,K =1; r=1 ;} |
End IF |
End FOR |
i=i+1 ; |
End WHILE |
- Call to “Starting Time Calculation Algorithm” to calculate the starting and completion times; |
6.2.1 Formulation of the fuzzy fitness function
We have proved in the second section of this paper that each criterion Cr in our problem has a lower-bound
Multi criteria evaluation of the solutions is carried out using a compromise of all criteria to be optimized in accordance with the predefined weights and on the basis of the lower-bounds. This assessment comes down to the value VG related to the global solution evaluation. It is described by the following formula:
The different weights of the criteria is dynamically calculated by evolving from the kth generation Gk to the generation Gk+1 according to the distance between the mean of the individuals of the generation Gk and the lower-bounds. We aim to improve the solutions by prioritizing objective functions optimization and make the results close to the lower-bounds.
6.2.2 Application Example
We consider the arrival of 4 patients to the PED. This corresponds to 4 patients to treat; each patient treatment corresponds to the execution of a set of health care operations. We have 3 medical staff members charged to treat patients. They have different levels of skills. More details are given in Table 1.
| m1 | m2 | m3 | ||
|---|---|---|---|---|
| P1 | O1 ,1 | 2 | 5 | 4 |
| O2 ,1 | 5 | 4 | 5 | |
| O3 ,1 | 4 | 5 | 5 | |
| P2 | O1 ,2 | 2 | 5 | 4 |
| O2 ,2 | 5 | 6 | 9 | |
| O3 ,2 | 4 | 5 | 4 | |
| P3 | O1 ,3 | 9 | 8 | 6 |
| O2 ,3 | 6 | 1 | 2 | |
| O3 ,3 | 2 | 5 | 4 | |
| O4 ,3 | 4 | 5 | 2 | |
| P4 | O1 ,4 | 1 | 5 | 2 |
| O2 ,4 | 5 | 1 | 2 | |
This table contains the different execution times of the health care operations being executed by different medical staff members. The difference in durations is due to the different levels of skills they have. In fact, the more skilled the medical staff member is, the less time the operation execution takes.
The earliest starting dates and the arrival dates of patients are given in the following table:
| j | 1 | 2 | 3 | 4 |
|---|---|---|---|---|
| rj | 3 | 5 | 1 | 6 |
| entrance | 0 | 1 | 0 | 3 |
The arrival dates of patients correspond to their entrance to the PED. The calculation of γi,j and ri,j is given in Table 3.
| γi,j | ri,j | |
|---|---|---|
| O 1 ,1 | 2 | 3 |
| O 2 ,1 | 4 | 5 |
| O 3 ,1 | 4 | 9 |
| O 1 ,2 | 2 | 5 |
| O 2 ,2 | 5 | 7 |
| O 3 ,2 | 4 | 12 |
| O 1 ,3 | 6 | 1 |
| O 2 ,3 | 1 | 7 |
| O 3 ,3 | 2 | 8 |
| O 4 ,3 | 2 | 10 |
| O 1 ,4 | 1 | 6 |
| O 2 ,4 | 1 | 7 |
• Lower-Bounds Calculation
- 1st criterion:
- 2nd criterion:
- 3rd criterion:
- -
for P1 : (3+1+4+4)=12;
- -
for P2 : (5+2+5+4)=16;
- -
for P3 : (1+4+6+1+2)=14;
- -
for P4 : (6+1+1)=8;
So:
- -
- 4th criterion:
We already have
The different results are summarized in Table IV. For each instance and each weight, we present the values of the lower bound and the values of the criteria for the best solution obtained. In addition, we calculate the overall function and express the gap measuring between the obtained and the optimum solution, defined by the following formula:
| Instances | Ponderations | Lower-Bounds | solutions | VG | ε (%) | |||||||||
|---|---|---|---|---|---|---|---|---|---|---|---|---|---|---|
| w1 | w2 | w3 | w4 | Cr*1 | Cr*2 | Cr*3 | Cr*4 | Cr1 | Cr2 | Cr3 | Cr4 | |||
| I1 | 0.1 | 0.1 | 0.4 | 0.4 | 32 | 11 | 16 | 11 | 32 | 12 | 16 | 12 | 1.02 | 2.09 % |
| 0.1 | 0.5 | 0.2 | 0.2 | 34 | 13 | 17 | 11 | 1.106 | 10.6 % | |||||
| 0.7 | 0.2 | 0 | 0.1 | 35 | 12 | 18 | 11 | 1.078 | 7.8 % | |||||
| 0.6 | 0.1 | 0.2 | 0.1 | 33 | 11 | 17 | 11 | 1.022 | 2.2 % | |||||
| 0.79 | 0.01 | 0.1 | 0.1 | 32 | 12 | 16 | 11 | 1 | 0 % | |||||
| I2 | 0.5 | 0.5 | 0 | 0 | 38 | 18 | 42 | 36 | 38 | 18 | 42 | 36 | 1 | 0 % |
| I3 | 0.5 | 0.5 | 0 | 0 | 38 | 34 | 216 | 143 | 38 | 34 | 216 | 143 | 1 | 0 % |
| I4 | 0.5 | 0.5 | 0 | 0 | 63 | 63 | 315 | 287 | 63 | 63 | 315 | 287 | 1 | 0 % |
Result
Remark:
The best case is when Crq = Cr*q(∀ q ∈ {1, 2, 3, 4}), we therefore obtain VG = 1 and ε (%) = 0%.
The results presented in Table 4 show that the solutions obtained are generally very close to the optimum (according to the selected weights). In the general case, the small gap that is due to the difficulty of the multi-objective optimization, which involves several non-homogeneous criteria and conflict. We therefore conclude the good quality lower-bounds proposed and their suitability to the problem addressed.
7. Simulations and Results
For experimentation, we did observations in the PED, our partner in the project HOST. We considered typical days in 2011-2012-2013characterized by overcrowding. During this period from 2011 to 2013 we noted 47188 visits, 19% of them were hospitalized in the Short-stay Observation Unit (SOU), the other 81% were patients of the Outpatient Care Unit (OCU). We are concerned by the second population responsible of overcrowding phenomenon. Usually, their Length Of Stay (LOS) does not go beyond 8 hours otherwise they are transferred to the SOU. The PED overflows during peak activity periods. The lack of space in the waiting room makes mothers struggled into the narrow corridors of the service with their children and waiting time explodes. Unfortunately, waiting times in the PED can reach up to 5 hours with the strong incoming flows.
Our system is implemented as a decision-making support system designed for medical staff members for patients tracking and monitoring. It helps care providers to take decisions about patients’ treatment management and evaluates the performance of the PED. In fact, thanks to the proposed decision support system each MS member knows the number of patients in the PED, being treated or waiting for treatment and follows the evolution of patients’ treatment process. Thus, practitioners are more likely able to satisfy patients’ needs.
Our software is a more flexible tool where we can modify and act directly thanks to a more ergonomic interface. For the development and simulation of results, we chose Java in eclipse for several reasons: the existence of a good support for this language, an active community and rich libraries whose Swing API offers a friendly and ergonomic graphical support since the appearance of graphic elements fits with the host operating system. In addition, Java supports portability, this is a language that is constantly evolving and that enables integration of Web services.
In the following section we will present a scenario to detail the functioning of our software already implemented in the PED.
• Simulation Scenario
The access to the PED Jeanne de Flandre database has followed a privacy protocol. We have recovered for each patient a certain number of information: Age, sex, mode of arrival, diagnosis, the exact entry and exit dates that enabled us to deduce the length of stay, the date of the first consultation and finally the orientation or hospitalization.
To solve the MHCTS in the PED, we propose the following illustrative example. We will detail the different aspects and logic adopted by our decision support system. Our initial situation is a waiting room with patients already signed up with the registration nurse. In treatment rooms there are medical staff members executing health care operations corresponding to several patients. The table below represents the patient database. We choose a sample from the database given above. It contains 10 patients who arrived at the PED in 27th of November 2013. To each patient correspond a pathology, an emergency degree and an arrival date. Patients’ information is requested by a nurse and processed into our system. Data received by the reception nurse passes through a pathology test in order to collect several data including emergency degree and needed resources. These data will be used to generate a priority degree giving patients positions in the waiting queue. The position is generated using the proposed scheduling algorithm.
| id | patientID | name | pathology | level | arrivaldate | exitdate |
|---|---|---|---|---|---|---|
| 8 | 8732 | Patient7 | concussion | 3 | 2013-11-27 20:36:00 | 0000-00-00 00:00:00 |
| 10 | 1112 | Patient10 | concussion | 2 | 2013-11-27 20:35:00 | 0000-00-00 00:00:00 |
| 7 | 5543 | Patient2 | gastroenteritis | 1 | 2013-11-27 20:33:00 | 0000-00-00 00:00:00 |
| 9 | 9876 | Patient8 | gastroenteritis | 1 | 2013-11-27 20:32:00 | 0000-00-00 00:00:00 |
| 6 | 9986 | Patient1 | compoundfracture | 1 | 2013-11-27 20:31:00 | 0000-00-00 00:00:00 |
| 4 | 1223 | Patient6 | compoundfracture | 5 | 2013-11-27 20:30:00 | 0000-00-00 00:00:00 |
| 5 | 3332 | Patient3 | gastroenteritis | 3 | 2013-11-27 20:23:00 | 0000-00-00 00:00:00 |
| 1 | 4521 | Patient9 | compoundfracture | 5 | 2013-11-27 20:22:00 | 0000-00-00 00:00:00 |
| 3 | 9875 | Patient5 | concussion | 2 | 2013-11-27 20:16:00 | 0000-00-00 00:00:00 |
| 2 | 5646 | Patient4 | gastroenteritis | 2 | 2013-11-27 20:10:00 | 0000-00-00 00:00:00 |
Patients Data base
For pathologies, we chose 3 items: concussion, gastroenteritis and compound fracture. To each pathology corresponds a list of health care operations is defined. We attribute 1 to the cells corresponding to operation which must be done at first, 2 for the next operations and 3 for the last ones. We do not sort operations in the same group of attributes. (Table 6)
| id | designation | glassgow | hydration | tempreture | heartrate | bloodpressure | respiratoryfrequency | cerebralscanner | bacteriologicaltest | radiothorax | neurologicaltest | fracturescore | bloodtest | skeletonradio |
|---|---|---|---|---|---|---|---|---|---|---|---|---|---|---|
| 1 | concussion | 1 | 0 | 1 | 1 | 1 | 1 | 3 | 0 | 3 | 2 | 0 | 2 | 0 |
| 2 | gastroenteritis | 0 | 1 | 1 | 1 | 1 | 1 | 0 | 2 | 3 | 0 | 0 | 1 | 0 |
| 3 | compoundfracture | 0 | 0 | 1 | 1 | 1 | 1 | 0 | 0 | 0 | 0 | 1 | 2 | 1 |
P
The table below gives details about health care operations to be executed in order to treat patients. The third column represents the execution time (in seconds) related to each operation. The four last columns correspond to the score of medical staff member able to execute the health care operation. The highest score means that the medical staff member is the most suitable for the operation performance.
| id | operationname | executiontime | Doctorscore | Nursescore | Auxscore | Radiologistscore |
|---|---|---|---|---|---|---|
| 1 | glassgow | 500 | 3 | 1 | 0 | 0 |
| 2 | hydration | 1000 | 3 | 2 | 0 | 0 |
| 3 | tempreture | 500 | 3 | 3 | 2 | 1 |
| 4 | heartrate | 1000 | 3 | 3 | 0 | 0 |
| 5 | bloodpressure | 300 | 3 | 3 | 1 | 0 |
| 6 | respiratoryfrequency | 600 | 3 | 3 | 0 | 0 |
| 7 | cerebralscanner | 1200 | 2 | 1 | 0 | 3 |
| 8 | bacteriologicaltest | 500 | 2 | 1 | 3 | 0 |
| 9 | radiothorax | 1200 | 1 | 1 | 0 | 3 |
| 10 | neurologicaltest | 2000 | 3 | 1 | 0 | 0 |
| 11 | fracturescore | 500 | 3 | 3 | 0 | 0 |
| 12 | bloodtest | 300 | 1 | 1 | 3 | 0 |
| 13 | skeletonradio | 1000 | 1 | 0 | 0 | 3 |
Health Care Operations Database
If score=3 then the medical staff member has the needed level of experience, he is the most suitable for this operation execution. However, if this medical staff member is not available, we can choose another medical staff member with a lower score (2 or 1). If the score=0, the health care operation cannot be executed by a medical staff member without the minimum level of experience. For the medical staff details, they are given in the table below:
| id | staffID | function | availibility | treatskill | nurseskill |
|---|---|---|---|---|---|
| 1 | 1501 | Doctor-1 | 0 | 3 | 2 |
| 2 | 1601 | Nurse-1 | 0 | 1 | 3 |
| 3 | 1701 | Aux-1 | 1 | 0 | 1 |
| 4 | 1801 | Radiologist-1 | 0 | 0 | 0 |
| 5 | 1502 | Doctor-2 | 0 | 3 | 2 |
| 6 | 1503 | Doctor-3 | 1 | 3 | 2 |
| 7 | 1504 | Doctor-4 | 1 | 3 | 2 |
| 8 | 1602 | Nurse-2 | 0 | 1 | 3 |
| 9 | 1603 | Nurse-3 | 0 | 1 | 3 |
| 10 | 1702 | Aux-2 | 1 | 0 | 1 |
Medical Staff Member Data base
The medical team of the Pediatric Emergency is as follows: 2 care pediatricians (specialists), 1 internal general medicine, 2 Internal Pediatrics, 1 surgical intern, 2-3 nurses and 2 childcare assistants. To each medical staff member corresponds an availability parameter; it is equal to 1 when the health care provider is available at the time of simulation, 0 when he is executing a health care operation. This parameter is updated through the whole process when the situation of the medical staff changes.
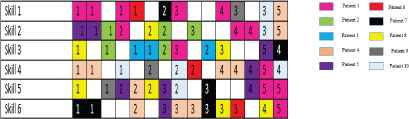
In the table below are represented the set of patients, the corresponding health care operations and the needed skills for their execution. For each patient, we have a maximum of five health care operations are executed by the medical staff members, and for its execution a level skill is needed. In the studied case we have six different skills.
| Operation 1 | Operation 2 | Operation 3 | Operation 4 | Operation 5 | |
|---|---|---|---|---|---|
| Patient 1 | C1x2 | C1 and C2 | C1 and C3 | C1 and C2x2 | C4, C5x2 and C6 |
| Patient 2 | C2 and C3 | C2 and C3 | C2 | No operation | No operation |
| Patient 3 | C3x2 | C3 | No operation | No operation | No operation |
| Patient 4 | C4x2 | C5 and C6 | C6x2 | C4x2 | C1 and C2 |
| Patient 5 | C2x2 | C5 | C5 and C6 | C4 and C5 | C3 |
| Patient 6 | C1 | C4 | C6 | No operation | No operation |
| Patient 7 | C6x2 | C1 | C5 and C6 | C3 | No operation |
| Patient 8 | C3 and C5 | C2 and C5 | C3 and C6 | C6 | No operation |
| Patient 9 | C5 | C4 | C1 | No operation | No operation |
| Patient 10 | C4 | C4 and C5 | C1 and C2 | C4 | No operation |
Skills Table
We tested the proposed approach on the four available instances. Overall, the algorithm is able to give satisfying solutions which were better than all the solutions produced by the health care practitioner. However, because the approach encloses different parameters, our goal is to analyze the impact of each parameter of the algorithm to define the best configuration to adopt. The parameters set are varied in series of values to extract the best value corresponding to each parameter. For each instance, the best solution in the population is chosen as the representative for each test.
The maximum number of generations in our genetic algorithm is a key parameter of the method. Decreasing or increasing it would impact the number of generations and the challenges of producing new solutions.
Figure 4 presents the results when varying the number of generations between n and 2n. The y-axis represents the aggregative objective function, a sum of the four defined weighted criteria. The columns in grey represent the results when the number of generations set to n and in black when the number of generations is set to 2n. The figure shows that running the algorithm with 2n does not help find better solutions. Out of four instances, 2n is worse than n three times. This can be explained by the problem complexity for the considered instances and the existence of splittable and non-splittable health care operations.
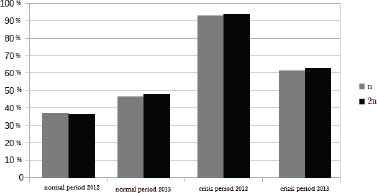
Impact of The Number of Generations on the Four Instances.
On the other hand, increasing the number of maximum iterations has an influence. The run time can increase with at least 10% if the maximum number of iterations is doubled. This is in fact a draw back for some emergency departments as they seek to have a tasks scheduling in the less time possible.
The probability of applying the local search (assignment process) can be a key factor in our approach. Table VI shows the effects on the four instances with the different values of pm. These values are considered to test whether a high probability would enhance the algorithm. Columns 0.1, 0.4, 0.5 and 0.6 present the tested values of pm. Each column contains two columns: the rum time (CPU) in seconds and the quality of the solution (Cost). The default value for pm being 0.1, fallouts show increasing the probability of calling the local search is not always beneficial. This can be explained by the fact that calling the local search more frequently does not necessary improve the best solution in the population.
| 0.1 | 0.4 | 0.5 | 0.6 | |||||
|---|---|---|---|---|---|---|---|---|
| CPU | Cost | CPU | Cost | CPU | Cost | CPU | Cost | |
| Normal situation 2012 | 55.318 | 0.3287 | 53.903 | 0.3639 | 55.749 | 0.3319 | 51.099 | 0.3618 |
| Normal situation 2013 | 74.431 | 0.6073 | 77.871 | 0.6267 | 61.722 | 0.6226 | 83.289 | 0.6207 |
| Crisis situation 2012 | 93.689 | 0.9067 | 102.6 | 0.9318 | 103.13 | 0.9500 | 98.456 | 0.9458 |
| Crisis situation 2013 | 151.66 | 0.4525 | 143.61 | 0.4935 | 200.5 | 0.4648 | 143.32 | 0.4664 |
Impact Of pm On The Four Instances
This shows that the impact of the probability on the best solution is usually not considerable as the most important part is the local search itself. It is also worth noting that increasing the probability does not impact the run time. pm is the probability using local search operators.
The proposed multi-skill scheduling applied has given the Gantt of figure 5. This practical problem consists of a mix of classical constraints that can be found in the benchmarks of the literature and a set of new constraints.
Gantt
In particular, the new constraints (hard and soft) consider health care operations that take place on multiple sites of the PED. The hard constraints forbids medical staff from treating patients in two overlapping periods and rooms from being used more than once in two overlapping periods. Splittable health care operations are also managed using hard constraints. The new soft constraint imposes a penalty when for example a patient has to be treated in the corridor in an overcrowding situation.
The approach was tested on four available instances. A parameter tuning was performed to determine the best parameter settings for the approach. The tuning results showed that the probability of applying the local search and the size of the population does not have a big impact on the instances. The results also showed that the proposed approach outperforms the approach currently used by the health care practitioner.
When we start the simulation the different databases are loaded. Our software includes managing interfaces covering essentially a Main Interface which allows administrator to visualize the different transactions and interactions in our system, a Theater (PED) Interface describing our PED architecture with different compartments and showing an animation representing medical staff paths while executing health care tasks and patients pathways and an Indicators Interface used to monitor the status of the different actors in the PED (figure 6).
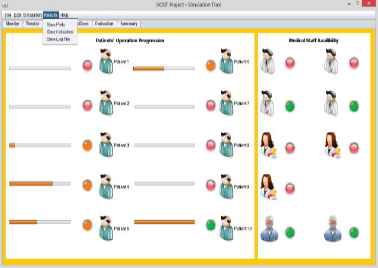
Indicators Interface
In fact, the first panel shows the evolution of patients’ treatment process; at the beginning, while the patient is still in the waiting room, the corresponding led is red. When the treatment of the patient starts, the indicator becomes orange and it increases with each completed operation. When the last operation is completed, the indicator becomes green, the patient is thus ready to leave the PED. In the second panel we monitor medical staff availabilities. Indeed, the red color indicates that the corresponding medical staff member is already executing a health care operation and the green color indicates his availability. We have as well the Evaluation Interface representing the evolution of patients’ pathways and the health care activities being completed for each patient. The parallel line to x-axis represents the time spent in the PED. For example we have in the figure 7, 6 patients; the first one has arrived first, then patient 2, then patient 3, then 4 and then 5 and 6. At t=t1, the length of stay of the first patient is the highest one, so he needs attention. However, the last patient has already arrived, so if his emergency degree is not high, we consider that he undergoes the normal treatment process and there is no need to worry about him at the moment.
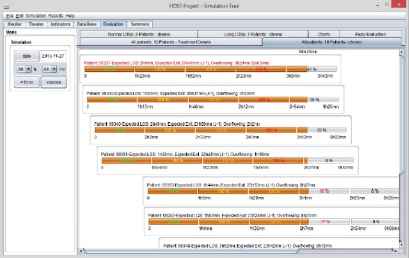
Evaluation Interface
This tracking helps to know at each moment how many patients we have as well as the evolution of their treatment process. It also improves the service quality and information delivery through indicating the length of stay of each patient in the PED. Figure 7 represents a comparison between patients’ treatment time with/without using our approach. It corresponds to the time spent in the PED by each patient (treatment time = exit date-entrance date). The graph shows a decrease of the time that patients spent in the PED. The last green shape represents the average treatment time of patients. The comparison shows a reduction of the average time spent in the PED.
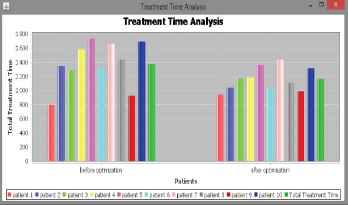
Treatment Time Analysis
In figure 9 we compare results with/without using our approach. We made some tests using our approach, the results reveals a waiting time minimization.

Waiting Time Analysis
The graph of figure 9 represents a comparison between patients’ waiting time using our approach and the normal waiting time according to the data base with real statistics. It shows that waiting time takes an average wait less than 10 minutes using our approach. So, the main goal which is patients waiting time reduction is accomplished.
8. Conclusion
We have proposed in this paper a Health Information System (HIS) providing support services to the decision for practitioners and managers in the emergency department in order to reduce and solve the problem of peaks of activity and overcrowding. Thus, they can improve the performance on the one hand and the satisfaction of the other patients. However, this system does not offer any final decisions. It has additional support to provide greater visibility on the PED activity and detect any abnormalities.
In this paper, our interest was to study and develop an interactive scheduling approach based on an evolutionary algorithm. We proposed lower-bounds to facilitate quality assessment problem of possible solutions of MHCTS. These values predict specific limits for the optimal values of the criteria. Indeed, the application example showed that the gap between these limits and criteria values obtained for the solutions generated by the fuzzy evolutionary algorithm is often low. This result is very interesting to facilitate the study of multi-criteria concepts. Finally, simulations have proved that our proposed approach improves the performance of the proposed medical staff scheduling system.
References
Cite this article
TY  - JOUR
AU  - Sarah Ben Othman
AU  - Slim Hammadi
PY  - 2017
DA  - 2017/01/01
TI  - A Multi-criteria Optimization Approach to Health Care Tasks Scheduling Under Resources Constraints
JO  - International Journal of Computational Intelligence Systems
SP  - 419
EP  - 439
VL  - 10
IS  - 1
SN  - 1875-6883
UR  - https://doi.org/10.2991/ijcis.2017.10.1.29
DO  - 10.2991/ijcis.2017.10.1.29
ID  - Othman2017
ER  -