
Analysis Method of Lactoferrin Based on Uncoated Capillary Electrophoresis
- DOI
- 10.2991/efood.k.210720.001How to use a DOI?
- Keywords
- Capillary electrophoresis; lactoferrin; analytical method; auxiliary air pressure; surfactant
- Abstract
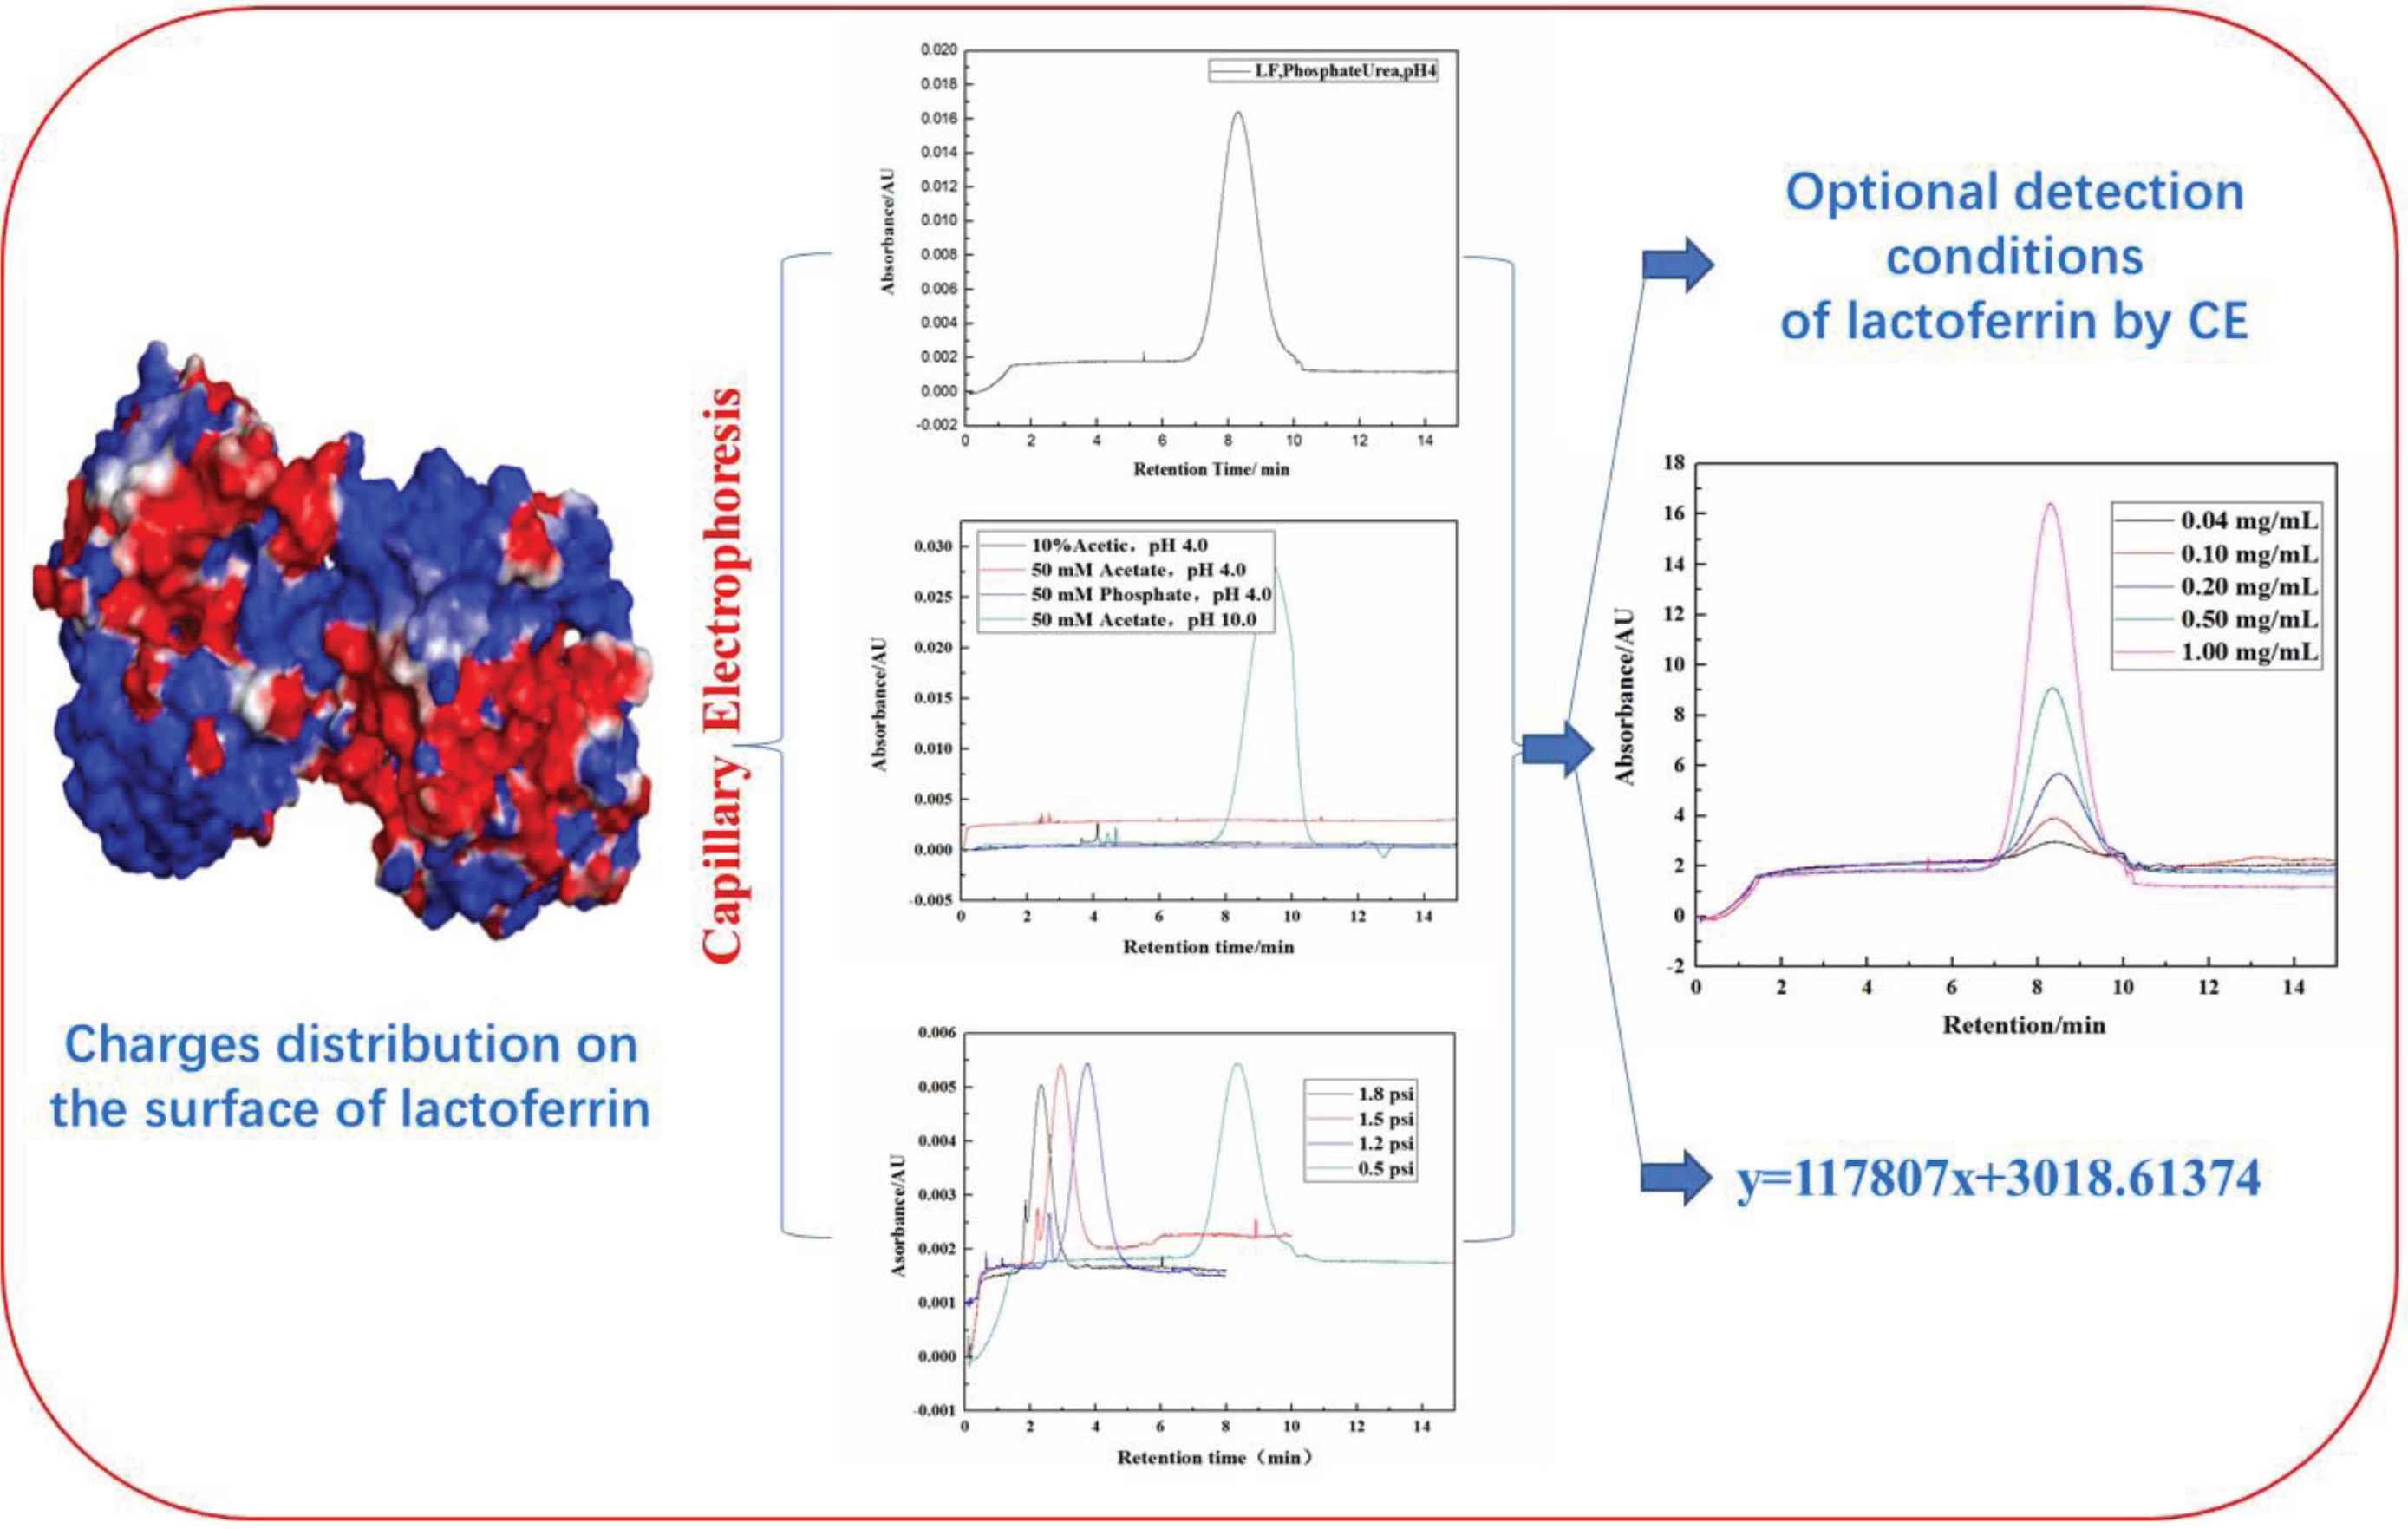
The analysis of lactoferrin separation will be an important application in prospect. To develop a new strategy for the detection of lactoferrin, this work adopted the method of uncoated Capillary Electrophoresis (CE), through optimizing the parameters of background electrolyte, pH, surfactant, buffers of the system solution. The optimum lactoferrin separation by CE is 50 mM phosphates buffer added 6M urea. In positive voltage, lactoferrin was separated by CE at pH 4.0. In reverse voltage, lactoferrin can also be separated at pH 10.0 with 50 mM ammonium ace. The auxiliary air pressure was got involved to decrease the absorption by silica capillary through a range of gradient intensity of air pressure. By comparison with 1.2, 1.5 and 1.8 psi, the pressure of 0.5 psi can significantly alleviate the absorption. The best detection conditions of lactoferrin were obtained, which are pH 4.0, 50 mM phosphates with 6M urea, 0.5 psi auxiliary air pressure with the limit of quantification at 0.04 mg/mL and the limit of detection at 0.01 mg/mL. Finally, lactoferrin can be quantitatively detected well and effectively, which the standard curve is y = 117807x + 3018.61374.
- Graphical Abstract
- Copyright
- © 2021 The Authors. Publishing services by Atlantis Press International B.V.
- Open Access
- This is an open access article distributed under the CC BY-NC 4.0 license (http://creativecommons.org/licenses/by-nc/4.0/).
1. INTRODUCTION
Lactoferrin belongs to the transferrin family and has been identified in saliva, tears, mucus, pulmonary secretions, white blood cells and semen of mammals [1–4]. Lactoferrin has been widely studied in terms of its structure and biological activity. Lactoferrin is a protein composed of two leaves left and right in four polypeptide structures [5]. It is a highly glycosylated glycoprotein, and its glycosylated site is on Asn of N-terminal [6]. The main metal ions bound with lactoferrin are Fe2+ and Fe3+. More and more evidence showed that lactoferrin has important biological activities, such as antibacterial, antiviral, anti-inflammatory, antihypertensive, antioxidant, cell proliferation and differentiation, phospholipid metabolism regulation and immune regulation [5–11]. In addition, because of its iron-binding properties, lactoferrin can be a potential source of iron for breastfeeding infants. The U.S. FDA, Food Safety Commission of Japan and relevant authorities in other countries have also approved a simple and non-toxic synthesis of lactoferrin capsules for use as food additives [12,13]. The content limit of lactoferrin in milk products in China is 1.0 g/kg. Liquid chromatography-ultraviolet method is the main detection method for lactoferrin in the national standard in China, which the Limit of Detection (LOD) is 0.6 mg/mL [14]. According to previous reports, there are many methods to detect lactoferrin, including SDS_PAGE electrophoresis, Enzyme-Linked Immunosorbent Assay (ELISA), Reversed-Phase High-Performance Liquid Chromatography (RP-HPLC), Refractive Index Detector (RID), Surface Plasmon Resonance (SPR) and Capillary Electrophoresis (CE). SDS_PAGE electrophoresis is a traditional method for protein identification, but it requires complex and time-consuming sample pretreatment [15]. Although ELISA has high sensitivity and versatility, its repeatability is relatively poor, so there are few reports on the detection of lactoferrin by this method [16]. Lactoferrin of goat milk and their products from simulated digestion was detected by the HPLC method [17]. In low concentrations, however, the method of detection sensitivity and resolution performance is still lack, which the LOD of lactoferrin is higher than 0.05 mg/mL. What’s more, due to the different state of iron, lactoferrin can be divided into three subtypes (Natural, apo and holo lactoferrin) [18]. Iron ion will be changed with the RP-HPLC mobile phase gradient elution condition shifted, so the different environmental conditions may, in turn, affect the separation performance of the method [14,17,19,20]. HPLC-MS spectrometry has high sensitivity and selectivity in the application of analysis and detection, but due to the high detection cost of mass spectrometry, there are certain limitations on the quality control of sample detection [21]. The RID method has been used in clinical medicine and biology for many years, but is less accurate because of the complex composition of food, the immune reaction is easy to cause cross reaction, resulting in false positive results [22]. SPR technology developed in recent years is a real-time, unlabeled and automatic detection method, which has also been applied to the detection of lactoferrin in bovine colostrum, milk and formula milk powder [23,24]. However, this technique is based on biosensor immunoassay, expensive chips due to hard use on a large scale [25].
Though, capillary electrophoresis has been used since 1980, it has been widely used in detection analysis, such as detection of nucleic acids and proteins since its development. Capillary Zone Electrophoresis (CZE) is the most economical and commonly used separation method [26]. It works by applying a strong voltage to the capillary tube to separate electrically charged molecules utilizing a direct current electric field [27]. Capillary electrophoresis can quickly separate peptides of small molecules, whereas proteins electrovalently bound sites on their surface that can significantly bind to the silanol group on the capillary wall so that they cannot be separated. Therefore, in CE, excessive sample injection will show the phenomenon of zonal widening and unsymmetrical separation peak type. To tackle this problem, for many years, scientists have tried to use a coating of the inner capillary, or add various surfactants into separation buffer to eliminate the adsorption of silanol groups on the uncoated capillary wall. Urea, SDS, Triton and MHEC [28–32] are commonly used. In this paper, except for surfactant, the pH value, organic solvent, buffer, auxiliary air pressure and other conditions were optimized, and the rapid and stable analysis of lactoferrin was finally determined. It is worth mentioning that the regulation of auxiliary air pressure investigated in this paper can reduce capillary adsorption, and air pressure is a parameter rarely reported in previous studies. The results of this study are intended to provide a new perspective for the separation of lactoferrin by CE.
2. MATERIALS AND METHODS
2.1. Materials and Chemicals
The purity of lactoferrin powder (purchased from Sigma, USA) is more than 95%. Acetonitrile (Spectrum Chemical, USA), acetic acid amine (Aladdin Industrial Corporation, Shanghai, China), SDS (Sangon Biotech Shanghai Co., Ltd., China), Triton X-100 (Sigma), Tris (BBI Life Sciences, Shanghai, China), acetic acid, phosphates, hydrochloric acid, sodium chloride, sodium hydrogen phosphates, sodium dihydrogen phosphates are bought from Aladdin Industrial Corporation.
2.2. Sample Preparation
Lactoferrin was weighed with an analytical balance. And the sample was added to the buffer system and dissolved by a vortex until the solution was clarified. Finally, the sample was filtrated through a 0.22-μm filter with a syringe before injection. Both capillary rinsing reagent and Background Electrolyte (BGE) require ultrasonic degassing in advance.
2.3. CE Method
The uncoated fused capillary, inner diameter of 50 μm, outer diameter of 75 μm, length of 61.2 cm, actual length of 51.2 cm, was carried by a capillary electrophoresis apparatus (Beckman CESI 8000 plus, USA). Before each injection, the capillary tubes were washed and balanced by the following methods: 0.1M NaOH washed the capillary tubes for 3 min at 70 psi, 0.1M HCl washed the capillary for 1 min. Then, the capillary was washed with double distilled water for 1 min. Finally, the capillary was washed with BGE for 5 min. Injection mode: 0.5 psi air pressure for 10 s. The separation voltage was +25 kV at 20°C, and the temperature was inclined to rise for 0.5 min. Auxiliary pressure of 0.5 psi was separated for 20 min, and the detection wavelength was 214 nm.
2.4. Optimization of Qualitative Analysis of Lactoferrin by CE
2.4.1. pH
Under the condition of 50 mmol/L phosphates added with 6 mol/L urea, the pH of 4, 6, 7 and 8.9 were adjusted respectively to observe the effect on the detection sensitivity of lactoferrin.
2.4.2. BGE systems
To investigate the influence of surfactant on the detection effect, the following eight BGE systems were set up: 50 mmol/L phosphates solution was added with different kinds of surfactants: (a) 6 mol/L urea; (b) 5 mmol/L Triton X-100; (c) 0.2% SDS; (d) 200 mM Tris with 2% SDS; (e) 50 mM ammonium acetate added 5 mM Triton X-100; (f) 50 mM phosphates with 6M urea and 5 mM Triton X-100; (g) 50% acetonitrile was added with 50 mM phosphates (1:1, volume ratio); (h) 50 mmol/L acetate solution added with acetonitrile (1:1, volume ratio). The pH values of the above BGE systems a–c, e–h were all 4.0, and the forward voltage detection of CE was adopted. 50 mmol/L acetate solution, pH 4.0; The pH of BGE system d was adjusted to 11.0, which was adopted reverse voltage detection. Under the condition of pH 4.0, the effects of 10% acetic acid solution, 50 mmol/L ammonium acetate solution (pH 4.0 forward voltage, pH 10.0 reverse voltage) and 50 mmol/L phosphates solution on the detection effect were investigated.
2.4.3. Auxiliary air pressure
At the same time, the 50 mmol/L phosphates solution was added with 6 mol/L urea at pH 4.0, assisting 0.1, 0.2, 0.5, 1.2, 1.5 and 1.8 psi pressure, respectively. Then the effect of auxiliary air pressure on the detection effect is investigated.
2.5. Quantitative Analysis of Lactoferrin
The LOD/Limit of Quantification (LOQ) was determined at 3 and 10 Signal-Noise ratio (S/N) by 12 times, respectively. The analytical balance was used to weigh lactoferrin. The 10 mL lactoferrin reserve solution with the concentration of 1.0 mg/mL was allocated, which was gradually diluted the samples into 1.0, 0.5, 0.2, 0.1 and 0.04 mg/mL. The method in Subsection 2.2 was used to conduct protein separation program, and the determination for each sample were repeated for three times. 32 karat software (Beckman, USA) was used to analyze the integral function of the data, and the relative concentration was quantified by the integral area at the peak time.
2.6. Electrostatic Potential of Lactoferrin Calculated by Discovery Studio
Lactoferrin conformation (PDB entry: 1BLF) was prepared by Discovery Studio (2016, BIOVIA, USA). In brief, the conformation was cleaned and the water molecules were removed. The missing residues of the loop were supplemented base on the SEQRES records (http://www.wwpdb.org/) [33]. After that, the surface charge of lactoferrin was calculated by the program of Electrostatic Potential.
3. RESULTS AND DISCUSSION
3.1. Effect of pH on Qualitative Detection of Lactoferrin
When 50 mmol/L phosphates were added with 6 mol/L urea, the retention time of lactoferrin in capillary tubes was delayed with the increase of pH. This is because the closer system pH to the isoelectric point, the smaller the relative charge on the surface is. Therefore, under the condition of constant electric field pressure, the smaller the driving force, the smaller the electromigration is. The longer retention time, and the smaller the relative integral area is. In addition, the isoelectric point of lactoferrin is about 8.9. Although the relative charge on the surface of the system is small at this pH, it can still drive the migration under the field intensity. In this study, the electrostatic potential of lactoferrin was calculated using a molecular dynamic program. There are some positive charge regions on the surface at pH 4.0, shown in Figure 1. However, the higher the pH, the smaller the integral area is. Results in Table 1 shows that the retention time of lactoferrin was 7.092 min, which was the shortest. Therefore, a comprehensive judgment shows that pH 4.0 is further away from the isoelectric point of lactoferrin. The more ideal charged state on its surface, the more favorable for lactoferrin to migrate in the capillary.
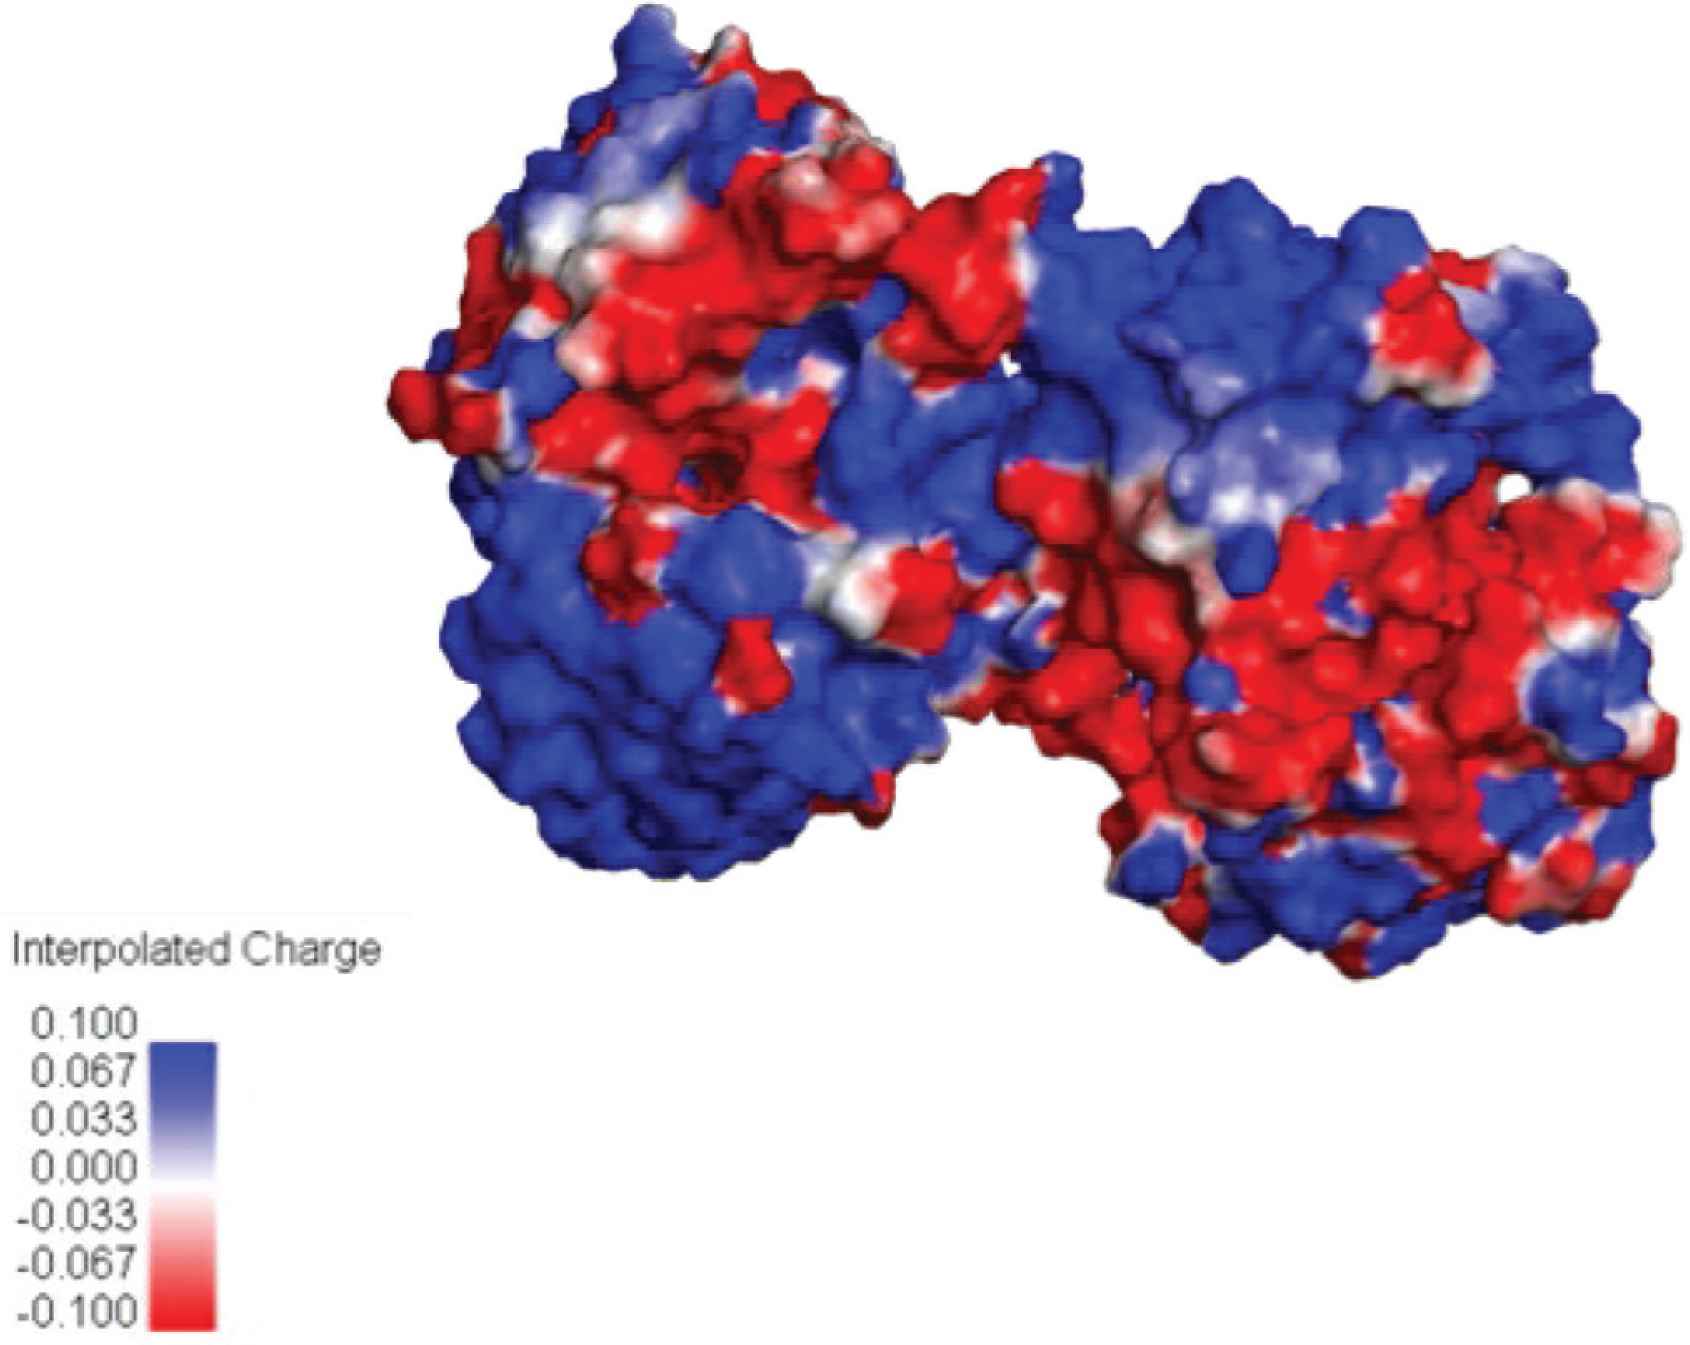
The electrostatic potential of lactoferrin calculated by Discovery Studio. The charge of surface was valued from −1 to +1, which was represented by red and blue respectively.
| pH | Peak width | Retention time | The integral area |
|---|---|---|---|
| 4.0 | 3.2 | 7.092 | 43971742 |
| 6.0 | 2.8 | 8.904 | 15756019 |
| 7.0 | 2.4 | 9.150 | 8948407 |
| 8.9 | 3.0 | 9.200 | 6554894 |
Comparative analysis of lactoferrin detection with different pH
3.2. Effect of Surfactant on the Qualitative Detection of Lactoferrin in Forward Voltage of CE
Adding surfactant and organic solvent into the BGE of capillary electrophoresis can change the dissolved state of the protein in the system, relieve the adsorption of the large protein to the capillary wall, and facilitate the separation and detection. As can be seen in Figure 2, only urea can achieve good detection and has a good peak shape for BGE with different surfactants and organic solvents. Urea has been added to the BGE system in many studies of whey protein in capillary separation of dairy products. This may be because the high concentration of urea can break hydrogen bonds, increase the solubility of hydrophobic amino acids in the water phase and reduce the adsorption phenomenon. The addition of Triton X-100 will lead to the solvent peak followed by the main peak, and the addition of SDS will lead to the peak type asymmetry and abnormal peak [3,34]. Triton, as a nonionic surfactant, can alleviate electroosmosis in dynamically coated capillarity, but this result shows that it may not improve the peak shape. However, the addition of organic solvent can lead to solvent peak, or bifurcation and trailing, and the organic solvent can cause the change of polarity in the system, thereby affecting the stability of lactoferrin dissolution. This result has also been proved in peer studies [18,25]. For comprehensive consideration, adding 6 mol/L urea to 50 mmol/L phosphates at pH 4.0 was the most advantageous among all alternatives for the detection of lactoferrin.
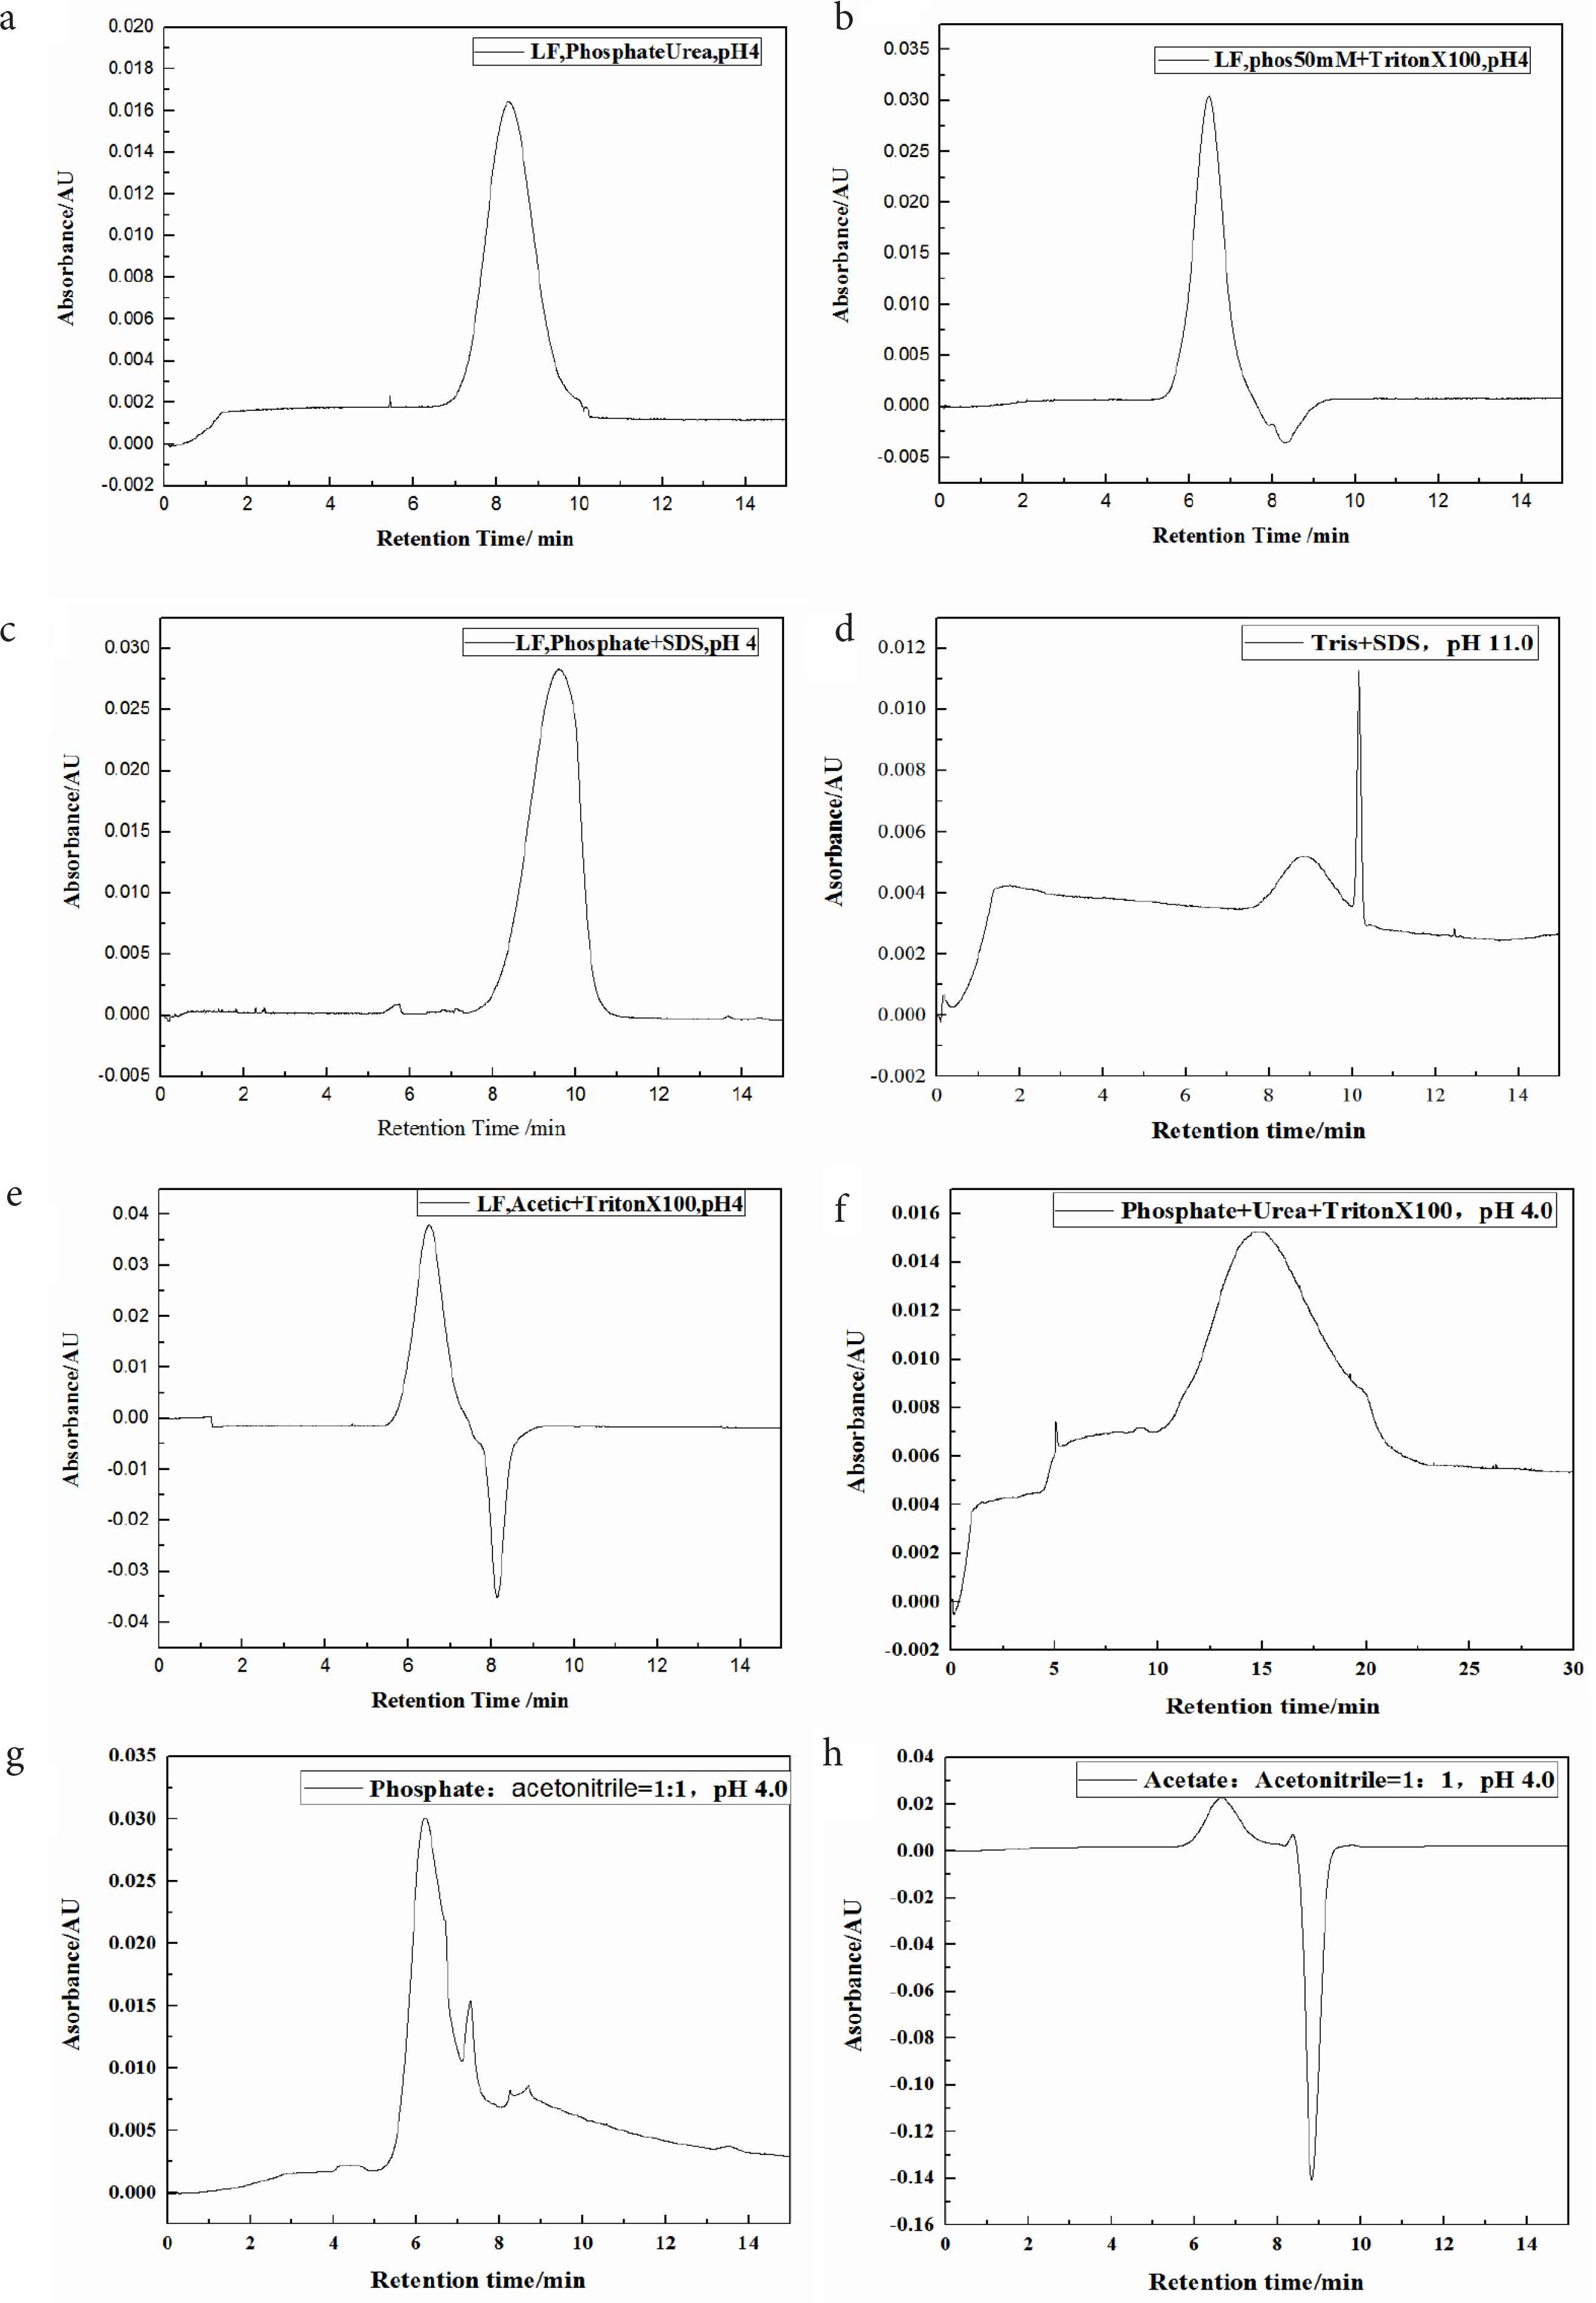
Lactoferrin spectra of different additive detection. (a–c), 6M urea, Triton X-100 of 5 mM, 0.2% SDS were added to phosphates of 50 mM at pH 4.0. (d) 200 mM Tris with 2% SDS, pH 11.0. (e) 50 mM ammonium acetate added 5 mM Triton X-100, pH 4.0; (f) 50 mM phosphates with 6M urea and 5 mM Triton X-100, pH 4.0; (g and h) 50% acetonitrile was added with 50 mM phosphates and 50 mM ammonium acetate, respectively, at pH 4.0.
3.3. Qualitative Detection of Lactoferrin in Backward Voltage of CE
It has been proved by the theory that when the pH of the system is higher than the isoelectric point of the protein, the protein in the system will have a negative charge, so it can repel the ionized and negatively charged capillary wall without adsorption. In this case, the reverse voltage of capillary electrophoresis would be conducive to the protein movement. It has been reported in the literature that the separation of 12 amino acid synthetic peptides was realized on reverse voltage [35]. In this study, lactoferrin was also detected at a reverse voltage of −25 kV by using an amine acetate system with pH 10.0 and without surfactant added. However, another three buffers at pH 4.0, in forward voltage, without any surfactant system, cannot separate lactoferrin. It suggests that at the pH below the isoelectric point, the surface of the protein positively charged, so lactoferrin cannot be separated through uncoated capillary on forward voltage in absence of surfactant, as shown in Figure 3.
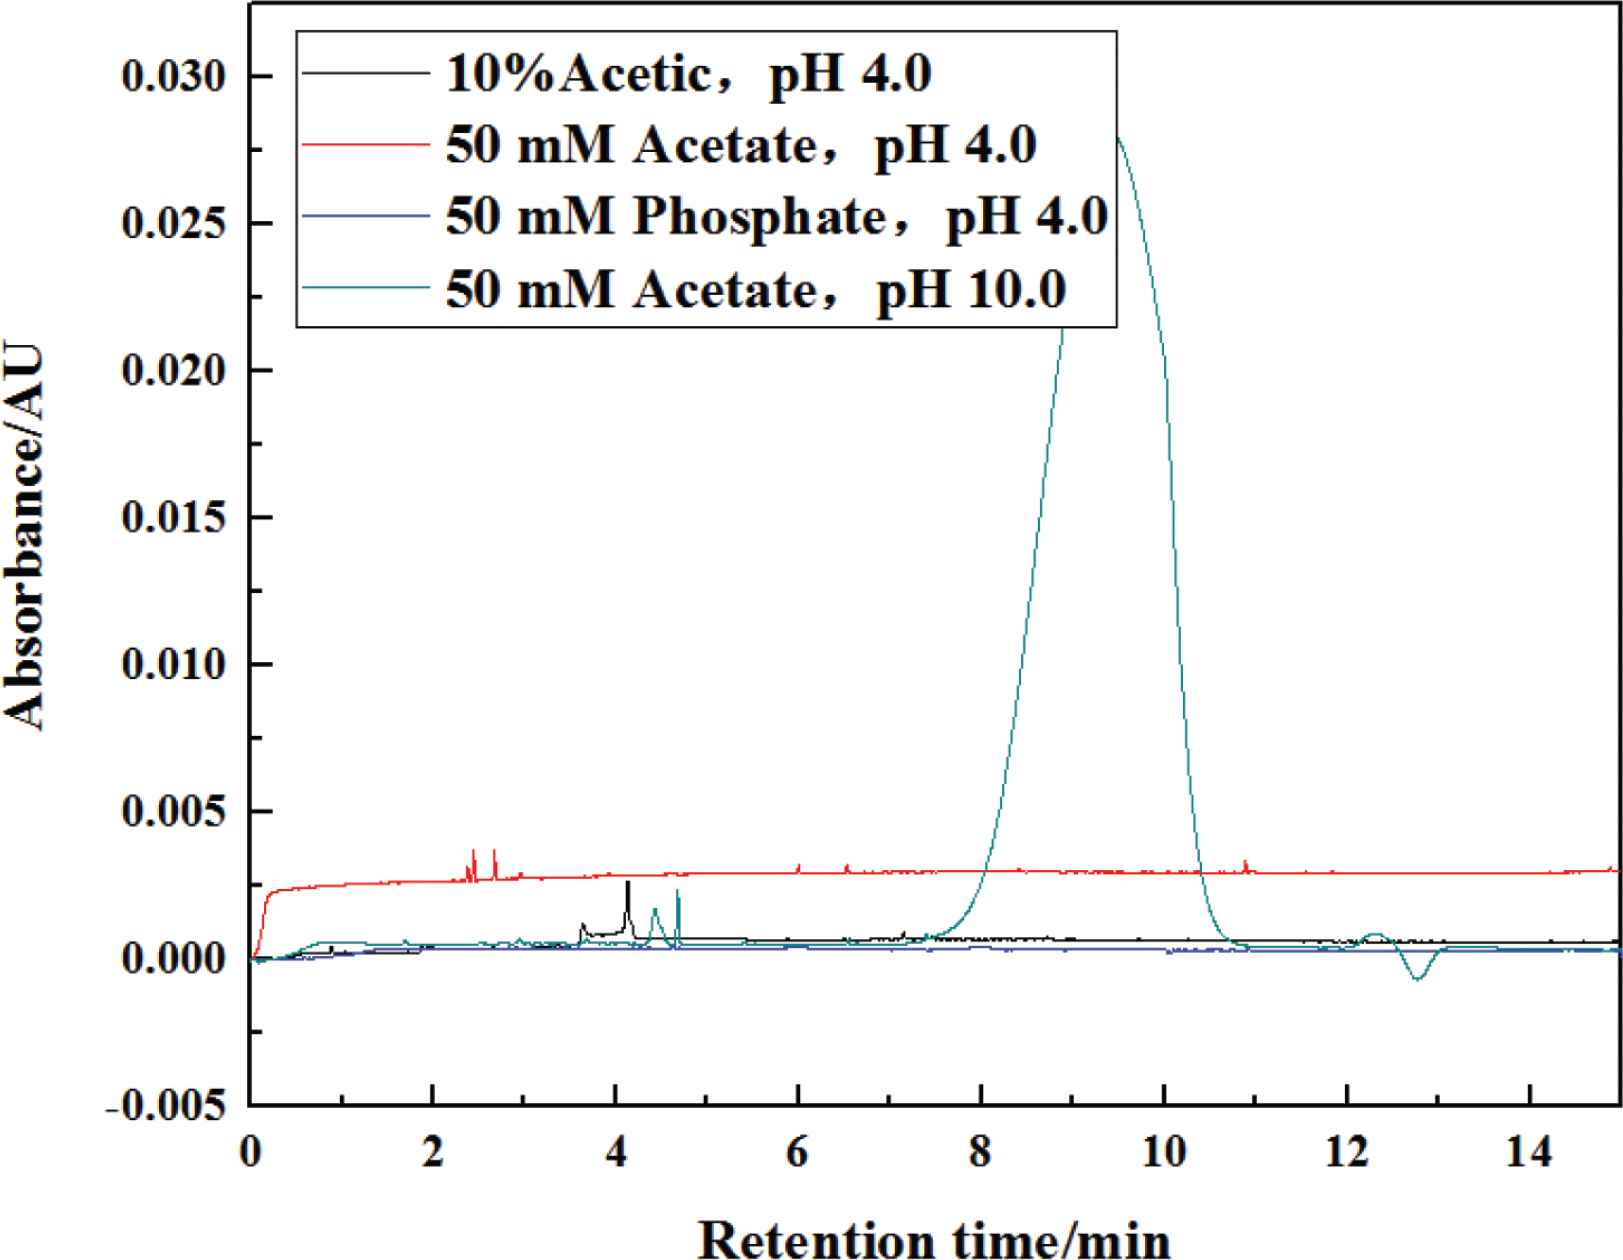
Lactoferrin spectra of detection in reverse voltage with acetic amine system at pH 10.0. The 50 mmol/L ammonium acetate and pH 10.0 system was tested by reverse voltage, while the 10% acetic acid, 50 mM ammonium acetate and 50 mM phosphates system were tested by forward voltage at pH 4.0.
3.4. Effect of Auxiliary Air Pressure on Lactoferrin Detection
Lactoferrin was not detected at the auxiliary pressure of 0.1 and 0.2 psi, until lactoferrin was successfully detected as auxiliary pressure comes at 0.5 psi. As can be seen from the results in Figure 4 and Table 2, with the increase of auxiliary air pressure, the retention time was gradually shortened, and the corresponding integral area at the peak time was also gradually reduced. Too much auxiliary pressure, such as 1.2, 1.5 and 1.8 psi, indeed reduced the retention time hardly, however, it also affected the accuracy of lactoferrin detection. Therefore, the auxiliary pressure of 0.5 psi is the most ideal for lactoferrin detection. Mine et al. [36,37] also reported that 50 mbar (the equivalent of 0.725 psi) air pressure was utilized in CE for the fast detection of creatine kinase and carboxylesterase, indicating that the enzyme adsorption by the capillary wall was improved effectively. However, in this study, auxiliary pressure using to detect lactoferrin is smaller.
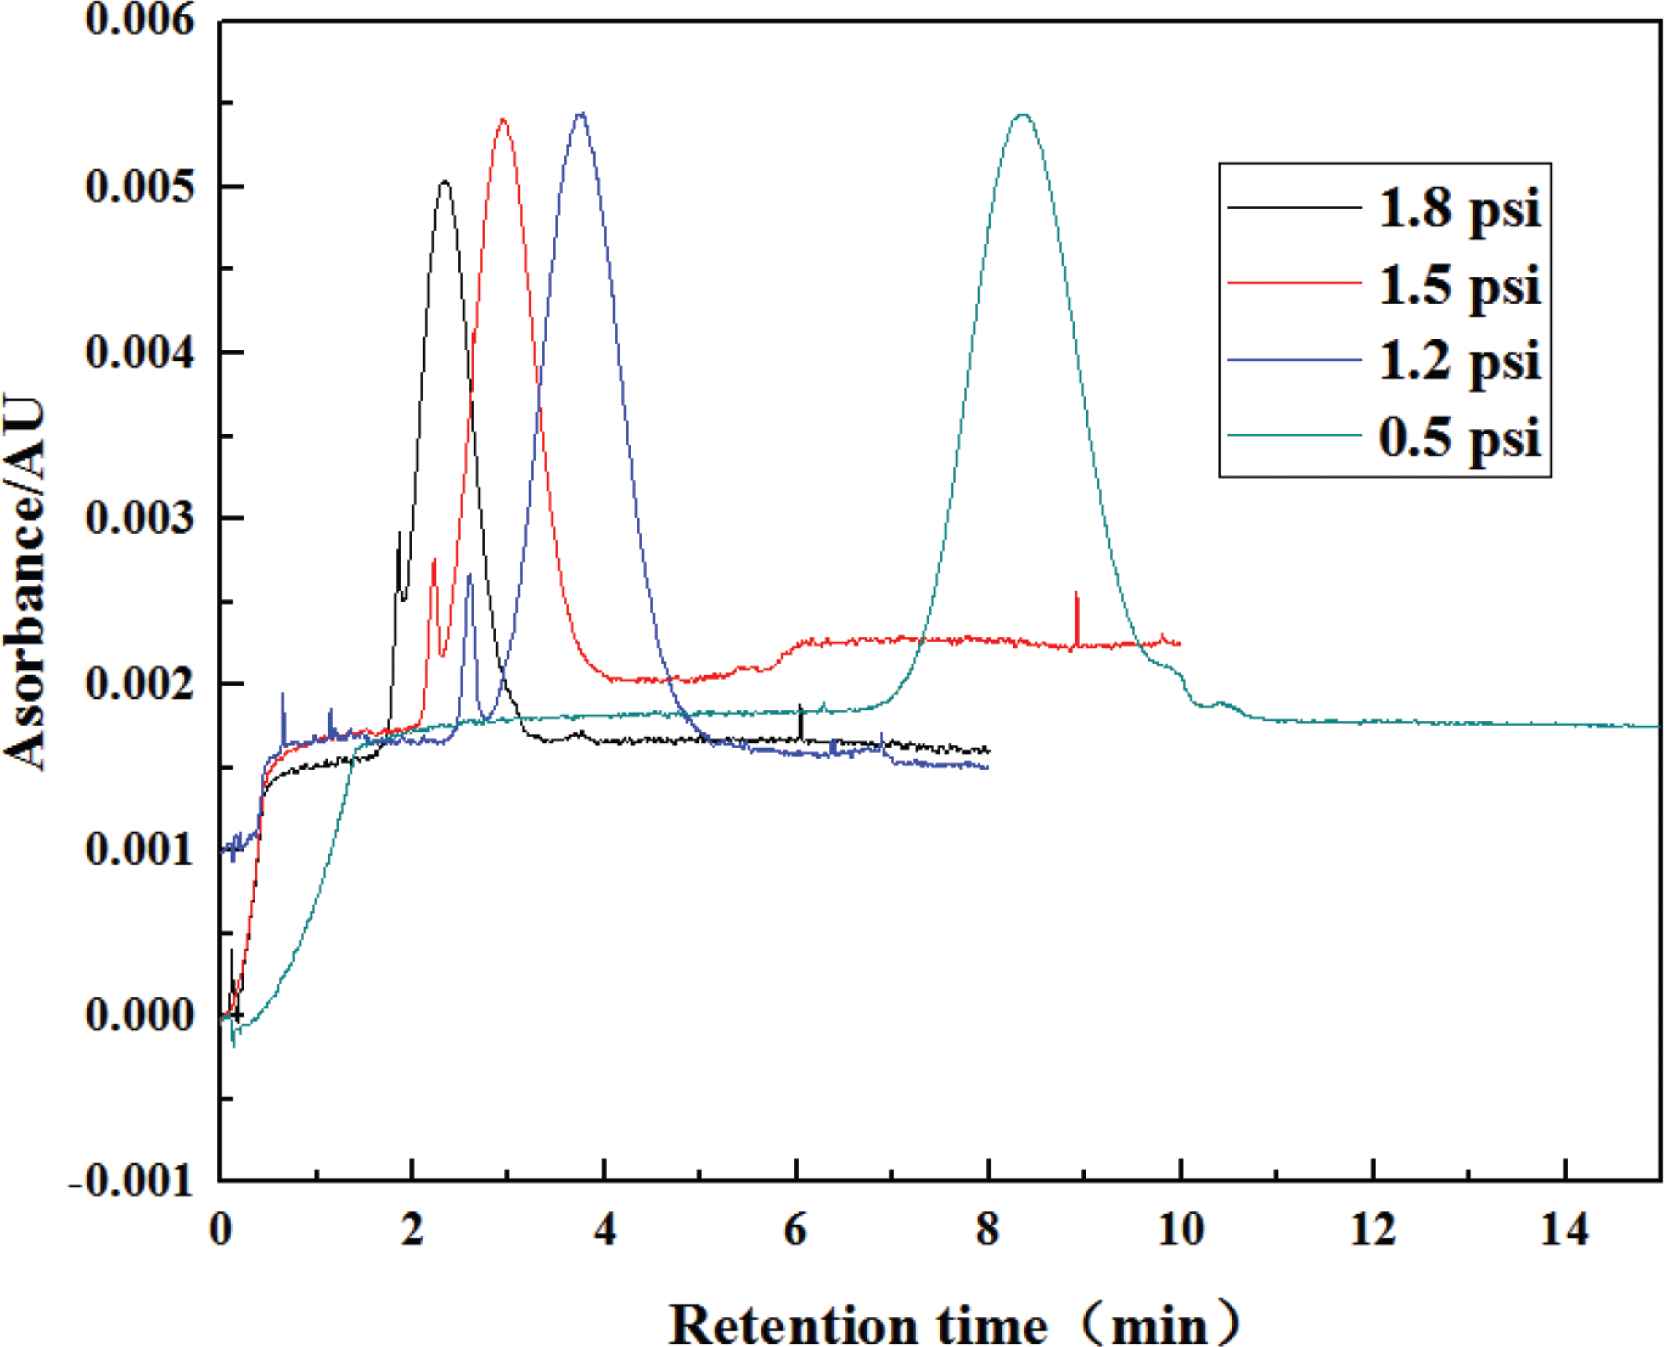
Lactoferrin spectra of detection with different auxiliary air pressure of capillary electrophoresis. The phosphates solution of 50 mM with 6M urea, at pH 4.0, assisted by 0.5, 1.2, 1.5 and 1.8 psi pressure, respectively.
| Auxiliary pressure (psi) | Peak width | Retention time | The integral area |
|---|---|---|---|
| 0.5 | 3.2 | 8.325 | 306714 |
| 1.2 | 2.8 | 3.763 | 254317 |
| 1.5 | 2.1 | 2.925 | 218686 |
| 1.8 | 1.5 | 2.308 | 135793 |
Comparative analysis result of lactoferrin detection in the same buffer solution with different auxiliary air pressure
3.5. Determination of Lactoferrin Quantitative Method
According to the above test results, the best buffer system was determined to be 50 mmol/L phosphates with 6 mol/L urea, which could not only alleviate the adsorption of the capillary wall, but also improve the peak shape. Although the reverse voltage method successfully detect lactoferrin, the symmetry of the peak pattern is not symmetrical enough. The auxiliary pressure of 0.5 psi can accelerate the movement of the sample, and the retention time was more reasonable, as shown in Figure 5. Under this condition, lactoferrin can be quantitatively detected, which the standard curve is y = 117807x + 3018.61374, with the fitting R2 = 0.999. And in this method, the LOQ and LOD of lactoferrin detected by CE was at 0.04 and 0.01 mg/mL respectively.
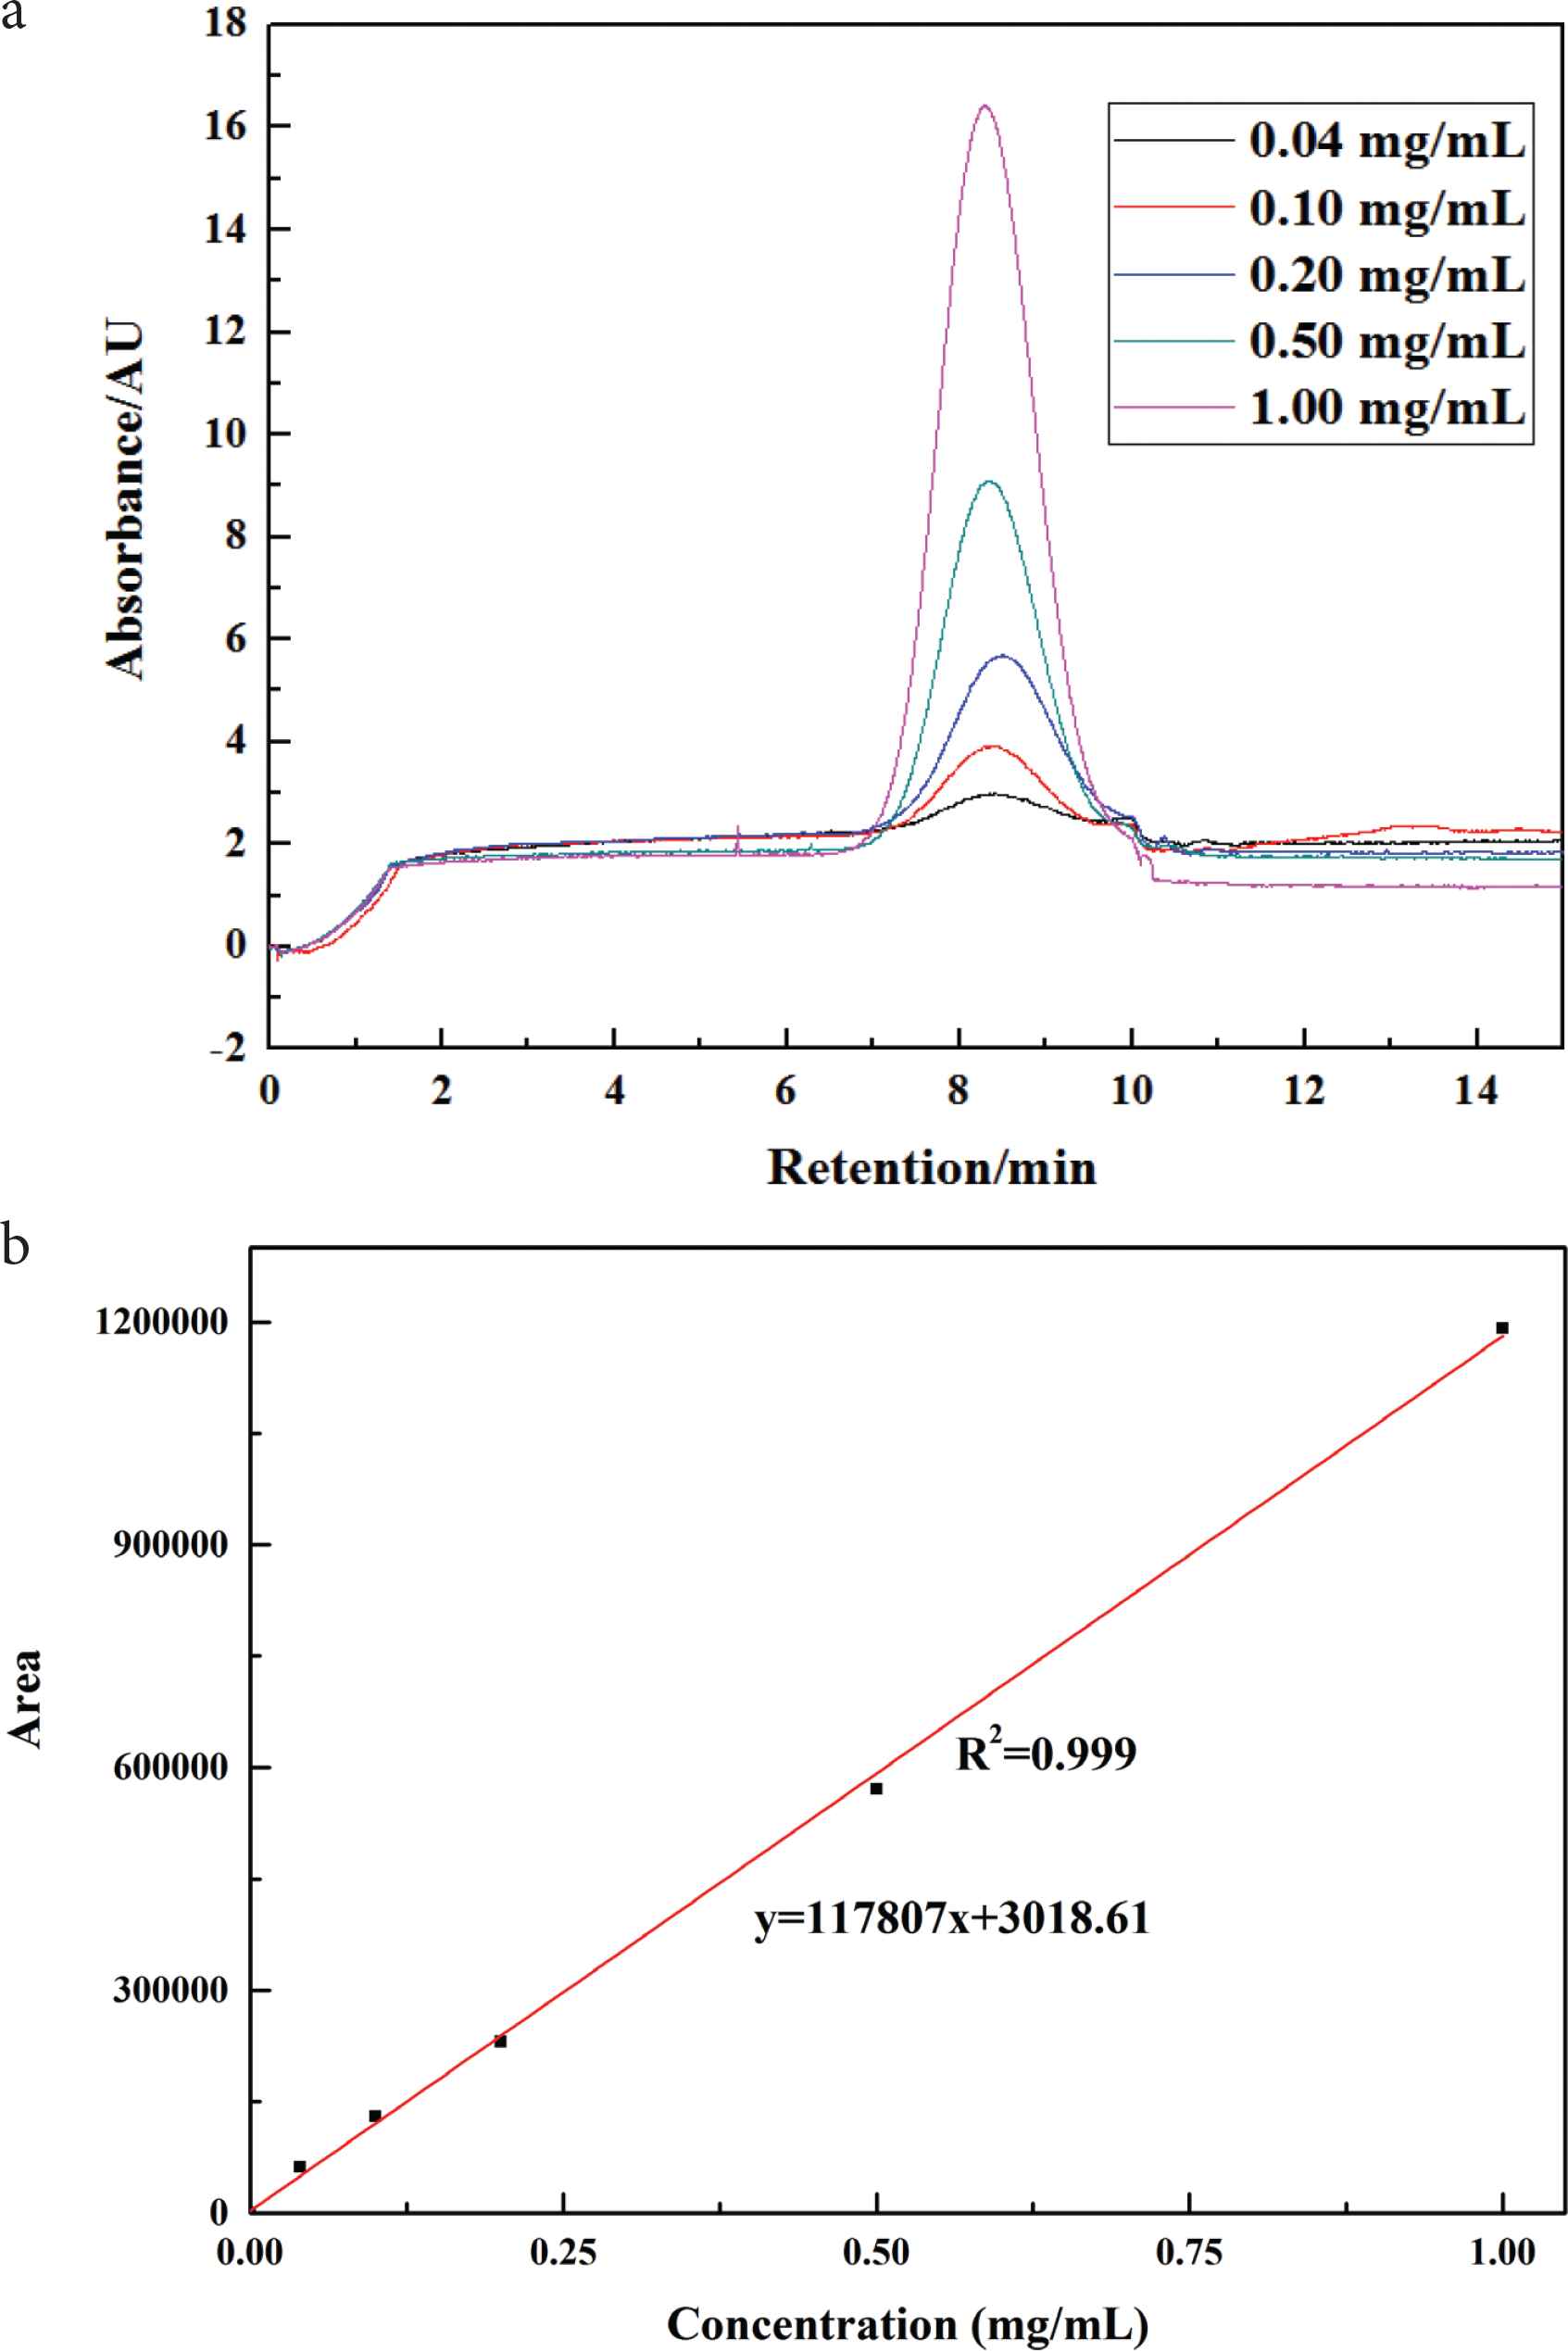
The standard curve of Lactoferrin. (a) Lactoferrin absorption peak at different concentrations; (b) Standard curve of detector response and time with different lactoferrin concentrations.
4. CONCLUSION
In this research, the separation of lactoferrin by CZE with uncoated molten capillary was studied. The effect of system pH, surfactant, organic solvent, buffer system and auxiliary air pressure on the separation of lactoferrin by CZE was investigated. Capillary electrophoresis is a sensitive analytical technique, but the parameters that affect the separation effect are relatively broad. This study investigated the influence factor of capillary electrophoresis, which involves less auxiliary air pressure, which illustrates that adjusting the auxiliary air pressure can improve the peak shape, slow down the adsorption resistance and accelerate the detection. The standard curve for the determination of lactoferrin at optimum auxiliary pressure was obtained. This result may provide a new perspective for the application of protein separation with the help of uncoated capillary electrophoresis.
CONFLICTS OF INTEREST
The authors declare they have no conflicts of interest.
AUTHORS’ CONTRIBUTION
HC and ZW performed the experiment. FF and PS contributed to manuscript preparation. XX and MD performed the data analysis. CW contributed to the experiment design and the discussions.
ACKNOWLEDGMENTS
All the authors contributed to the works thank the financial support of
Footnotes
REFERENCES
Cite this article
TY  - JOUR
AU  - Hui Chen
AU  - Zhenyu Wang
AU  - Fengjiao Fan
AU  - Pujie Shi
AU  - Xianbing Xu
AU  - Ming Du
AU  - Cong Wang
PY  - 2021
DA  - 2021/07/26
TI  - Analysis Method of Lactoferrin Based on Uncoated Capillary Electrophoresis
JO  - eFood
SP  - 147
EP  - 153
VL  - 2
IS  - 3
SN  - 2666-3066
UR  - https://doi.org/10.2991/efood.k.210720.001
DO  - 10.2991/efood.k.210720.001
ID  - Chen2021
ER  -