
Response Surface Modeling for the Enrichment of Gamma-Aminobutyric Acid with a Minimum Content of Citrinin in Monascus-Fermented Rice
- DOI
- 10.2991/efood.k.191118.001How to use a DOI?
- Keywords
- Monascus purpureus; GABA; citrinin; optimization; HPTLC
- Abstract
γ-Aminobutyric Acid (GABA) is a secondary metabolite produced in Monascus-fermented food. The mycotoxin (citrinin), another major secondary metabolite, is neurotoxic to humans and thus it diminishes the social acceptability of Monascus-Fermented Rice (MFR). The study was aimed to enrich GABA content and to reduce citrinin level in MFR. Plackett–Burman experimental design and response surface methodology was used to optimize a fermentation medium for a high amount of GABA production with less amount of citrinin by Monascus purpureus Microbial Type Culture Collection and Gene Bank (MTCC) 369 under solid state fermentation (SSF). Statistically optimized nutrient parameters for MFR were lactose 0.054 g/g, alanine 2 mg/g, malt extract 37.4 mg/g, and ZnSO4 0.3 mg/g. The yield of GABA and citrinin in optimized conditions were found to be 24 ± 0.27 mg/g and 3.3 ± 0.19 μg/g, respectively. The optimized medium parameters can be used and explored to produce high amount of GABA with low citrinin in MFR.
- Copyright
- © 2019 International Association of Dietetic Nutrition and Safety. Publishing services by Atlantis Press International B.V.
- Open Access
- This is an open access article distributed under the CC BY-NC 4.0 license (http://creativecommons.org/licenses/by-nc/4.0/).
1. INTRODUCTION
γ-Aminobutyric Acid (GABA) is a non-protein amino acid consisting of four carbon atoms and acts as a neurotransmitter inhibitor. It opens chlorine channel and it allows the flow of chloride and potassium ions either into or out of the cell, causing depolarization of the nervous system of mammals. GABA is used for the treatment of neuronal disorders such as anxiety, convulsion, and epilepsy. In the field of functional food research, foods enriched with GABA have become of primary focus [1,2]. Makgeolli, a traditional Korean alcoholic beverage obtained from fermented rice, showed a large amount of GABA content, and it has been recommended as a nutraceutical [3].
In the traditional system of East Asia, fermented food has been in use since ancient times and for fermentation different Monascus species, such as Monascus pilosus, Monascus purpureus, and Monascus ruber, were used [4]. Monascus species can produce various secondary metabolites like pigments [5], monacolin K, GABA [6], and citrinin [7,8]. GABA in traditional fermented food can be produced by a wide range of fungi other than Monascus, such as Lactobacillus paracasei, L. brevis, L. lactis [9], Rhizopus [10], Aspergillus nidulans, A. Niger, and Rhodotorula glutinis [11]. For enrichment of GABA content in fermented rice, various methods have been used, which include overexpressing of glutamic acid decarboxylase genes [12], using glutamic acid as substrate in fermentation medium for the conversion of glutamic acid to GABA [13], and rice germination. Some studies were focused on increasing GABA production by modifying the nutrient parameters and some also checked the process parameters [14]. However, in every successful research study carried out for GABA content in Monascus-Fermented Rice (MFR), one drawback was the severe citrinin contamination. Citrinin content in MFR is a growing threat to public health owing to its nephrotoxic property. Thus, content of citrinin in MFR lowers its social acceptability. Citrinin is toxic especially to kidney cells and even in low concentration (1.8 mg/mL) caused more than 50% of kidney cell death [15]. The corresponding increment of citrinin content along with GABA in MFR is one of the main drawbacks that decrease its social acceptability and therapeutic potential.
This research deals with the screening of various Monascus strains and fermentation substrates for maximum production of GABA under Solid State Fermentation (SSF). Optimization of a suitable fermentation medium yielding GABA in a high amount and simultaneously decreasing the content of mycotoxin (citrinin) in MFR has been accomplished.
2. MATERIALS AND METHODS
2.1. Microorganisms and Chemicals
Microbial strains M. purpureus Microbial Type Culture Collection and Gene Bank (MTCC) 410, 369, 1090, and M. ruber MTCC 1880 and 2326 were collected from MTCC, Institute of Microbial Technology, Chandigarh, India. Fungus M. pilosus CBS 286.34 and CBS 290.34 were collected from CBS-KNAW Fungal Biodiversity Centre, Utrecht, Netherlands. Potato dextrose agar medium was used to maintain the fungal strain and subcultured at every 30 days and incubated at 28°C [16,17]. GABA and citrinin standards were purchased from Sigma-Aldrich Chemicals (Taufkirchen, Germany). All other microbiological media and chemicals were purchased from Sisco Research Laboratories Pvt. Ltd. (Delhi, India). Solvents used for analysis were of analytical grade and were obtained from Merck Ltd. (Mumbai, India).
2.2. Seed Culture Preparation
Actively growing slants of different strains of M. purpureus MTCC 410, 369, 1090; M. ruber MTCC 1880, 2326; and M. pilosus CBS 286.34, CBS 290.34 were used for the preparation of spore suspension. The slants were suspended in sterile water and diluted to a concentration of 5.7 × 10³ spores/mL. The concentration of spore in water was confirmed by counting using a hemocytometer. Further, for seed culture preparation, respective spore suspension of different Monascus strains was inoculated separately in sterilized culture medium (15% v/v). Medium composition for seed culture was 100 g dextrose, 10 g peptone, 2 g KNO3, 2 g NH4NO3, 0.5 g MgSO4·7H2O, and 0.1 g CaCl2 in 1000 mL distilled water. The inoculated media were incubated in shaking incubator at 110 rpm at 30°C for 48 h [17].
2.3. Solid State Fermentation
Barley (Hordeum vulgare), cassava (Manihot esculenta Crantz), jowar (Sorghum bicolour), oat (Avena sativa), rice (Oryza sativa), and sweet potato (Ipomoea batatas) were investigated to select best substrate for GABA production. The best substrate was further used for screening of different Monascus strains (M. purpureus MTCC 410, 369, 1090; M. ruber MTCC 1880, 2326; and M. pilosus CBS 286.34, CBS 290.34) for maximum productivity of GABA was carried out by one factor at a time under SSF. Spore suspension (5 mL) of different fungal strains were inoculated separately in Erlenmeyer flasks (250 mL) containing 20 g of different sterilized substrates and incubated in static condition at 30°C with 75% relative humidity for 14 days [18]. The best substrate and Monascus strain were used for SSF.
The effect of different nutrient parameters, such as medium supplemented with carbon enrichment, nitrogen enrichment, and enrichment with macro- and micro-nutrients, was screened separately for the increment of GABA production in MFR. The screening of medium nutrient parameters was carried out using Plackett–Burman Design (PBD). In carbon enrichment to medium, 11 factors with nine parameters (fructose, starch, maltose, sucrose, lactose, dextrose, ethanol, glycerol, and succinic acid) were screened to determine their relative significance for high yield of GABA. For screening of nitrogen sources, seven independent variables (alanine, yeast extract, soybean paste, malt extract, casein, and veg. peptone) were selected. Similarly, seven independent macro- and micro-nutrients (K2HPO4, MgSO4, KCl, CaCl2, NaH2PO4, NaNO3, and ZnSO4·7H2O) were screened for maximum GABA production. These nutrient variables were tested at their two different concentration levels [low (−) and high (+)]. The content of GABA in each run designed by PBD was quantified by high-performance thin layer chromatography (HPTLC) and calculated according to PBD to determine the effect of varying medium variables (carbon, nitrogen, and macro- and micro-nutrients) on GABA production [19].
From PBD, the most influencing parameters for each category were selected and used in Box–Behnken’s design for further optimization of their concentration to produce GABA in MFR. The medium components were screened based on high contribution factor, and then the level of selected nutrient parameters was optimized by response surface methodology (RSM) for maximum GABA and minimum citrinin production. A 29-run experimental design was made according to Design Expert 8.0.1.7 (Statease Inc. USA). Responses were measured in terms of GABA and citrinin production. Using point prediction tool of RSM, medium parameters were optimized for production of maximum GABA with minimum citrinin level.
2.4. Quantitative Estimation of GABA and Citrinin
For extraction of GABA, 1 g of MFR was suspended in 5 mL of 70% v/v ethanol. Further, it was vortexed and sonicated for 10 min, and centrifuged at 4000 rpm for 5 min. The organic layer was separated, concentrated, and filtered through a 0.45-μm membrane filter before HPTLC analysis. For the estimation of GABA, butanol: acetic acid:water (12:3:5, v/v/v) was mixed, and the upper layer was used as mobile phase. Whereas aluminum plates pre-coated with silica gel 60F-254 (10 m × 10 cm with 0.2 mm thickness, Merck, Germany) were used as the stationary phase for HPTLC analysis. Similarly, for citrinin extraction, MFR was extracted in chloroform due to the low solubility of citrinin in aqueous solvent. The upper layer of a mixture of chloroform:ethyl acetate:formic acid (4.5:6:0.5, v/v/v) was used as solvent system. The filtered solution was applied in stationary phase, which is aluminum plates pre-coated with silica gel 60F-254.
At 25°C and 60% relative humidity, the plate was kept for 30 min for saturation of chamber. In a 10 × 10-cm twin trough-glass chamber (Camag, Switzerland), linear ascending plate development was carried out up to 85% of total HPTLC plate height. For estimation of GABA, HPTLC plate was sprayed with freshly prepared ninhydrin reagent (1.5% w/v ninhydrin in butanol and acetic acid, 97:3, v/v) and then dried for 10 min at 100°C and scanned at 400 nm [20]. The developed plate was scanned at 380 nm for quantitative estimation of citrinin using TLC scanner III (Camag, Switzerland) and operated by winCATS software (version 1.2.0, Camag, Switzerland) [21].
3. RESULTS AND DISCUSSION
3.1. Quantitative Estimation of Citrinin and GABA
Different ratio of butanol:acetic acid:water (v/v/v) as mobile phase were tested for better chromatographic separation with higher resolution and suitability of mobile phase. Highly resolute GABA peak at Rf 0.46 was found using the above mixture at a ratio of 12:3:5 (v/v/v), and densitometric evaluation was performed at 400 nm (Figure 1c and d) after derivatizing with ninhydrin reagent. Under this experimental condition, GABA at concentration range of 40–280 ng per spot was found to be a linear (r2 ≥ 0.9) between peak area and concentration. The slope and intercept of the linear equation were found to be 786 ± 6 and 1282 ± 21, respectively. Similarly, different ratios of chloroform:ethyl acetate:formic acid (v/v/v) were tested for HPTLC analysis of citrinin. A sharp and resolute peak of citrinin at Rf 0.42 was observed using chloroform:ethyl acetate:formic acid at a ratio of 4.5:6:0.5 (v/v/v). Citrinin concentration was recorded at absorbance mode 380 nm (Figure 1a and b) and found good linear relationship (r2 ≥ 0.977) between peak area and concentration at a range of 2–20 μg per spot. The slope and intercept of linear equation of citrinin are 1096 ± 40 and 2174 ± 33, respectively. The content of both GABA and citrinin in MFR were determined from their respective linear equation.
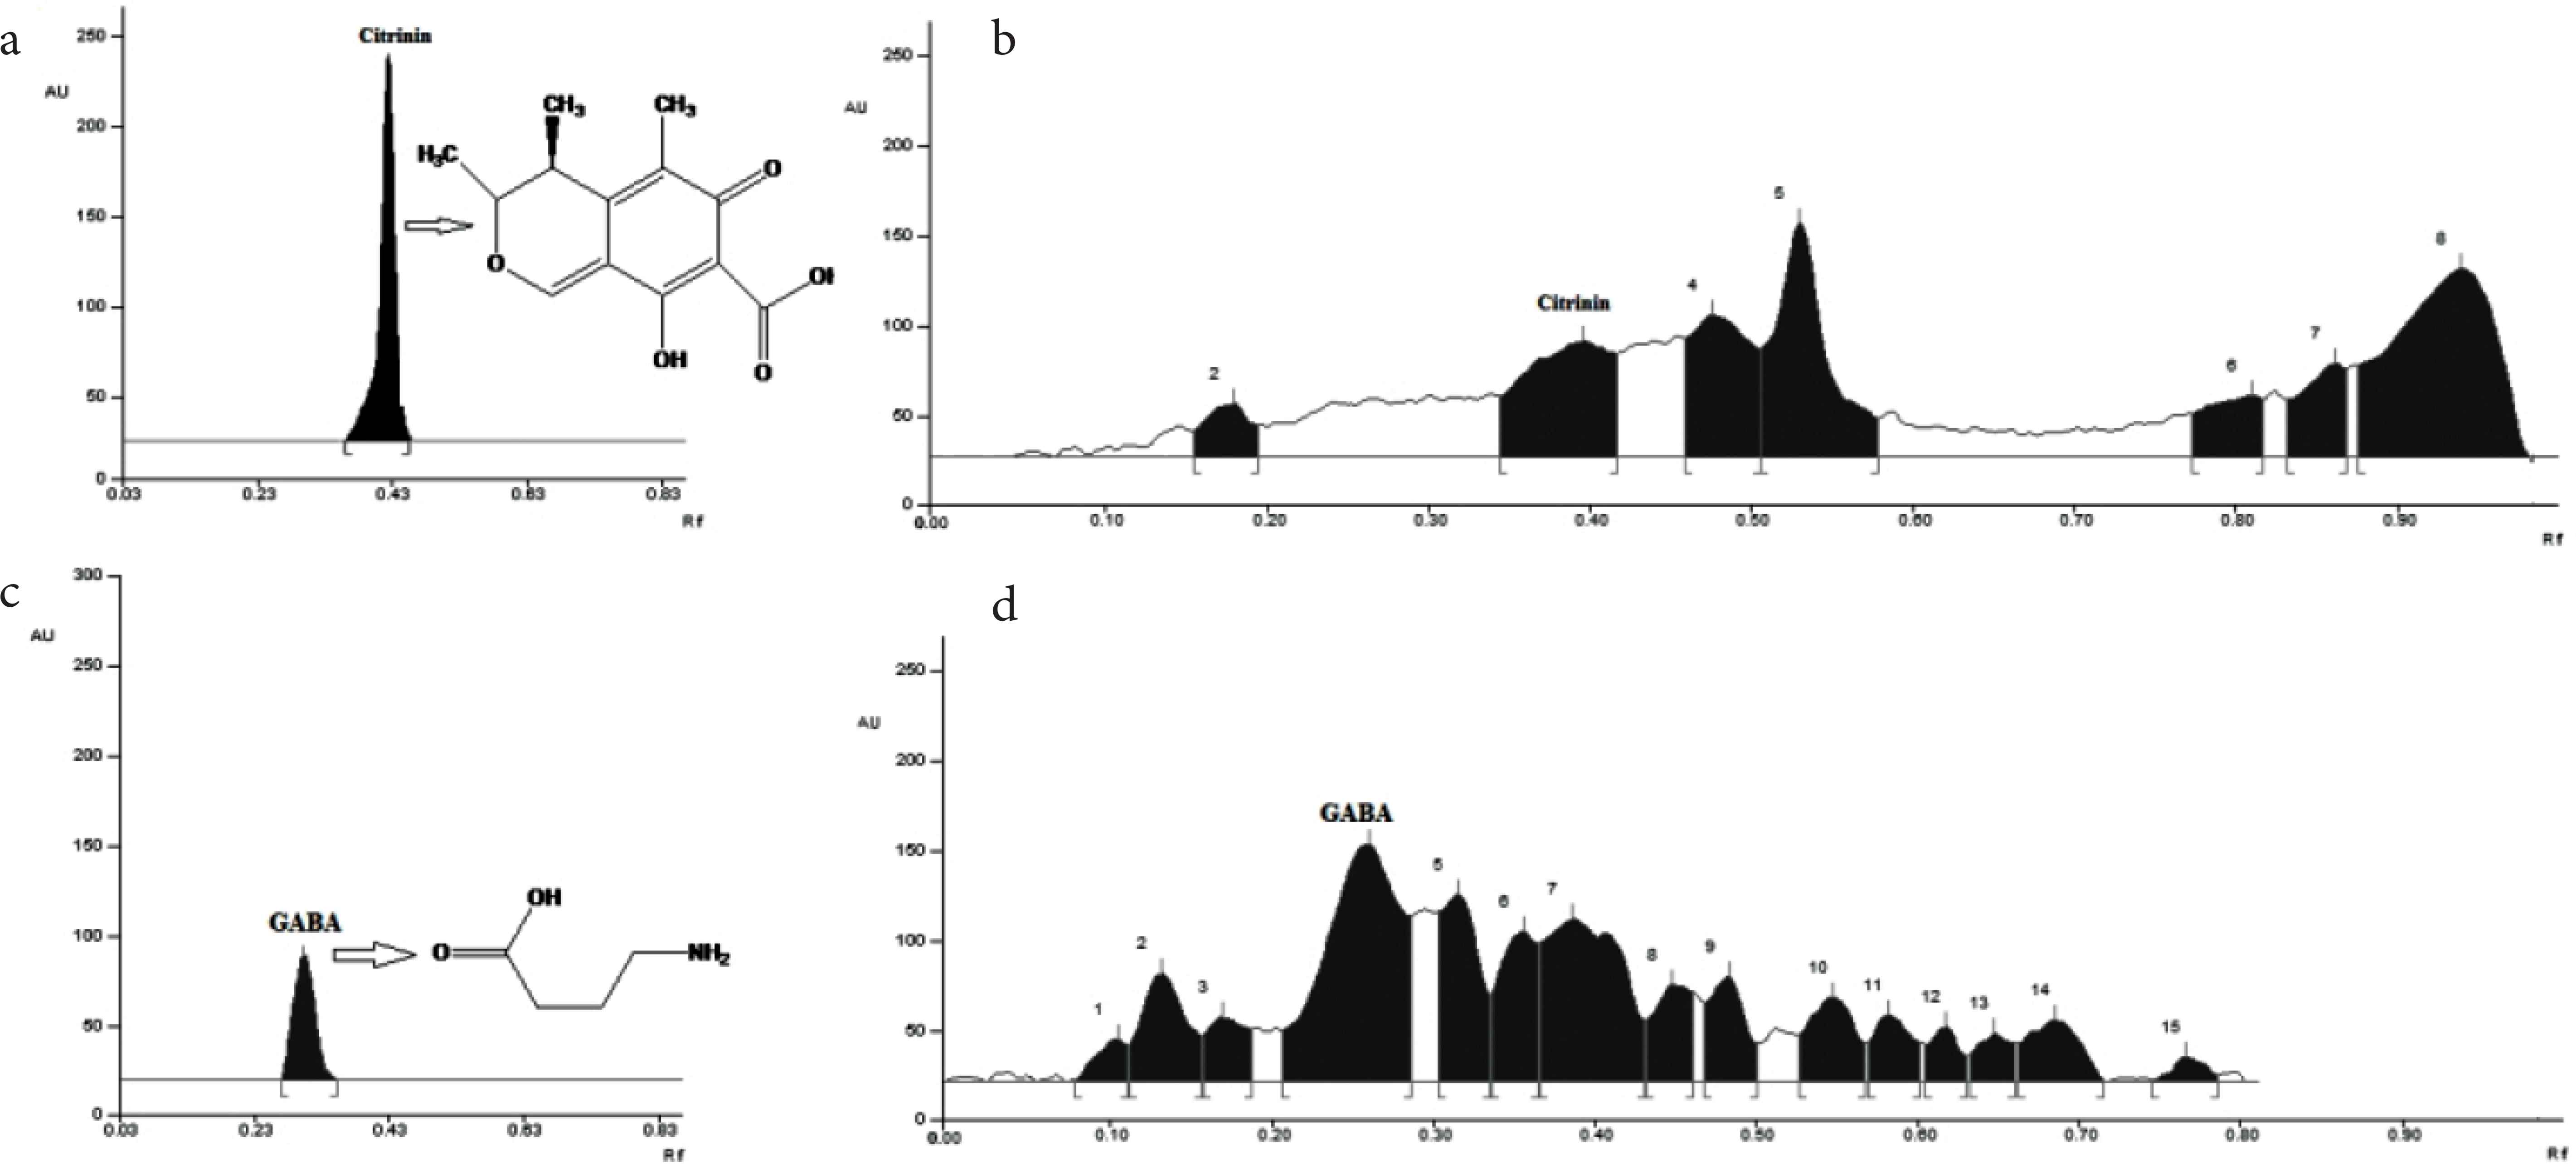
Thin layer chromatograms of standard and extracted citrinin with Rf value 0.42 (a and b) and GABA with Rf value 0.46 (c and d).
3.2. Screening of Microbes and Solid Substrates
Different Monascus spp. were checked for the quantity of GABA production. Variation in the content of GABA in fermented rice by different Monascus spp. can be justified because of the difference in expression of glutamate decarboxylase enzyme level [22]. M. purpureus MTCC 369 was found to be the best microbe for GABA production. Similarly, among the different other substrates investigated, the maximum amount of GABA was produced (13.585 ± 0.42 mg/g) under SSF of long grain rice (O. sativa) by M. purpureus MTCC 369 (Table 1), and the yield was similar to the previous results [23]. Rice showed the highest content of GABA, and this may be because rice contains glutamic acids, which is a precursor of GABA [24].
| Solid substrate | M. purpureus | M. ruber | M. pilosus | ||||
|---|---|---|---|---|---|---|---|
| MTCC 369 | MTCC 410 | MTCC 1090 | MTCC 1880 | MTCC 2326 | CBS 286.34 | CBS 290.34 | |
| Barley (Hordeum vulgare) | 3.1 ± 0.03 | 0.70 ± 0.08 | 3 ± 0.20 | 2 ± 0.28 | 1.5 ± 0.27 | 1 ± 0.03 | 0.54 ± 0.07 |
| Sweet potato (Ipomoea batatas) | 2 ± 0.07 | 0.22 ± 0.71 | 2.2 ± 0.11 | 0.37 ± 0.05 | 0.30 ± 0.03 | 0.23 ± 0.08 | 0.70 ± 0.02 |
| Rice (Oryza sativa) | 14 ± 0.42 | 1.6 ± 0.42 | 13 ± 1.2 | 0.44 ± 0.08 | 3 ± 0.21 | 2.8 ± 0.09 | 1.6 ± 0.18 |
| Oat (Avena sativa) | 3 ± 0.14 | 4 ± 0.06 | 6.6 ± 0.16 | 5.6 ± 1.2 | 12.6 ± 0.14 | 3 ± 0.05 | 0.16 ± 0.007 |
| Cassava (Manihot esculenta) | 0.27 ± 0.21 | 0.37 ± 0.12 | Undetectable | 0.73 ± 0.04 | 0.3 ± 0.06 | 0.26 ± 0.02 | 3.5 ± 0.12 |
| Jowar (Sorghum bicolor) | 4.2 ± 0.89 | 1 ± 0.25 | 3 ± 0.12 | 0.70 ± 0.002 | 0.82 ± 0.004 | 5.2 ± 1.06 | 0.72 ± 0.05 |
Production of GABA (mg/g) by different Monascus strains and substrates under solid state fermentation
3.3. Screening of Carbon, Nitrogen, Micro-, and Macro-nutrients
Alanine and malt extract were selected as the best nitrogen sources with 18.64% and 16.41% contributing factors for GABA production, respectively. Lactose was screened as the best carbon source by Plackett–Burman experimental design with 44.93% overall contribution toward production of GABA. Out of seven tested micro- and macro-nutrients (K2HPO4, MgSO4, KCl, CaCl2, NaH2PO4, NaNO3, and ZnSO4·7H2O), ZnSO4·7H2O was found to be the best salt with 30.54% contribution in rice substrate and this result may be due to the fact that zinc improves carbon uptake by the fungus and help in biomass and metabolite production. Placket–Burman experimental design is statistical tool used to identify the influencing nutrient parameters as % contribution on the production of GABA and has been shown in Table 2.
| Variables | ∑H | ∑L | Mean square | Effect | F-value | % contribution |
|---|---|---|---|---|---|---|
| Fructose | 125.9 | 146.22 | 0.98 | 0.57 | 0.24 | 2.64 |
| Starch | 145.08 | 127.04 | 0.724 | −0.49 | 0.18 | 1.95 |
| Maltose | 143.46 | 128.56 | 0.32 | −0.33 | 0.08 | 0.89 |
| Sucrose | 132.89 | 139.26 | 1.81 | 0.77 | 0.45 | 10.71 |
| Lactose | 146.51 | 125.63 | 16.59 | −2.35 | 4.17 | 44.93 |
| Dextrose | 138.79 | 133.18 | 5.34 | 1.33 | 1.34 | 14.49 |
| Ethanol | 145.61 | 126.53 | 0.04 | −0.12 | 0.012 | 0.13 |
| Glycerol | 134.61 | 137.46 | 0.104 | −0.18 | 0.026 | 0.092 |
| Succinic acid | 135.90 | 136.24 | 0.73 | 0.49 | 0.18 | 2.12 |
| MSG | 30.8 | 65.14 | 2.72 | 0.95 | 2.12 | 15.10 |
| Alanine | 67.08 | 28.88 | 3.37 | 1.06 | 2.63 | 18.64 |
| Yeast ext. | 53.61 | 42.34 | 0.29 | 0.31 | 0.22 | 1.62 |
| Soybean ext. | 60.71 | 35.24 | 1.50 | 0.71 | 1.17 | 8.29 |
| Malt ext. | 65.9 | 30.14 | 2.88 | 0.98 | 2.24 | 16.41 |
| Casein | 34.79 | 61.16 | 1.60 | −0.73 | 1.25 | 8.89 |
| Veg. peptone | 55.2 | 40.75 | 0.48 | 0.40 | 0.37 | 2.66 |
| K2HPO4 | 44.95 | 43.78 | 0.11 | 0.19 | 0.003 | 0.033 |
| MgSO4 | 41.33 | 47.44 | 3.07 | −1.01 | 0.11 | 0.83 |
| KCl | 52.3 | 36.43 | 20.97 | 2.64 | 0.72 | 5.76 |
| CaCl2 | 29.86 | 58.87 | 70.11 | −4.83 | 2.42 | 19.29 |
| NaH2PO4 | 55.84 | 32.89 | 43.89 | 3.82 | 1.52 | 12.07 |
| NaNO3 | 46.33 | 42.44 | 1.28 | 0.65 | 0.04 | 0.34 |
| ZnSO4 | 26.15 | 62.58 | 110.59 | −6.07 | 3.83 | 30.54 |
Contribution of different carbon, nitrogen, micro-, and macro-nutrients on GABA production by M. purpureus MTCC 369 in a rice-based medium
3.4. Optimization of Fermentation Medium for Maximum GABA and Minimum Citrinin Production
From Plackett–Burman experimental design, we have identified lactose, alanine, malt extract, and ZnSO4·7H2O as the most influencing nutrient parameters that contributed to a large extent for GABA production and have been selected for response surface optimization. Experimental and predicted GABA and citrinin content in each experimentally designed run obtained using Box–Behnken’s response surface methods is shown in Table 3. Design Expert 8.0.1.6 software (Stat-Ease Inc., Minnesota, USA) was used to analyze the experimental results. The experimental results were tried to fit into different models, and multiple nonlinear regression was found to be the best-fitted model. The equation for GABA and citrinin production in optimized fermented conditions has been described as:
GABA (mg/g) = 16.41 − 2.83A − 0.22B − 2.28C − 0.90D − 2.89AB − 1.62AC − 1.10AD − 5.55BC + 0.78BD − 0.17CD − 7.90A2 + 0.93B2 + 3.51C2 + 4.08D2
Citrinin (μg/g) = 3.32 + 0.20A − 0.46B + 0.05C + 0.05D − 0.04AB − 0.30AC − 0.43AD + 0.06BC + 0.09BD − 0.43CD + 0.36A2 − 0.22B2 + 1.05C2 − 0.15D2
| Run | Lactose (g/g) | Alanine (mg/g) | Malt extract (mg/g) | ZnSO4·7H2O (mg/g) | GABA (mg/g) | Citrinin (μg/g) | ||
|---|---|---|---|---|---|---|---|---|
| Actual | Predicted | Actual | Predicted | |||||
| 1 | 0.06 | 5 | 40 | 0.1 | 18.94 | 22.81 | 5.15 | 4.66 |
| 2 | 0.06 | 8 | 25 | 0.3 | 20.34 | 21.08 | 3.93 | 2.61 |
| 3 | 0.02 | 5 | 25 | 0.3 | 23.54 | 15.63 | 3.28 | 3.81 |
| 4 | 0.06 | 2 | 10 | 0.2 | 14.89 | 17.81 | 5.05 | 4.61 |
| 5 | 0.1 | 5 | 40 | 0.2 | 10.71 | 5.22 | 5.30 | 4.70 |
| 6 | 0.06 | 5 | 10 | 0.1 | 29.25 | 27.62 | 4.21 | 3.67 |
| 7 | 0.06 | 5 | 25 | 0.2 | 16.41 | 16.41 | 3.32 | 3.32 |
| 8 | 0.06 | 2 | 40 | 0.2 | 27.78 | 24.35 | 4.59 | 4.61 |
| 9 | 0.06 | 5 | 25 | 0.2 | 16.41 | 16.41 | 3.32 | 3.32 |
| 10 | 0.06 | 2 | 25 | 0.3 | 10.95 | 19.96 | 4.51 | 3.36 |
| 11 | 0.06 | 5 | 25 | 0.2 | 16.41 | 16.41 | 3.32 | 3.32 |
| 12 | 0.06 | 5 | 10 | 0.3 | 31.46 | 25.56 | 3.69 | 4.65 |
| 13 | 0.06 | 8 | 25 | 0.1 | 31.50 | 21.32 | 2.37 | 2.33 |
| 14 | 0.06 | 8 | 10 | 0.2 | 21.84 | 28.47 | 2.84 | 3.56 |
| 15 | 0.02 | 5 | 25 | 0.1 | 15.89 | 15.22 | 2.08 | 2.83 |
| 16 | 0.06 | 5 | 40 | 0.3 | 20.45 | 20.64 | 2.89 | 3.89 |
| 17 | 0.06 | 8 | 40 | 0.2 | 12.50 | 12.79 | 2.63 | 3.80 |
| 18 | 0.1 | 5 | 10 | 0.2 | 18.79 | 13.09 | 5.28 | 5.19 |
| 19 | 0.1 | 5 | 25 | 0.1 | 0.65 | 11.77 | 3.92 | 4.12 |
| 20 | 0.02 | 5 | 40 | 0.2 | 9.67 | 14.89 | 6.0 | 4.90 |
| 21 | 0.1 | 5 | 25 | 0.3 | 3.86 | 7.73 | 3.36 | 3.34 |
| 22 | 0.02 | 8 | 25 | 0.2 | 12.71 | 14.88 | 3.12 | 2.84 |
| 23 | 0.02 | 5 | 10 | 0.2 | 11.24 | 15.51 | 4.77 | 4.18 |
| 24 | 0.02 | 2 | 25 | 0.2 | 12.05 | 9.66 | 2.97 | 3.67 |
| 25 | 0.1 | 2 | 25 | 0.2 | 13.86 | 9.66 | 3.42 | 4.17 |
| 26 | 0.1 | 8 | 25 | 0.2 | 3.17 | 3.53 | 3.39 | 3.15 |
| 27 | 0.06 | 2 | 25 | 0.1 | 25.25 | 23.35 | 3.31 | 3.44 |
| 28 | 0.06 | 5 | 25 | 0.2 | 16.41 | 16.41 | 3.32 | 3.32 |
| 29 | 0.06 | 5 | 25 | 0.2 | 16.41 | 16.41 | 3.32 | 3.32 |
The predicted and experimental GABA and citrinin of concentrations of fermentation trials carried out by Box–Behnken’s response surface design
The perturbation plot (Figure 2a and b) was used to compare the effect of different nutrient parameters on GABA and citrinin content in MFR. The influencing and sensitivity potential of each nutrient parameter on GABA and citrinin content in MFR can be compared and represented by the lines of the perturbation graph. Nonlinear regression models resulted in six response graphs for GABA and citrinin production. The 3D response graph and its respective contour plots were used to check the effect of two different factors on targeted metabolite production. Figure 3a–d is the 3D response graph with individual contour plots for a few of the most influencing factors contributing to GABA and citrinin content in MFR. Statistical analysis of models are summarized in Table 4. In both the models, the adequate precision value is >4, i.e., 5.1 for GABA and 4.3 for citrinin. Therefore, the models can be useful for navigation purposes. The statistically optimized and experimentally proved content of nutrient parameters of a media for maximum GABA with low citrinin production were lactose 0.054 g/g, alanine 2 mg/g, malt extract 37.4 mg/g, and ZnSO4 0.3 mg/g. Using these statistically optimized nutrient parameters, predicted content of GABA and citrinin in SSF of rice by M. purpureus MTCC 369 were 25.21 mg/g and 3.21 μg/g, respectively. The expected content was validated by performing real experiments using optimized fermentation conditions, and 24 ± 0.27 mg/g of GABA was produced under SSF. The generated GABA content was 25 times higher than the controlled media without having optimized nutrients.
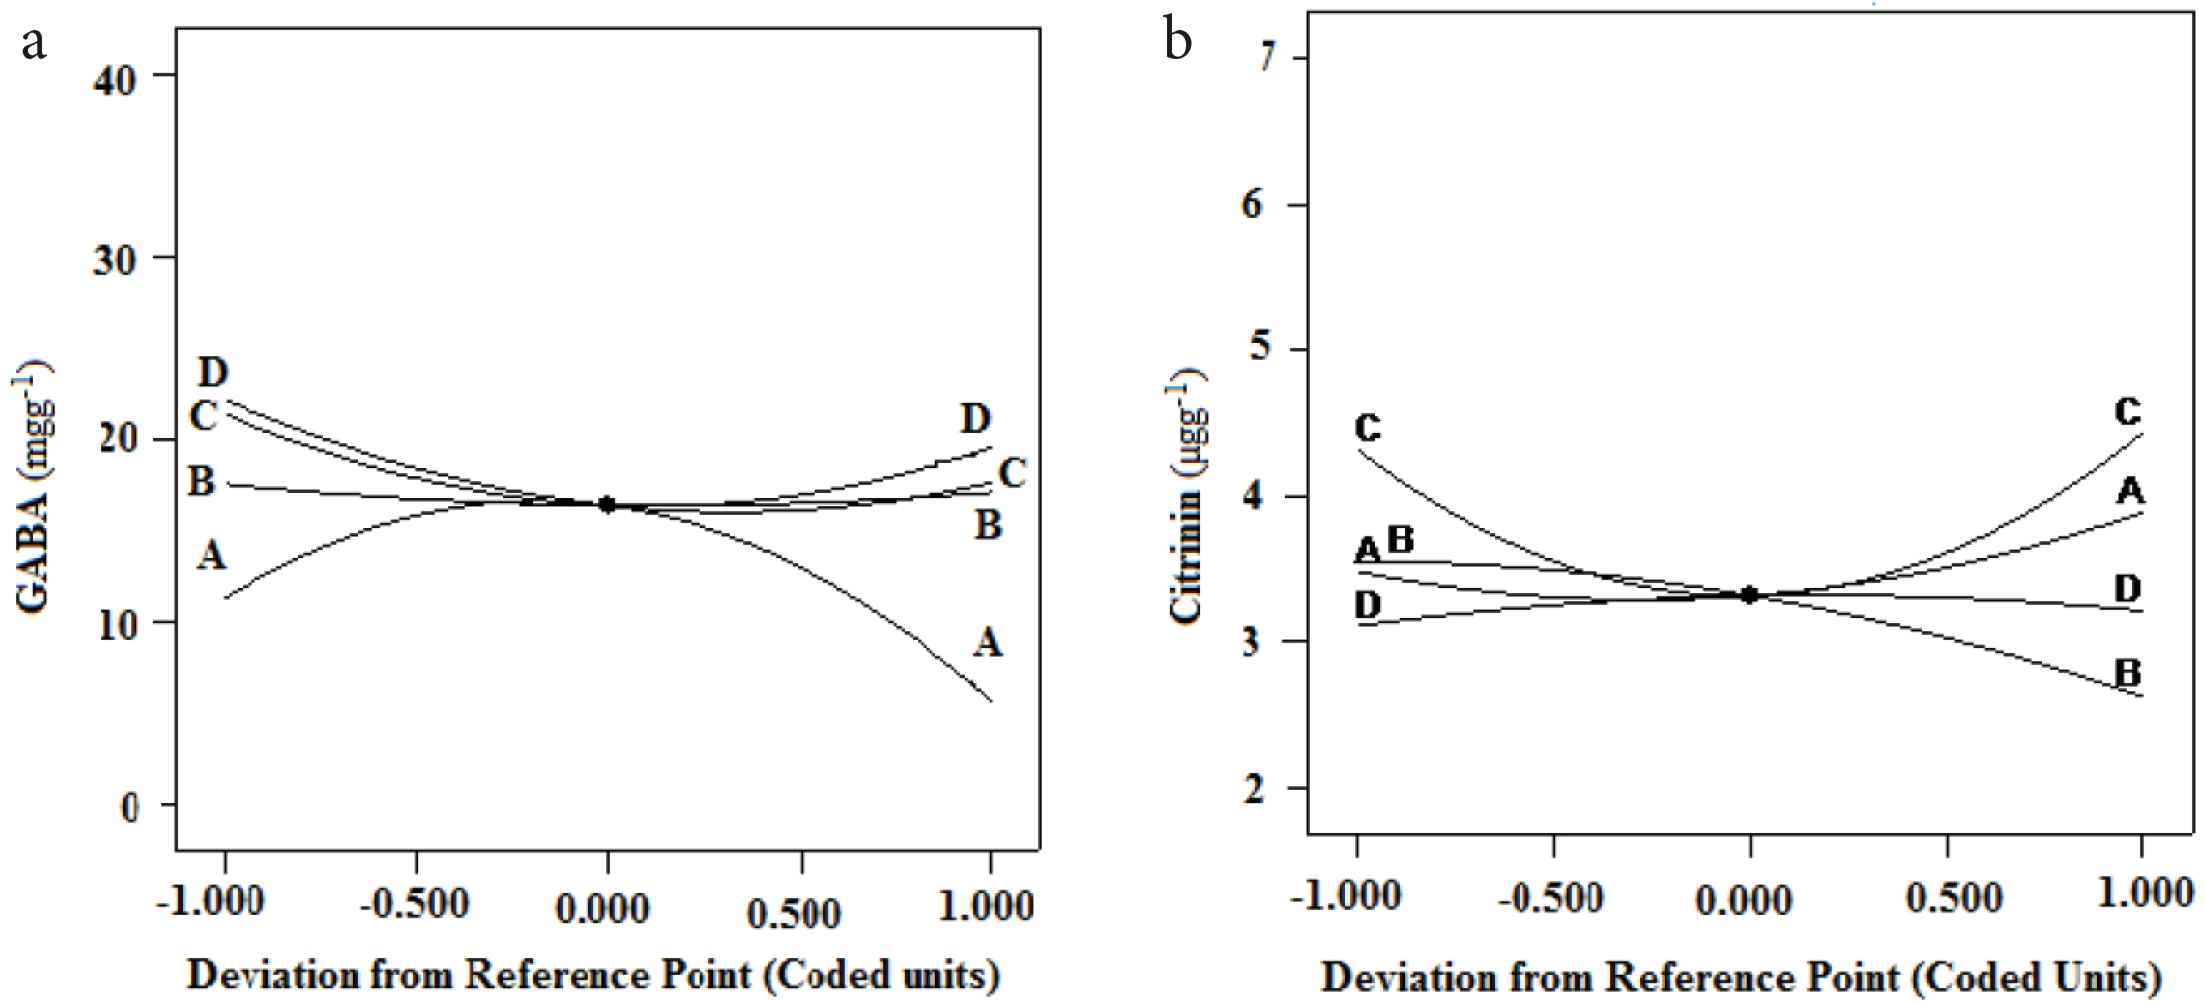
Perturbation plot showing the effect of all nutrient parameters on GABA (a) and citrinin (b) production. A, B, C, and D represent lactose, alanine, malt extract, and ZnSO4·7H2O, respectively.
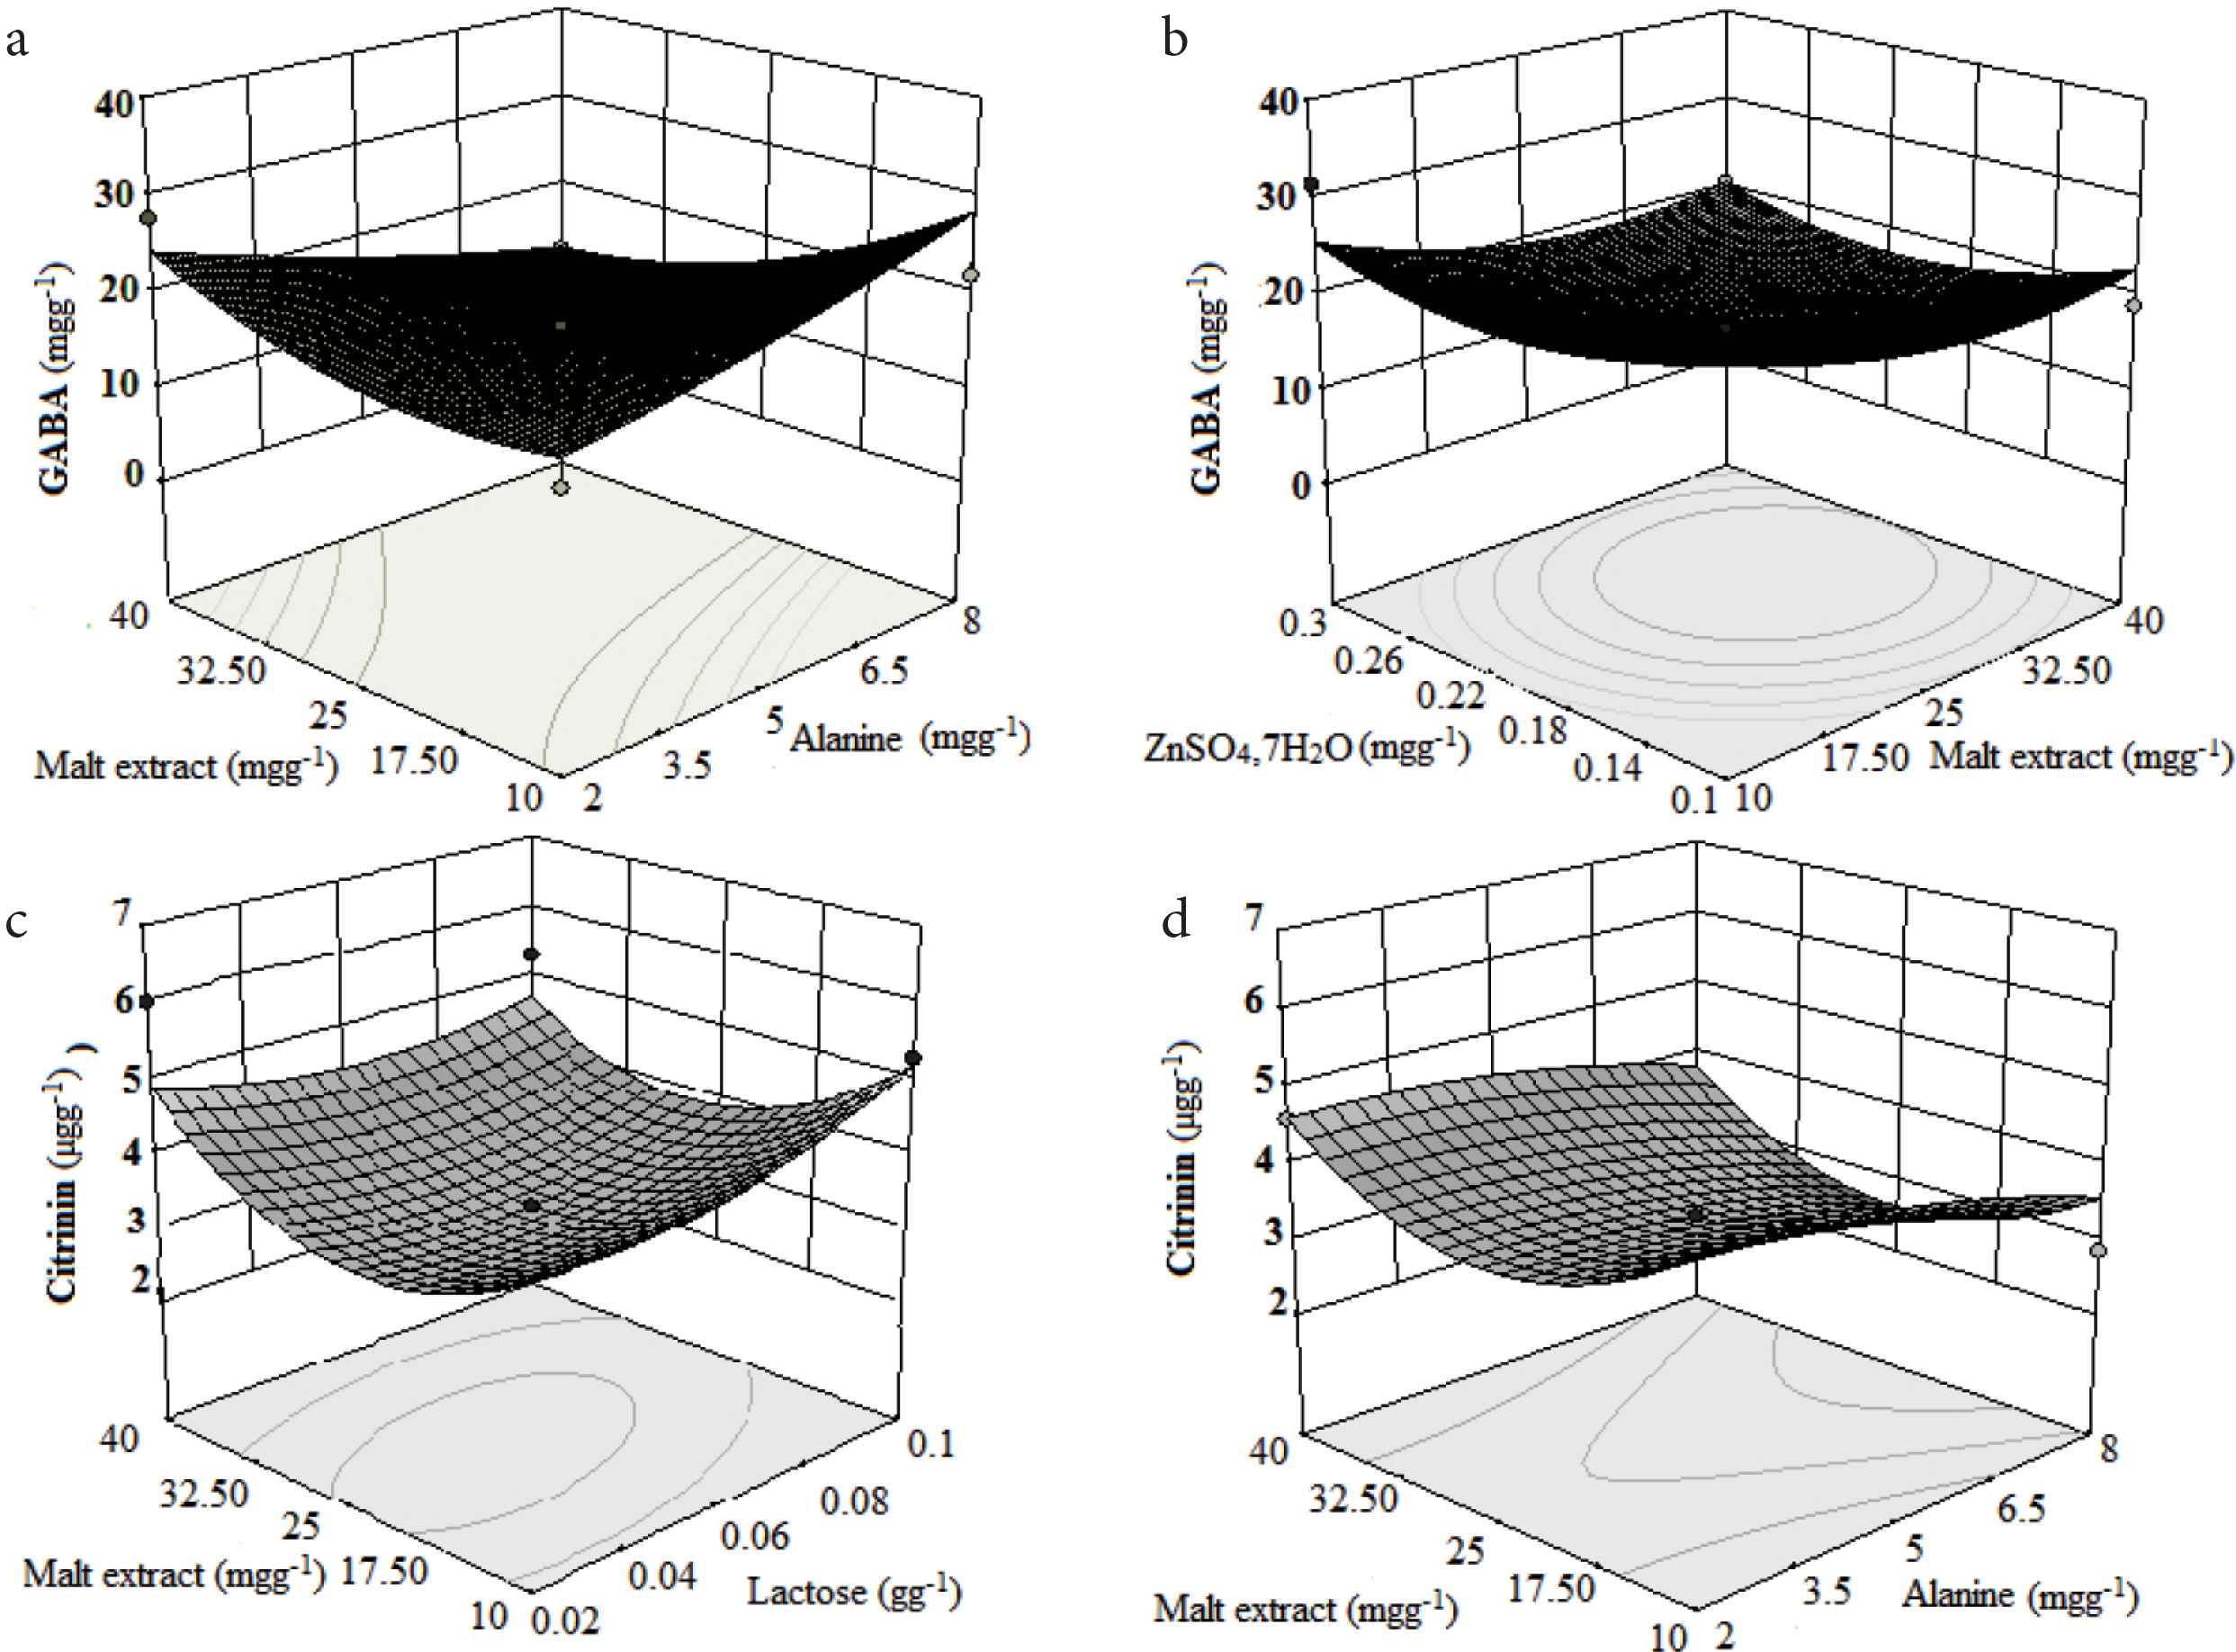
Response surface plots showing the relative effect of two medium parameters on GABA (a and b) and citrinin (c and d) production while keeping other nutrients at a constant level.
| GABA | Citrinin | |
|---|---|---|
| Regression | ||
| Sum of square | 1082.78 | 14.70 |
| Df | 14 | 14 |
| Mean squares | 77.34 | 1.05 |
| F-value | 1.69 | 1.26 |
| P | 0.16 | 0.33 |
| Residual | ||
| Sum of square | 638.82 | 11.64 |
| Df | 14 | 14 |
| Mean square | 45.36 | 0.83 |
| Lack of fit test | ||
| Sum of square | 638.82 | 11.64 |
| Df | 10 | 10 |
| Mean squares | 63.88 | 0.83 |
| F-value | 1.70 | 1.26 |
| Coefficient correlation (r2) | 0.62 | 0.55 |
| CV (%) | 40.51 | 24.33 |
| Adequate precision value | 5.13 (>4) | 4.36 (>4) |
Statistical analysis of the models for GABA and citrinin obtained from response surface methodology
These optimized values of nutrient parameters obtained from point prediction tool of RSM were further validated under SSF and produced 24 ± 0.27 mg/g of GABA, which was 25 and five times higher than the previously reported GABA produced by M. pilosus GM100 [25] and M. purpureus NTU 601 [26,27], respectively. Citrinin concentration was 3.3 ± 0.19 μg/g, which is very less than those in previously reported literature [27,28]. Several industries used MFR for pigment production, but citrinin is an undesirable byproduct. De Carvalho et al. [29] reported pigment production from MFR with reduced citrinin level, but the level of citrinin was much higher as compared with our findings. The low amount of citrinin production was due to the carbon–nitrogen ratio used in the optimized medium, and it supports the previous study [30,31]. The predicted model had indicated validity for GABA and citrinin 95.24% and 102%, respectively.
4. CONCLUSION
For the optimum production of GABA under SSF, rice is the best substrate and M. purpureus is a good microbe. The statistical design was used for the optimization of influencing nutrient parameters for the maximum production of GABA with a low citrinin level. The experimental results clearly showed that rice supplemented with lactose, alanine, malt extract, and ZnSO4 influenced the production of GABA and citrinin. The developed fermentation media showed 25 times more GABA production using M. purpureus MTCC 369 with low citrinin level as compared to controlled SSF without having optimized nutrients. Owing to the enrichment with metabolites of medicinal importance, the developed MFR can be used as nutraceuticals and can be explored for its therapeutic potentiality.
CONFLICTS OF INTEREST
The authors declare they have no conflicts of interest.
AUTHORS’ CONTRIBUTION
WK contributed in designed and performed experiments, data collected and analyzed, manuscript written. OR contributed in data collected and analyzed. MH contributed in analyzed data, manuscript critical evaluation. BPP contributed in conceptualized and designed the experiment; analyzed and critical evaluation of data.
ACKNOWLEDGMENTS
The authors would like to thank the
Footnotes
REFERENCES
Cite this article
TY  - JOUR
AU  - Washim Khan
AU  - Omkar Regmi
AU  - Mojeer Hasan
AU  - Bibhu Prasad Panda
PY  - 2019
DA  - 2019/11/29
TI  - Response Surface Modeling for the Enrichment of Gamma-Aminobutyric Acid with a Minimum Content of Citrinin in Monascus-Fermented Rice
JO  - eFood
SP  - 181
EP  - 187
VL  - 1
IS  - 2
SN  - 2666-3066
UR  - https://doi.org/10.2991/efood.k.191118.001
DO  - 10.2991/efood.k.191118.001
ID  - Khan2019
ER  -