
B Cell Deficiency in Patients with Relapsed and Refractory Acute Myeloid Leukemia
 , Katherine E. Lindblad1, , Rahul Ramraj1, Pradeep K. Dagur3, Julie Thompson1, J. Philip McCoy3, Christopher S. Hourigan1, *,
 - DOI
- 10.2991/chi.k.200712.001How to use a DOI?
- Keywords
- AML; adaptive immunity; B lymphocyte; Tregs; PD-1; immunotherapy
- Copyright
- © 2020 International Academy for Clinical Hematology. Publishing services by Atlantis Press International B.V.
- Open Access
- This is an open access article distributed under the CC BY-NC 4.0 license (http://creativecommons.org/licenses/by-nc/4.0/).
Immune checkpoint inhibition for the treatment of acute myeloid leukemia (AML) has been investigated clinically but has not yet been shown to be more effective than the standard of care treatment [1]. Tumor-specific autologous T cells expressing inhibitory receptors (iRs) are an inherent foundation to this immunotherapy; thus, a detailed picture of cells infiltrating the tumor microenvironment in AML, i.e., the bone marrow (BM), is warranted [2,3]. In this study, we characterized the frequencies and immunophenotypes of adaptive immune cells in the BM of relapsed or refractory AML (R-AML) patients in tandem with age-matched healthy donors (HD) for better contextualization of immunophenotypic variation in both cohorts. We performed deep immunological profiling using multi-parameter flow cytometry of BM of 10 R-AML and 20 age-matched HD, and considered the frequency, composition and expression of clinically relevant iRs across T and B cell subsets in HD and R-AML. Our group previously assessed the BM of this same HD cohort using single-cell RNA sequencing, mass cytometry and flow cytometry to cross-validate these technological approaches and to develop a reference data set for normal immune cell variation in healthy BM [4].
Bone marrow aspirate was collected from patients with R-AML at the National Heart, Lung, and Blood Institute (NHLBI) at the National Institutes of Health (NIH) [5,6]. Adult HD were recruited for BM aspirate collection at the NIH; all subjects were screened on IRB-approved protocols and provided written informed consent. Purification and storage of BM mononuclear cells (BMMCs), multi-parameter flow cytometry, and data acquisition were all performed as previously described [4]. For intracellular FOXP3 staining, BMMCs were fixed and permeabilized using components of the FOXP3 Transcription Staining Buffer Set (eBioscience, Waltham, MA, USA) according to the manufacturer’s protocol, stained for 30 min with FOXP3 antibody in the dark at room temperature, and washed prior to acquisition. In one R-AML patient, we were unable to distinguish between T cells and leukemic blasts due to apparent expression of T cell markers by the AML; we excluded this patient from subsequent T cell analyses. Two-tailed Mann–Whitney U-tests were used to compare variables in the two sample groups. Data analysis and visualization were performed using FlowJo 10.1 (BD, Ashland, OR, USA) and Prism8 (GraphPad, San Diego, CA, USA).
The average age of the ten R-AML patients was 53 years (range 23–68), with four females and six males. All patients had at least one cycle of chemotherapy; none had received previous immune checkpoint therapy. Demographic details on the HD cohort can be found in Oetjen et al. [4]. We had previously identified abnormal B cell phenotypic distributions and function in AML patients in remission [7]. In the current study, HD have an abundant population of CD19+ and CD20+ B cells in the BM, whereas this population was minimal in this group of R-AML patients with active disease (Figure 1A). To ensure this difference was not due to leukemic blast content in R-AML patients, we adjusted the number of live cells used as a denominator for quantification by the clinically reported blast percentage, and calculated B cell frequency as a percentage of live non-blast cells in R-AML. This quantification showed a dramatic and highly significant depletion of CD19+ B cells in AML patients (mean frequency ± standard deviation; HD: 12.4 ± 8.3; AML: 2.9 ± 3.2, p < 0.001) (Figure 1B). The absolute numbers of CD19+ events in AML were too low to confidently quantify transitional, naive, or memory B cell subpopulations and immune checkpoints expressed by these subsets.
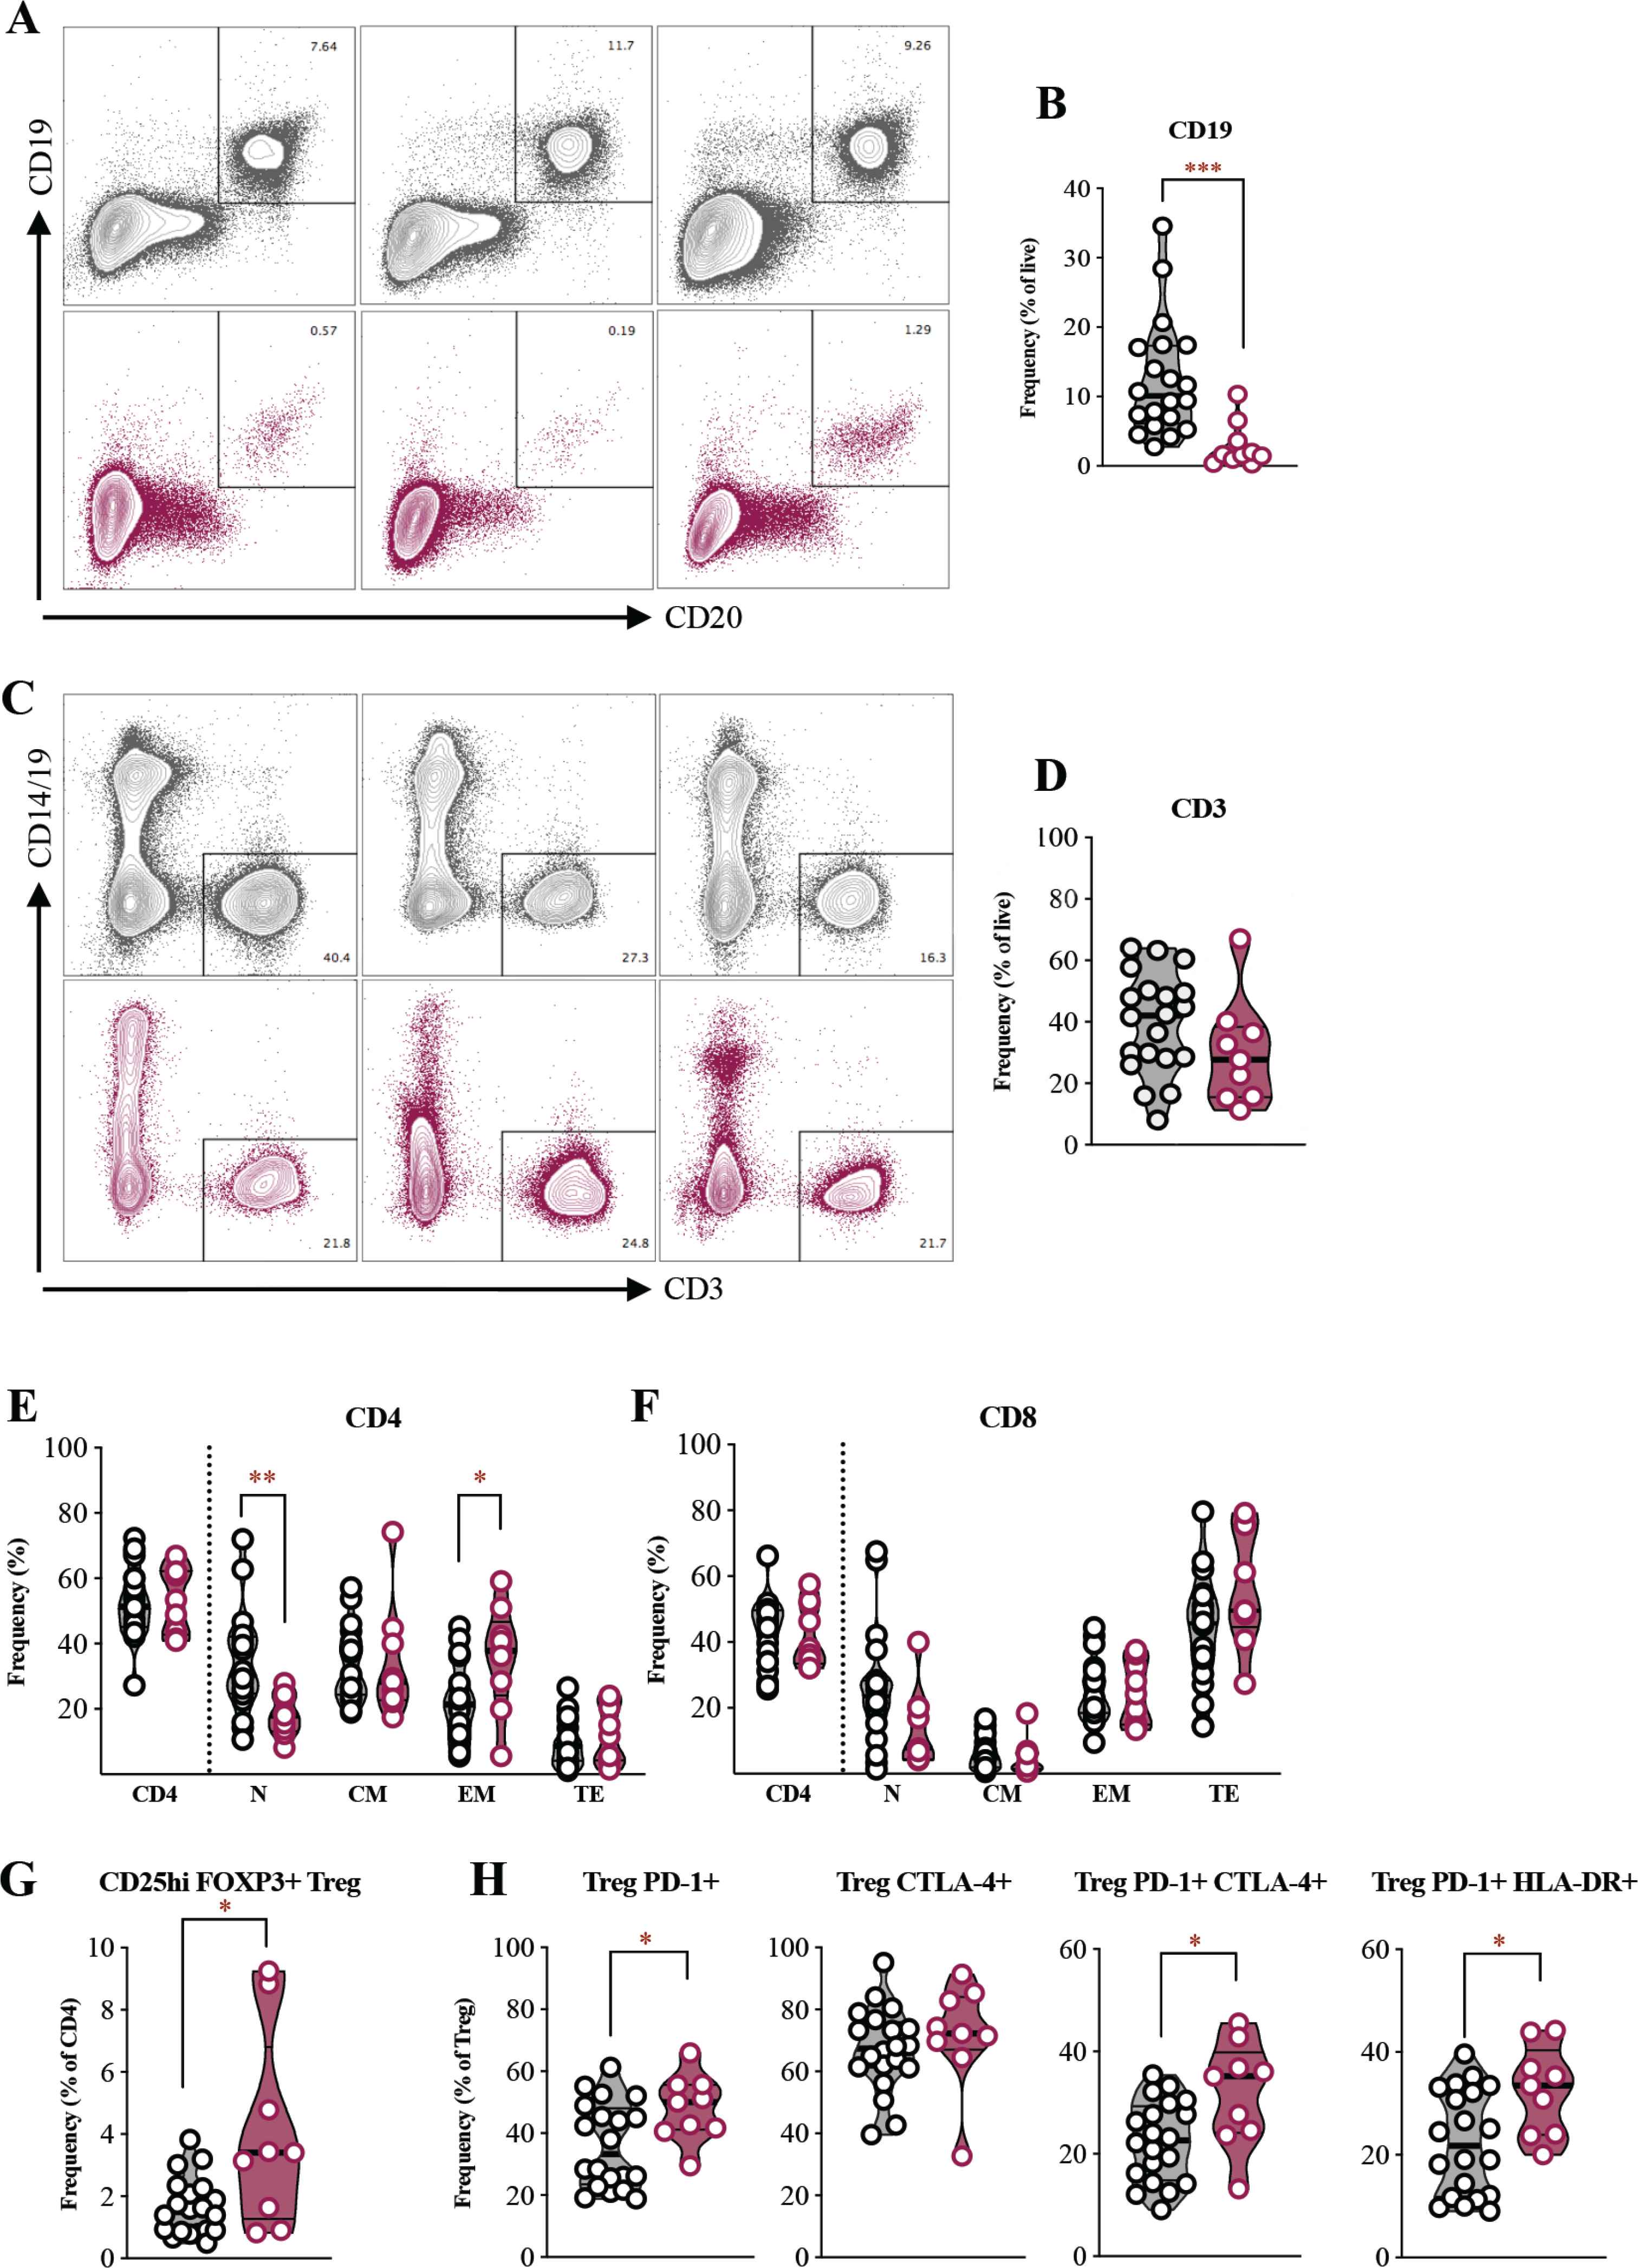
B cell loss but comparable T cell frequencies in R-AML versus HD. (A) Representative multi-parameter flow cytometry (MFC) plots of CD19+ and CD20+ B cells. (B) Frequencies of CD19+ B cells (n = 10 R-AML, n = 20 HD). (C) Representative MFC plots of CD3+ T cells. Y-axis indicates CD14/CD19 exclusion channel. (D) Frequencies of CD3+ T cells (n = 9 R-AML, n = 20 HD). (E and F) Frequencies of CD4+ and CD8+ T cells as a percentage of CD3+ and naïve (N), central memory (CM), effector memory (EM), and terminal effector (TE) as a percentage of either CD4+ or CD8+. (G) Frequency of CD25hi FOXP3+ Tregs. (H) Frequencies of Tregs expressing iRs and activation markers. For MFC plots, representative HD data in gray and R-AML in red. For boxplot panels, HD data in black and gray and R-AML in red. *p < 0.05; **p < 0.01; ***p < 0.001 by Mann–Whitney tests.
The reduced B cell frequencies in BM were in stark contrast to CD3+ T cells. The average and range of T cell frequencies were not different between the R-AML and HD cohorts after a similar adjustment for leukemic blast burden in R-AML (HD: 39.5 ± 16.3; AML: 29.9 ± 17.2) (Figure 1C and 1D). The percentages of CD4+ and CD8+ T cells as well as CD4:CD8 ratio in R-AML were well within the ranges seen in HD. We observed depressed frequencies of naïve CD4+ T cells in R-AML (HD: 39.9 ± 14.8; AML: 22.6 ± 11.0, p < 0.01) and increased CD4+ EM cells (HD: 20.1 ± 11.0; AML: 33.6 ± 17.0, p < 0.05), although the frequencies of these populations in R-AML largely remained within the range seen in HD (Figure 1E). The frequencies of CD8+ naïve, CM, EM, and TE in R-AML were indistinguishable from those in HD (Figure 1F). One notable difference seen, consistent with prior reports, was a higher frequency of Tregs in R-AML (HD: 1.8 ± 1.1; AML: 4.2 ± 3.0, p < 0.05) [8–12]. Three R-AML patients in our cohort had Treg frequencies above the upper limit of that on HD (Figure 1G). Furthermore, iR analysis indicated a higher average PD-1+ expression, as well as higher co-expression of PD-1 with CTLA-4 and HLA-DR in Tregs (Figure 1H). These data confirm that in some AML patients activated and, likely, immunosuppressive Tregs may be increased [13].
To examine patterns of iR co-expression on CD4+ and CD8+ T cells, we used Boolean gating of four iRs (PD-1, TIGIT, CTLA-4, AND TIM-3); the top seven most frequent iR combinations in CD4+ and CD8+ T cells are listed in Table 1. We found that many CD4+ T cells in HD and R-AML did not express any of these iRs. Across HD, as few as 9.7% and as many as 48.9% of CD8+ T cells did not express any of the tested iRs, with a greater range in R-AML (4.9–60.0%). Within the CD4+ compartment of both HD and R-AML, PD-1 was the most commonly singularly expressed iR, followed by TIGIT. In the CD8+ compartment, TIGIT was the most abundantly singularly expressed iR. PD-1 and TIGIT were the most commonly co-expressed iRs in both CD4+ and CD8+ T cells, and frequencies of cells co-expressing these markers were highly similar in R-AML and HD. Of note, we found that 7.9 ± 5.6% and 7.8 ± 6.2% of CD8+ T cells from HD and R-AML, respectively, co-expressed PD-1, TIGIT, and CTLA-4 (Table 1). These cells were predominantly EM and TE phenotypes in patients and HD. Other combinations of iRs outside those listed on Table 1 were rare and accounted for <5% of CD4+ or CD8+ T cells. These data highlight common iR co-expression patterns as well as the overall degree of similarity in terms of iR expression in R-AML and our HD cohort.
| CD8+ T cell | R-AML | HD | ||
| Mean ± std. dev. | Range | Mean ± std. dev. | Range | |
| iR negative | 30.1 ± 16.8 | 4.9 − 60.0 | 27.6 ± 12.2 | 9.7 − 48.9 |
| TIGIT+ | 15.5 ± 9.2 | 5.1 − 34.5 | 11.9 ± 7.1 | 1.0 − 30.3 |
| PD-1+ TIGIT+ | 11.7 ± 6.3 | 3.8 − 22.2 | 11.3 ± 7.2 | 1.5 − 26.9 |
| CTLA-4+ | 7.8 ± 8.0 | 0.6 − 27.0 | 14.7 ± 14.0 | 1.3 − 52.7 |
| PD-1+ CTLA-4+ TIGIT+ | 7.8 ± 6.2 | 0.4 − 20.3 | 7.9 ± 5.6 | 0.4 − 23.8 |
| CTLA-4+ TIGIT+ | 7.2 ± 6.1 | 1.0 − 20.7 | 7.5 ± 6.4 | 1.7 − 22.6 |
| PD-1+ | 6.2 ± 3.0 | 1.7 − 11.6 | 6.7 ± 3.8 | 0.8 − 16.2 |
| CD4+ T cell | R-AML | HD | ||
| Mean ± std. dev. | Range | Mean ± std. dev. | Range | |
| iR negative | 48.6 ± 8.0 | 39.9 − 61.6 | 58.9 ± 9.4 | 40.1 − 76.5 |
| PD-1+ | 14.6 ± 7.7 | 3.6 − 28.5 | 10.7 ± 6.5 | 2.5 − 31.5 |
| TIGIT+ | 9.9 ± 6.3 | 4.0 − 23.4 | 6.2 ± 3.1 | 2.5 − 14.5 |
| PD-1+ TIGIT+ | 7.3 ± 1.7 | 4.1 − 10.0 | 5.5 ± 2.9 | 1.2 − 11.8 |
| CTLA-4+ | 4.2 ± 2.4 | 1.1 − 8.7 | 4.0 ± 2.3 | 1.5 − 11.7 |
| TIM-3+ | 4.1 ± 1.6 | 2.2 − 6.9 | 6.4 ± 3.5 | 1.4 − 16.5 |
| PD-1+ CTLA4+ | 3.3 ± 2.3 | 0.4 − 7.2 | 2.4 ± 1.2 | 0.6 − 5.5 |
All values represent percentages. Std. dev, indicates standard deviation; iR, inhibitory receptor.
Abundant combinatorial iR patterns in CD8+ and CD4+ T cells
In summary, we have shown that R-AML patients have marked reductions of CD19+ B cells in their BM. This was striking, given the preservation of the T cell compartment in R-AML. A subset of R-AML patients had elevated frequencies of Tregs, but the non-Treg T cell subsets in R-AML were similar to those seen in a cohort of age- and gender-matched HD. Our data on T cell subset frequencies in R-AML are consistent with those previously published, but place these findings in the context of the wide variation that occurs in healthy individuals during aging [14,15]. These data also expand our previous analysis of the immune infiltrate in the BM of HD, by adding iR expression information on T cell subsets [4]. Together, our results reveal a preserved pool of antigen-experienced T cells expressing PD-1 and other iRs within the BM of R-AML. The observed depletion of B cells in these patients’ BM may have consequences for immunotherapies intended to augment existing anti-tumour immunity [16–19].
CONFLICTS OF INTEREST
CSH receives research funding from Merck, Sharpe, & Dohme and SELLAS Life Sciences Group AG. The other authors declare no conflicts of interest.
AUTHORS’ CONTRIBUTION
MG designed and performed experiments, analyzed data, wrote the manuscript, and prepared the figures. KEL performed experiments and analyzed data. RR analyzed data. PKD and JPM designed and supervised the research. JT cared for patients and coordinated donor recruitment. CSH cared for patients, designed and supervised the research, and edited the manuscript. All authors read, reviewed, and approved the final manuscript.
FUNDING
This research was supported by the
ACKNOWLEDGMENTS
We are grateful to Catherine Lai, Sheenu Sheela, Christin DeStefano, Janet Valdez, and the NHLBI research nurses for caring for patients and bone marrow aspirate procurement and to Karolyn Oetjen for technical input. This work is part of Meghali Goswami’s dissertation in partial fulfillment of the requirements for the PhD degree in the Molecular Medicine Program of the Institute for Biomedical Sciences at The George Washington University.
REFERENCES
Cite this article
TY  - JOUR
AU  - Meghali Goswami
AU  - Katherine E. Lindblad
AU  - Rahul Ramraj
AU  - Pradeep K. Dagur
AU  - Julie Thompson
AU  - J. Philip McCoy
AU  - Christopher S. Hourigan
PY  - 2020
DA  - 2020/07/29
TI  - B Cell Deficiency in Patients with Relapsed and Refractory Acute Myeloid Leukemia
JO  - Clinical Hematology International
SP  - 125
EP  - 128
VL  - 2
IS  - 3
SN  - 2590-0048
UR  - https://doi.org/10.2991/chi.k.200712.001
DO  - 10.2991/chi.k.200712.001
ID  - Goswami2020
ER  -