
Allogeneic Stem Cell Transplantation for FLT3-Mutated Acute Myeloid Leukemia: In vivo T-Cell Depletion and Posttransplant Sorafenib Maintenance Improve Survival. A Retrospective Acute Leukemia Working Party-European Society for Blood and Marrow Transplant Study
Peer review is under the responsibility of IACH
- DOI
- 10.2991/chi.d.190310.001How to use a DOI?
- Keywords
- Allogeneic stem cell transplantation; Acute myeloid leukemia; FLT3 mutation; In vivo T-cell depletion; Sorafenib
- Abstract
Acute myeloid leukemia (AML) with FLT3-mutation carries a poor prognosis, and allogeneic stem cell transplantation (allo-SCT) is recommended at first complete remission (CR1). We assessed 462 adults (median age 50 years) with FLT3-mutated AML allografted between 2010 and 2015 from a matched related (40%), unrelated (49%), or haploidentical donor (11%). The median follow-up of alive patients was 39 months. Day-100 acute graft versus host disease (GVHD) grades II–IV and III–IV were encountered in 26% and 9%, whereas the 2-year incidence of chronic and extensive chronic GVHD were 34% and 16%, respectively. The 2-year incidences of relapse and nonrelapse mortality were 34% and 15%, respectively. The 2-year leukemia-free survival, overall survival (OS), and GVHD relapse-free survival (GRFS) were 51%, 59%, and 38%, respectively. In multivariate analysis, NPM1-mutation, transplantation in CR1, in vivo T-cell depletion, and posttransplant sorafenib improved OS, whereas more than one induction (late CR1) negatively affected OS. Similarly, NPM1-mutation, a haploidentical donor, T-cell depletion, and sorafenib maintenance improved GRFS, whereas late CR1 or persistent disease negatively affected it. In conclusion, FLT3-mutated AML remains a challenge even following allo-SCT. In vivo T-cell depletion and posttransplant sorafenib significantly improve OS and GRFS, and may be considered as standard of care.
- Copyright
- © 2019 International Academy for Clinical Hematology. Publishing services by Atlantis Press International B.V.
- Open Access
- This is an open access article distributed under the CC BY-NC 4.0 license (http://creativecommons.org/licenses/by-nc/4.0/).
1. INTRODUCTION
FMS-like tyrosine kinase 3 (FLT3) internal tandem duplication (FLT3-ITD) or tyrosine kinase domain (FLT3-TKD) gene mutations are encountered in around 30% of acute myeloid leukemia (AML) [1–4]. The presence of FLT3 mutations, predominantly FLT3-ITD, confers a poor prognosis [5–8]. Consequently, these patients are usually referred to allogeneic stem cell transplantation (allo-SCT) in first complete remission (CR1) [9,10]. The 2017 report from the European Leukemia Net (ELN) classified AML patients with concomitant nucleophosmin-1 (NPM1) mutation and a low allelic ratio of FLT3-ITD in the favorable category [11]. However, a recent Japanese study reported that performing allo-SCT in CR1 significantly improves the outcome in these patients, irrespective of the FLT3-ITD allele ratio [12]. Unfortunately, patients with FLT3-ITD mutation still carry a poor prognosis after allo-SCT because of higher rates of early relapse and the lack of response to chemotherapy in the salvage setting [13,14].
Important progress has been made in recent years, including improvement of transplant techniques, the use of haplo-identical donors in patients lacking a Human Leukocyte antigen (HLA) matched donor, and posttransplant preventive strategies, such as prophylactic or preemptive use of tyrosine kinase inhibitors (TKI). Several TKIs have been recently used in FLT3-mutated AML, either as single agents or in combination with chemotherapy [15]. Because of its availability, sorafenib has been tested, alone or in combination, in various settings in FLT3-ITD AML, such as first-line therapy [16] or treatment of relapse [15,17–19], including relapse after allo-SCT [19–28]. However, the ideal time to incorporate this drug into the treatment of patients with FLT3-mutated AML remains unclear, with some recent reports suggesting promising long-term outcomes when sorafenib is used as maintenance therapy after allo-SCT [15,29–33]. More recently, midostaurin, a multi-kinase inhibitor, was shown to improve overall survival (OS) of FLT3-mutated AML when combined with chemotherapy in first-line therapy, and was recently granted approval in this setting [34].
As structured data on the influence of these recent developments in the transplant field in the FLT3-mutated AML setting are scarce, the purpose of the present study was to assess the predictive factors for posttransplant outcomes in FLT3-mutated AML patients, using a large sample from the European Society for Blood and Marrow Transplantation (EBMT) registry.
2. MATERIALS AND METHODS
2.1. Study Design and Data Collection
This is a retrospective registry-based multicenter analysis. Data were provided and approved for this study by the acute leukemia working party (ALWP) of the EBMT. EBMT is a voluntary working group of more than 600 transplant centers which are required to report all consecutive SCT and follow-up once a year. Audits are routinely performed to determine the accuracy of the data. Since January 1, 2003, all transplant centres have been required to obtain written informed consent prior to data registration with the EBMT, following the Helsinki Declaration of 1975. Eligibility criteria for this analysis included adult patients (age > 18 years) with FLT3-mutated AML who received a first allo-SCT with bone marrow (BM) or G-CSF-mobilized peripheral blood (PB) stem cells from an HLA-matched related or unrelated or haploidentical donor between 2010 and 2015. Patients who received cord blood or mismatched stem cells were excluded.
Variables collected included recipient and donor age and gender, date of diagnosis, cytogenetic and molecular profile, lines of therapy prior to allo-SCT, use of pretransplant sorafenib, disease and minimal residual disease (MRD) status at transplant, Karnovsky score at time of transplant, transplant-related factors including conditioning regimen, in vivo T-cell depletion, graft versus host disease (GVHD) prophylaxis, stem cell source (BM or PB), donor type, patient and donor cytomegalovirus (CMV) status. Finally, we collected data on prophylactic or preemptive use of sorafenib, including the date of its administration after allo-SCT, the dose and duration of therapy, and its side effects.
2.2. Definitions
Myeloablative conditioning (MAC) was defined as a regimen containing either total body irradiation (TBI) with a dose greater than 6 Gy, a total dose of oral busulfan (Bu) greater than 8 mg/kg, or a total dose of intravenous Bu greater than 6.4 mg/kg. All other regimens were defined as reduced intensity conditioning (RIC) [35]. The diagnosis and grading of acute [36] and chronic graft-versus-host disease [37] were performed by transplant centers using the standard criteria. Cytogenetic abnormalities were classified according to MRC criteria [38].
2.3. Statistical Analysis
Endpoints included leukemia-free survival (LFS), OS, nonrelapse mortality (NRM), relapse incidence (RI), acute and chronic GVHD, and GVHD and relapse-free survival (GRFS). All outcomes were measured from the time of allo-SCT. LFS was defined as survival without leukemia relapse or progression; patients alive without leukemia relapse or progression were censored at the time of last contact. OS was defined as death from any cause. NRM was defined as death without previous leukemia relapse. GRFS was defined as events including grade 3–4 acute GVHD, extensive chronic GVHD, relapse, or death in the first post-SCT year [39]. Surviving patients were censored at the time of last contact. The probabilities of OS and LFS were calculated by the Kaplan–Meier method. Cumulative incidence functions were used to estimate RI and NRM in a competing risk setting. Death and relapse were considered as competing events for acute and chronic GVHD. For univariate analyses, continuous variables were categorized and the median used as a cutoff point. Univariate comparisons were performed using the log-rank test for LFS, OS, and GRFS and Gray's test for cumulative incidences. A Cox proportional hazards model was used for multivariate regression including sorafenib posttransplant as a time-dependent variable. Factors known to influence the outcome and factors associated with a P value less than 0.10 with any endpoint by univariate analysis were included in the model.
The impact of sorafenib posttransplant was also studied using a matched pair analysis. Matching factors included conditioning (reduced intensity [RIC]versus MAC), status at transplant (CR1 versus CR2 versus active disease), harboring of NPM1 mutations, and age at transplant. In order to avoid immortal time bias due to the time elapsed from transplant to sorafenib administration, each control patient had to engraft and to be alive free of acute GVHD grade II-IV and of relapse at least as long as the time to sorafenib initiation of the respective matched sorafenib recipient. Patient, disease, and transplant-related characteristics for the two cohorts were compared either by (paired) Wilcoxon signed rank tests or Mann–Whitney test for continuous variables, chi-square, or McNemar test for categorical variables. Comparison of the outcome was performed using a Cox model stratified on matching group for taking into account the association.
Results were expressed as hazard ratio (HR) with 95% confidence interval (CI). All tests were two sided. The type-1 error rate was fixed at 0.05 for determination of factors associated with time to event outcomes. All analyses were performed using SPSS 24.0 (SPSS Inc, Chicago, IL, USA)) and R version 3.4.0 (R Core Team. R: a language for statistical computing. 2014. R Foundation for Statistical Computing, Vienna, Austria).
3. RESULTS
3.1. Patients' and Transplant Characteristics
Patients' and transplant characteristics are summarized in Tables 1 and 2. Altogether, 462 patients (49% females; median age 50 years; range 19–75) met the eligibility criteria for this study. The karyotype was favorable in 18 (4%), intermediate in 379 (82%), and adverse in 45 patients (10%). Mutation analysis showed FLT3 ITD in 437 patients (95%), FLT3 TKD in 11 (2%), both ITD and TKD in 14 (3%), whereas NPM1 mutations were detected in 231 patients (55%). Most (71.5%) patients were transplanted in CR1, 10.5% in CR2 and 18% with active disease. A second induction was given to 38% of patients and 75% received consolidation therapy. Pretransplant sorafenib was given to 9 patients during induction, to 10 during consolidation, and to 8 as salvage therapy. At the time of transplant, 61 patients in CR were MRD-positive, 150 MRD-negative, while the MRD status was not evaluated in 150 and was unknown in 16 patients. The conditioning was MAC in 53% of patients and RIC in 47%.
| Patients Characteristics | N (%) |
|---|---|
| Number of patients | 462 (100) |
| Gender | |
| Male | 234 (51) |
| Female | 228 (49) |
| Age at transplant, median (range) | 50 (19–75) |
| Year of transplant, median (range) | 2013 (2010–2015) |
| FLT3 Mutation Status | |
| FLT3-ITD | 437 (95) |
| FLT3-TKD | 11 (2) |
| FLT3-ITD and FLT3 TKD | 14 (3) |
| NPM1 Mutation Status | |
| Positive | 231 (55) |
| Negative | 191 (45) |
| Not available | 40 |
| Cytogenetics Risk | |
| Good | 18 (4) |
| Intermediate | 379 (82) |
| Adverse | 45 (10) |
| Not assessed or failed | 20 (4) |
| Induction | |
| Number of inductions, median (range) | 1 (1–8) |
| 1 induction | 288 (62) |
| >1 induction | 174 (38) |
| Sorafenib at induction | 9 (2) |
| No sorafenib at induction | 453 (98) |
| CR after first induction | 326 (74) |
| No CR after first induction | 116 (26) |
| Missing status post induction | 20 |
| Consolidation | |
| Received consolidation | 348 (75) |
| No consolidation | 113 (25) |
| Consolidation information missing | 1 |
| Sorafenib for consolidation | 10 (2) |
| Salvage | |
| Received salvage therapy | 85 (51) |
| No salvage therapy | 81 (49) |
| Sorafenib for salvage | 8 (5) |
| Not applicable | 296 |
| Patient CMV Serological Status | |
| Positive | 290 (63) |
| Negative | 170 (37) |
| Missing | 2 |
| Donor CMV Serological Status | |
| Positive | 252 (55) |
| Negative | 208 (45) |
| Missing | 2 |
Abbreviations: CR: Complete remission, CMV: Cytomegalovirus, FLT3: FMS-like tyrosine kinase 3, ITD: Internal tandem duplication, TKD: Tyrosine kinase domain.
Patients' and disease characteristics.
| Characteristics | N (%) |
|---|---|
| Status at Transplant | |
| CR1 | 330 (71.4) |
| CR2 | 48 (10.4) |
| Active disease | 84 (18.2) |
| Donor Information | |
| Matched sibling donor | 187 (40.5) |
| Matched unrelated donor | 226 (49) |
| Allelic level 10/10 | 157 (34) |
| Allelic level 9/10 | 35 (8) |
| Allelic level 8/10 | 7 (2) |
| Allelic level unknown | 27 (6) |
| Haploidentical donor | 49 (10.6) |
| Donor Gender | |
| Male | 275 (60) |
| Female | 185 (40) |
| Missing information | 2 |
| Number of Female to Male Transplants | 87 (18.8) |
| Conditioning | |
| Myeloablative | 246 (53) |
| Reduced intensity | 216 (47) |
| In vivo T-cell depletion | 285 (61.8) |
| No in vivo T-cell depletion | 176 (38.2) |
| Missing information for T-cell depletion | 1 |
| Stem Cell Source | |
| Bone marrow | 78 (16.9) |
| Peripheral blood | 384 (83.1) |
| Received Sorafenib Prophylaxis Posttransplant | 19 (4.1) |
| Minimal Residual Disease | |
| Negative | 218 (76.5) |
| Positive | 67 (23.5) |
| Missing information | 177 |
| Received Preemptive Sorafenib Posttransplant | 10 (2) |
| Median Follow-Up Months (Range) | 39.4 (0.8–86.7) |
Abbreviations: CR: Complete remission, MRD: Minimal residual disease.
Transplant characteristics.
In vivo T-cell depleted (TCD) graft was given to 285 (62%) patients (89 [48%] in the MSD group, 172 [76%] in the matched unrelated sibling (MUD) group, and 24 [49%] in the Haplo group). Overall, 276 patients received ATG and 9 received campath. The median dose of ATG was 5 mg/kg (2.5–15) for thymoglobulin (n = 189), 30 mg/kg (16–60) for fresenius ATG (n = 67), and unknown for 20 patients. Most patients (83%) received peripheral blood stem cells from matched related (187 patients; 40%), matched unrelated (226 patients; 49%), or haploidentical donors (49 patients; 11%). Most patients (63%) and donors (55%) were CMV positive. Nineteen percent of patients were males with a female donor. The median follow-up of alive patients was 39 months (range 1–87).
3.2. Posttransplant Sorafenib
Twenty-eight patients received posttransplant sorafenib maintenance: 18 as prophylaxis while MRD-negative; 9 as preemptive therapy for positive MRD, and one patient received both prophylaxis and then preemptive sorafenib. Sorafenib treatment was initiated at a median of 55 days posttransplant (range 1–173) at a median dose of 800 (range 200–800) mg daily. Sorafenib was temporarily interrupted in 11 patients and the dose was modified in 12 patients, mainly because of side effects including skin rash (2 patients), skin GVHD (3 patients), and hematological toxicity, diarrhea, increase in amylase, acute myocardial infection, fatigue, decision of third party payer, and disease relapse 1 patient each. The median modified daily dose was 400 mg (range 200–800). The median duration of prophylactic sorafenib was 446 days (range 5–1205) and of preemptive sorafenib 385 days (range 16–820). Out of the 3 patients in the sorafenib group who experienced acute GVHD grade III, acute GVHD occurred before the infusion of sorafenib in 2 patients, at day 24 and day 34 (93 days and 23 days before sorafenib, respectively). One patient experienced acute GVHD III-IV at day 41, 4 days after the infusion of sorafenib. We also observed 6 acute GVHD grade II at a median of 13 days after initiation of sorafenib (range 6–59). Thirteen patients in the sorafenib group had chronic GVHD at a median time of 76 days after the infusion of sorafenib (range: 9–194). The grade was limited for 7 patients and extensive for 6 patients.
3.3. Transplant Outcomes
Day 100 acute GVHD grades II–IV and III–IV were encountered in 26% and 9% of patients, respectively, whereas the 2-year cumulative incidence of chronic and extensive chronic GVHD were 34% and 16%, respectively (Fig. 1). The 2-year RI and NRM were 34% and 15%, respectively (Fig. 2). The 2-year LFS, OS, and GRFS were 51%, 59%, and 38%, respectively (Fig. 2). Overall, 204 patients died primarily from the original disease (115 patients; 57%), followed by acute GVHD (39 patients; 19%) and infections (24 patients; 12%). In univariate analysis, patient age, intensity of conditioning, donor type, stem cell source, patient, and donor CMV status did not affect any of the transplant outcomes (Supplementary Tables S1 and S2). Conversely, some transplant outcomes were affected by the patient or donor gender, NPM1 mutation status, number of inductions and use of consolidation, and year of transplant. Transplantation in CR1 was associated with a significantly better outcome as compared to CR2 and active disease, with 2-year LFS of 58%, 46%, and 29%, respectively (p < .001), 2-year OS of 66%, 50%, and 35%, respectively (p < .001), and 2-year GRFS of 43%, 44%, and 19%, respectively (p < .001) (Fig. 3 and Supplementary Tables S1 and S2). Finally, in vivo T-cell depletion was also associated with a significantly better 2-year LFS of 56% versus 45% (p = 0.034), OS of 62% versus 54% (p = 0.1), and GRFS of 45% versus 29% (p < .001) (Fig. 4 and Supplementary Tables S1 and S2).
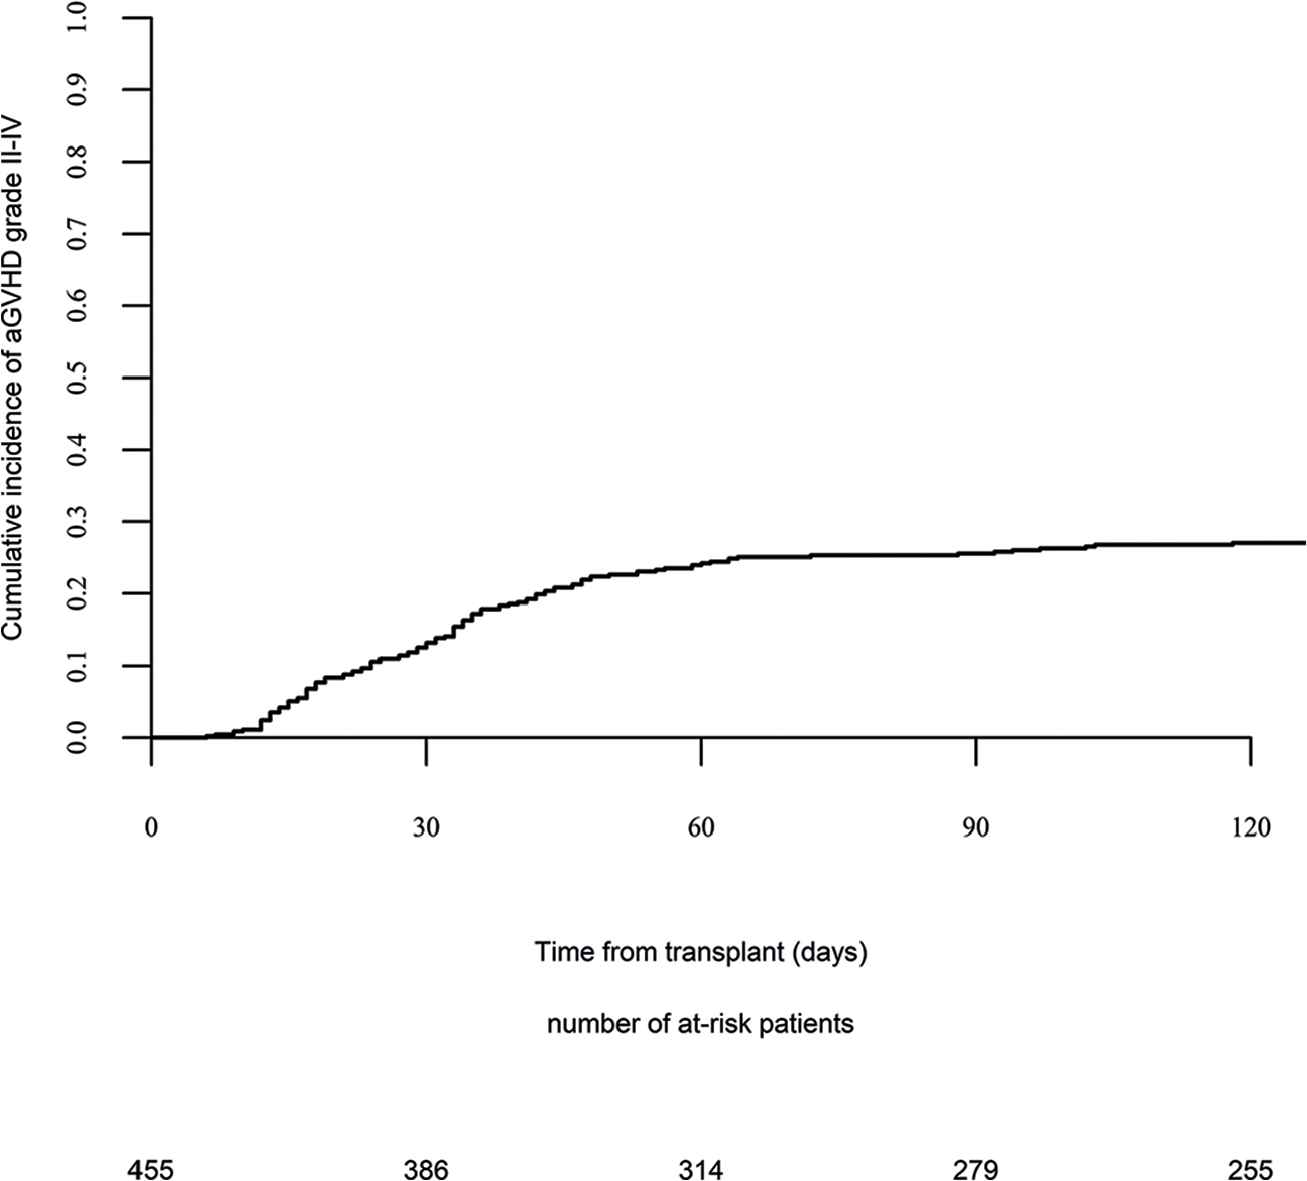
Acute graft versus host disease (GVHD) II–IV.
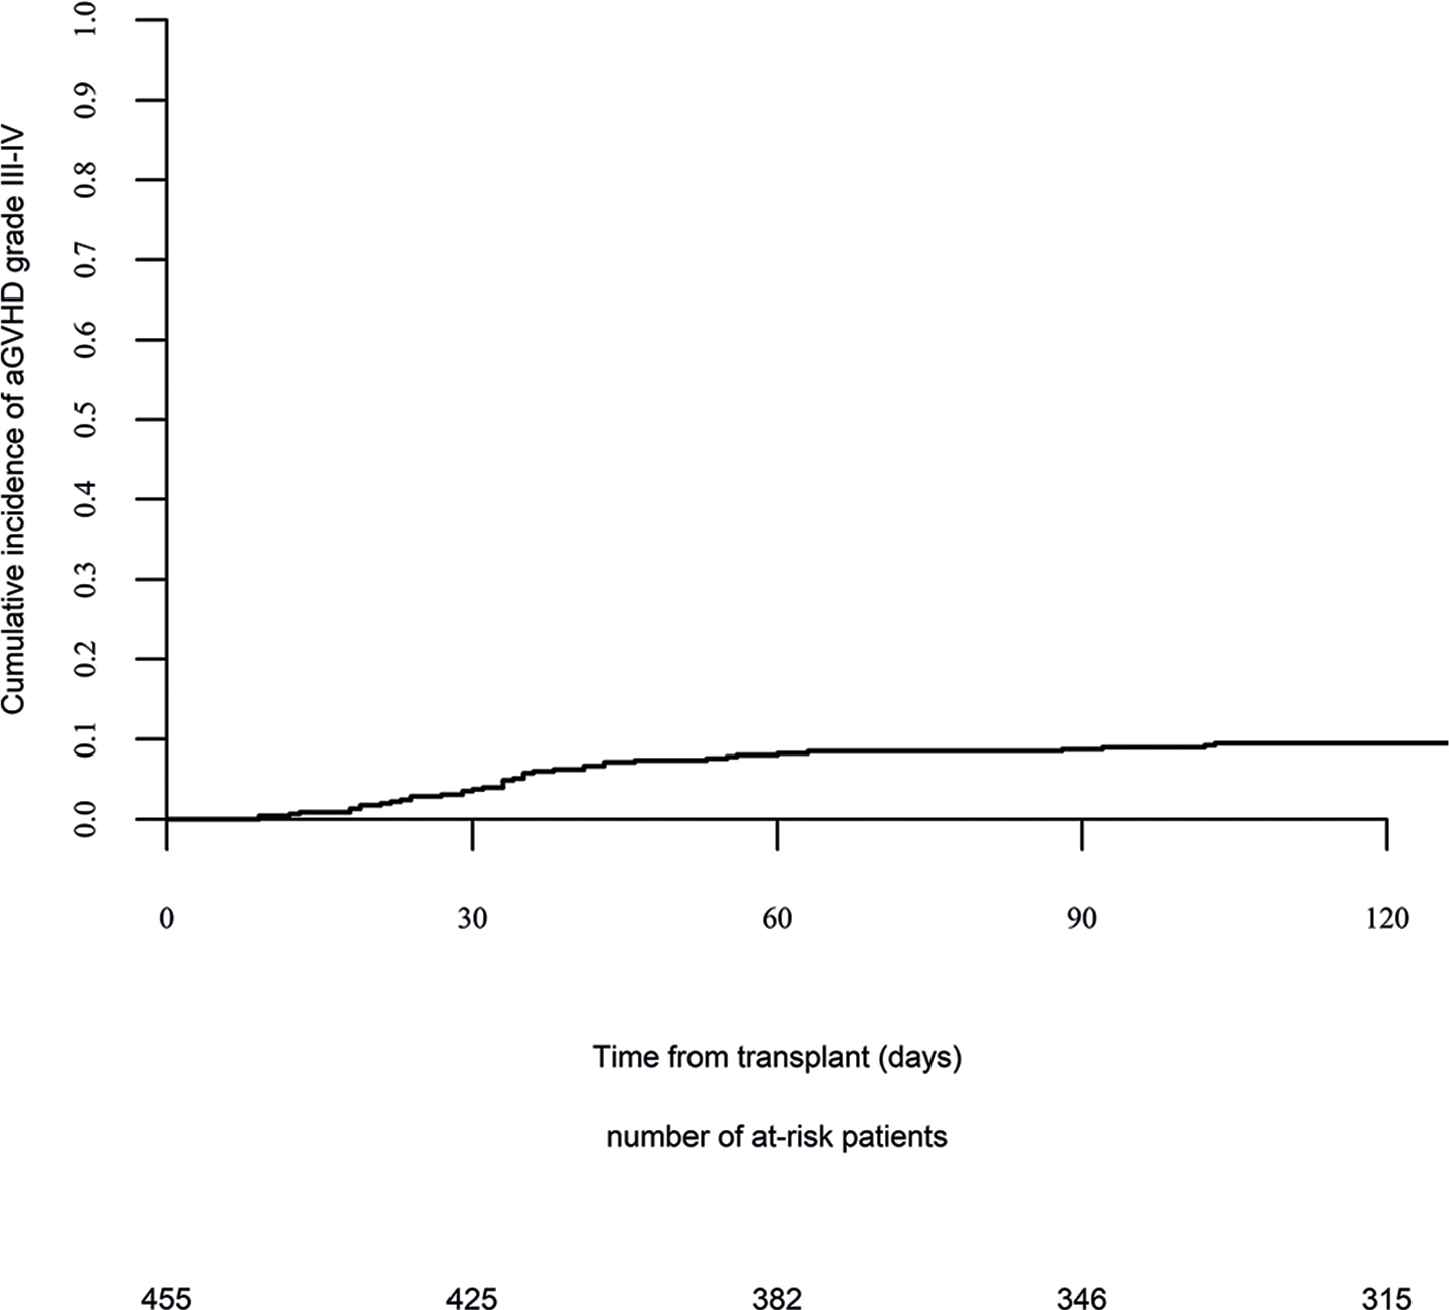
Acute graft versus host disease (GVHD) III–IV.
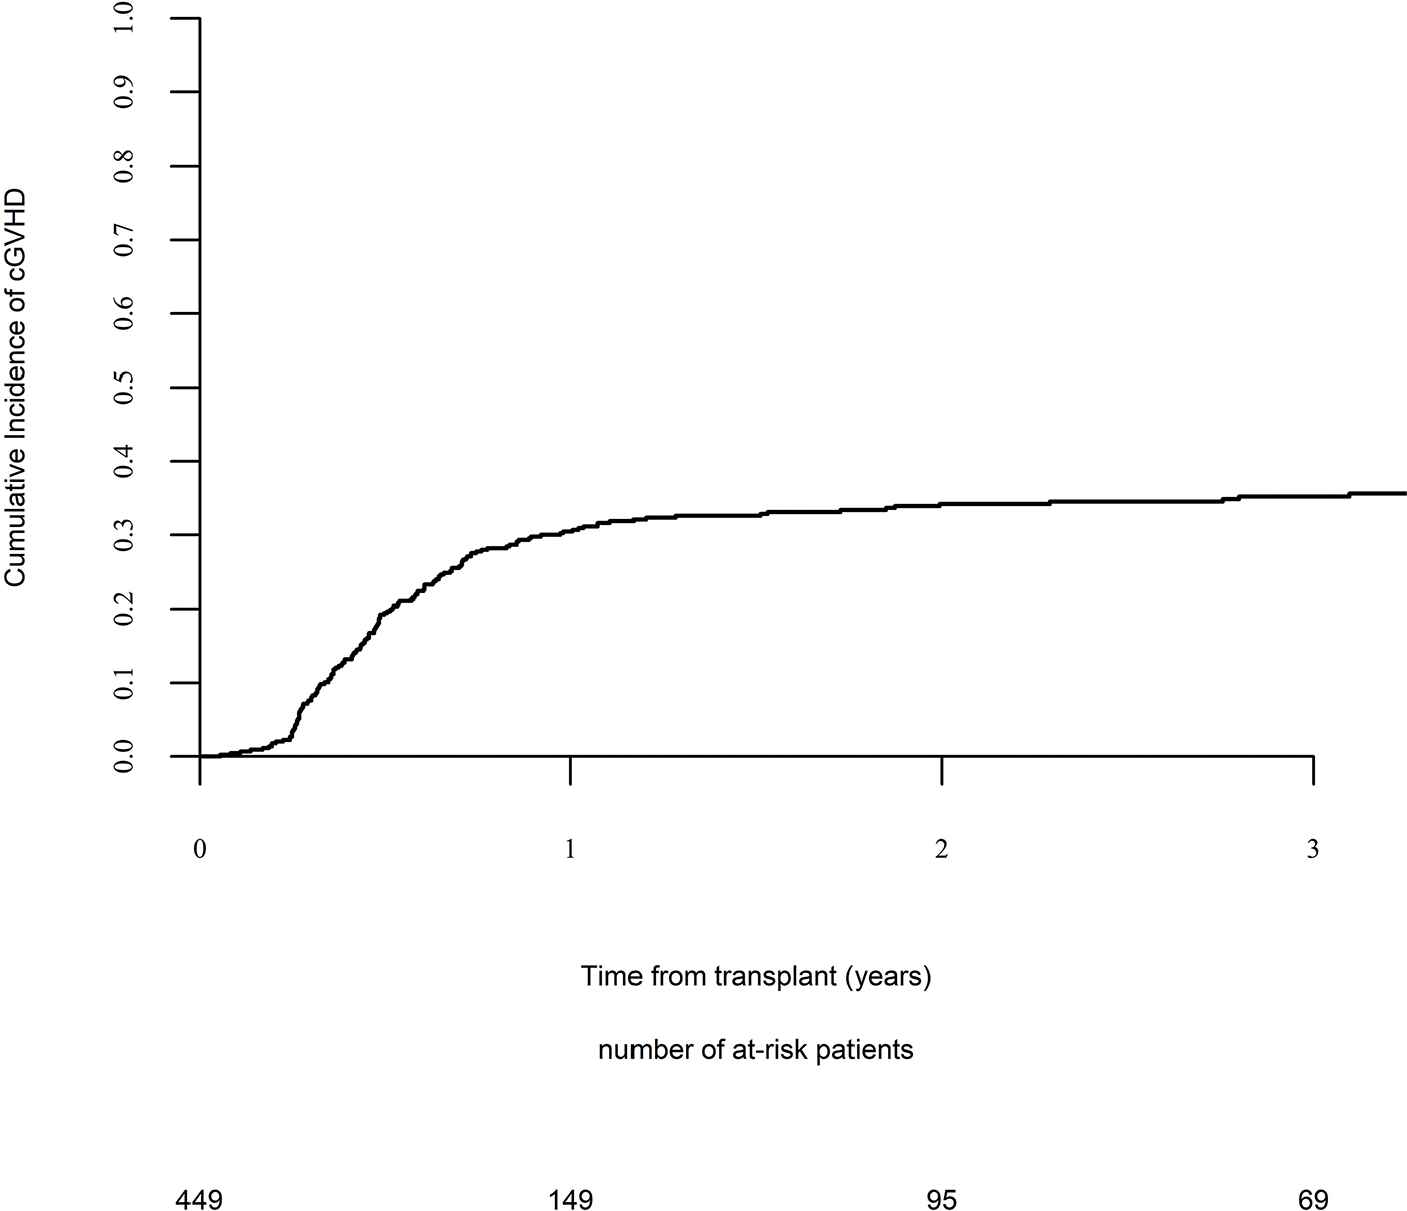
Chronic graft versus host disease (GVHD).
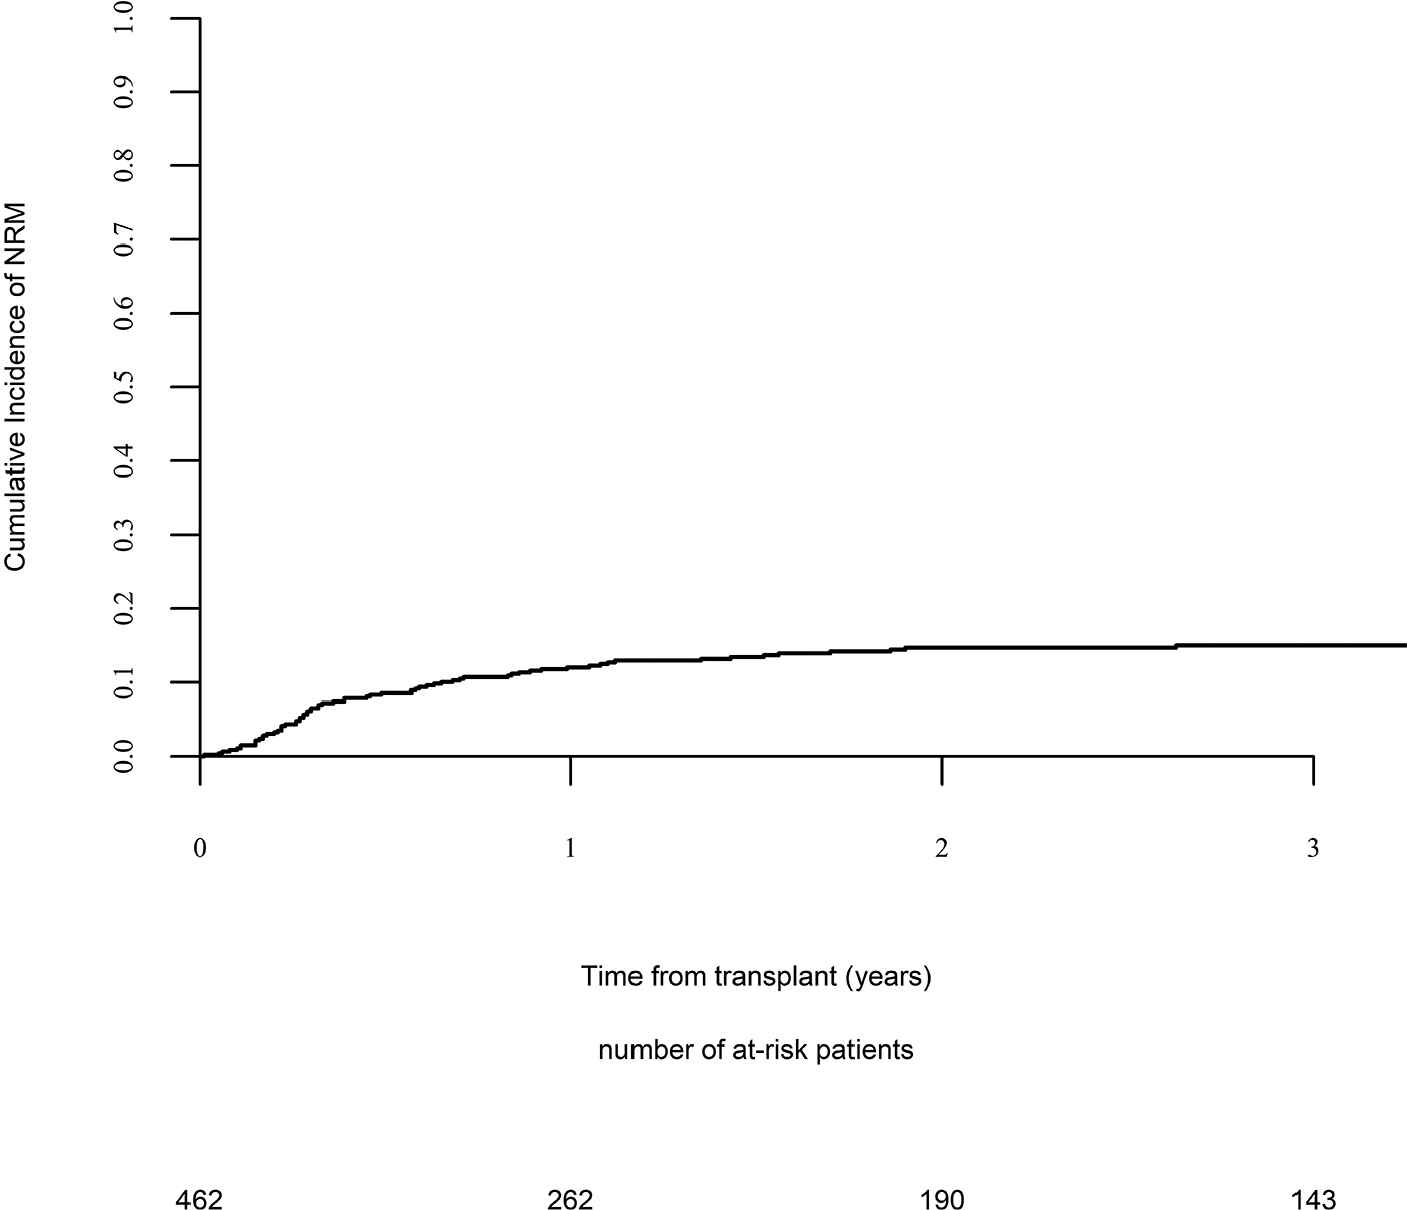
Nonrelapse mortality.
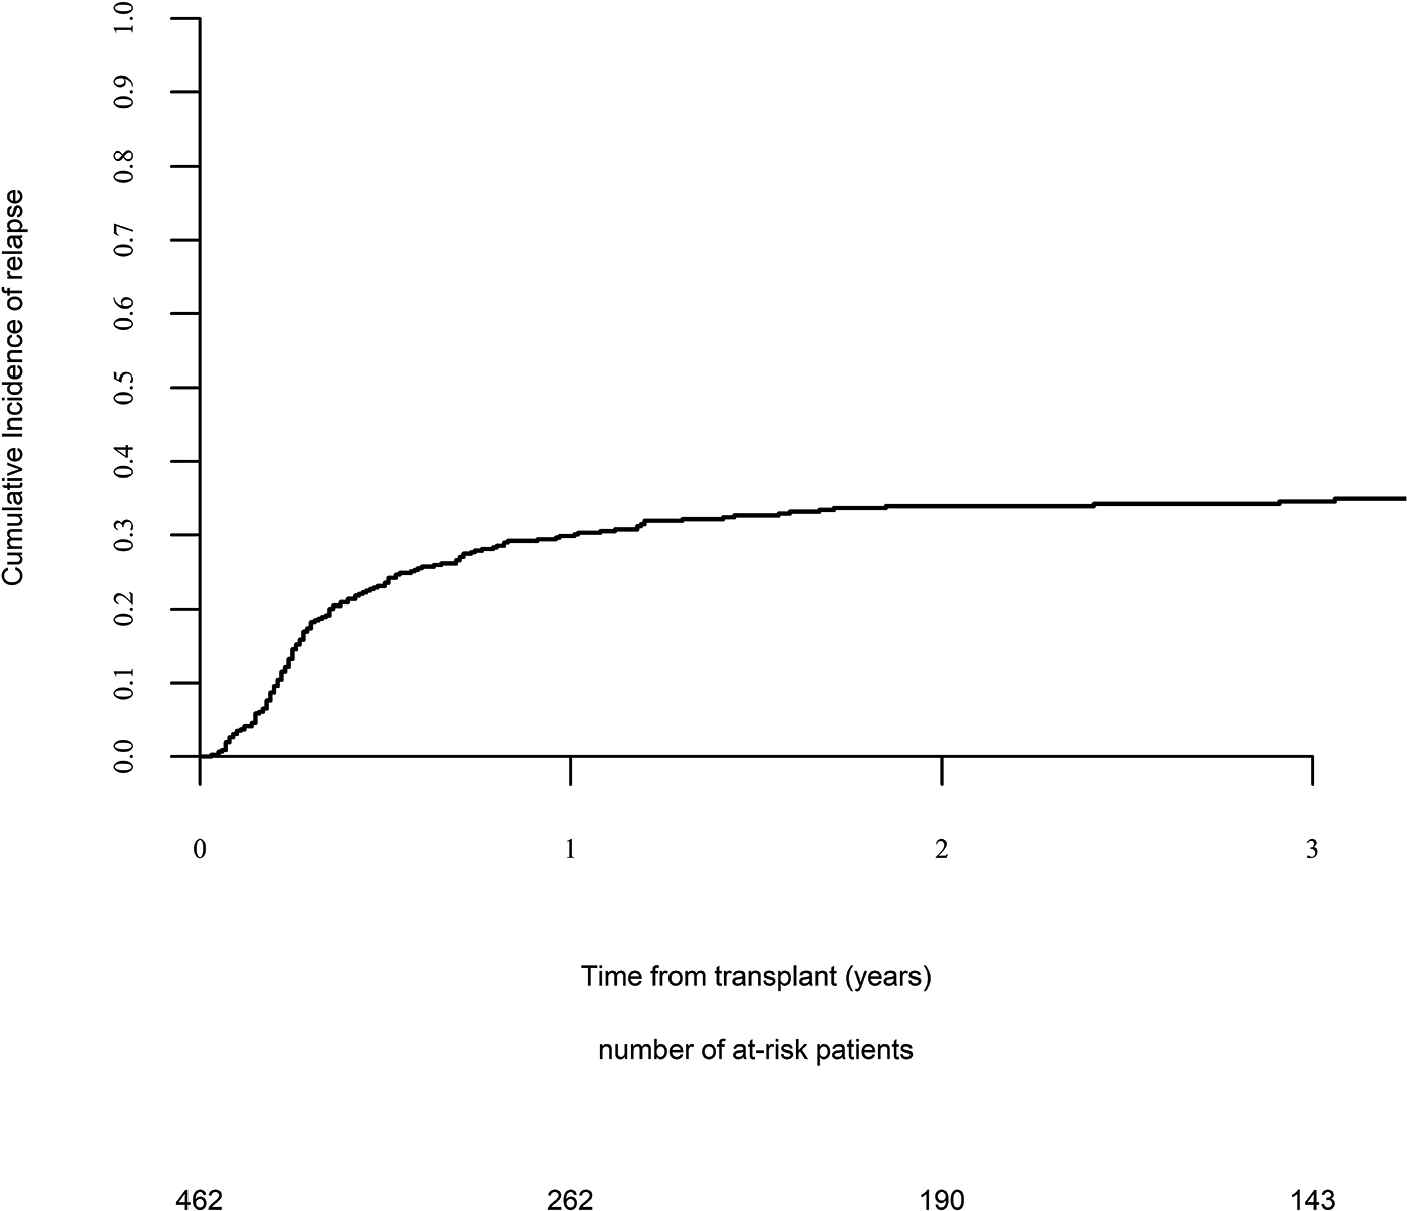
Relapse incidence.
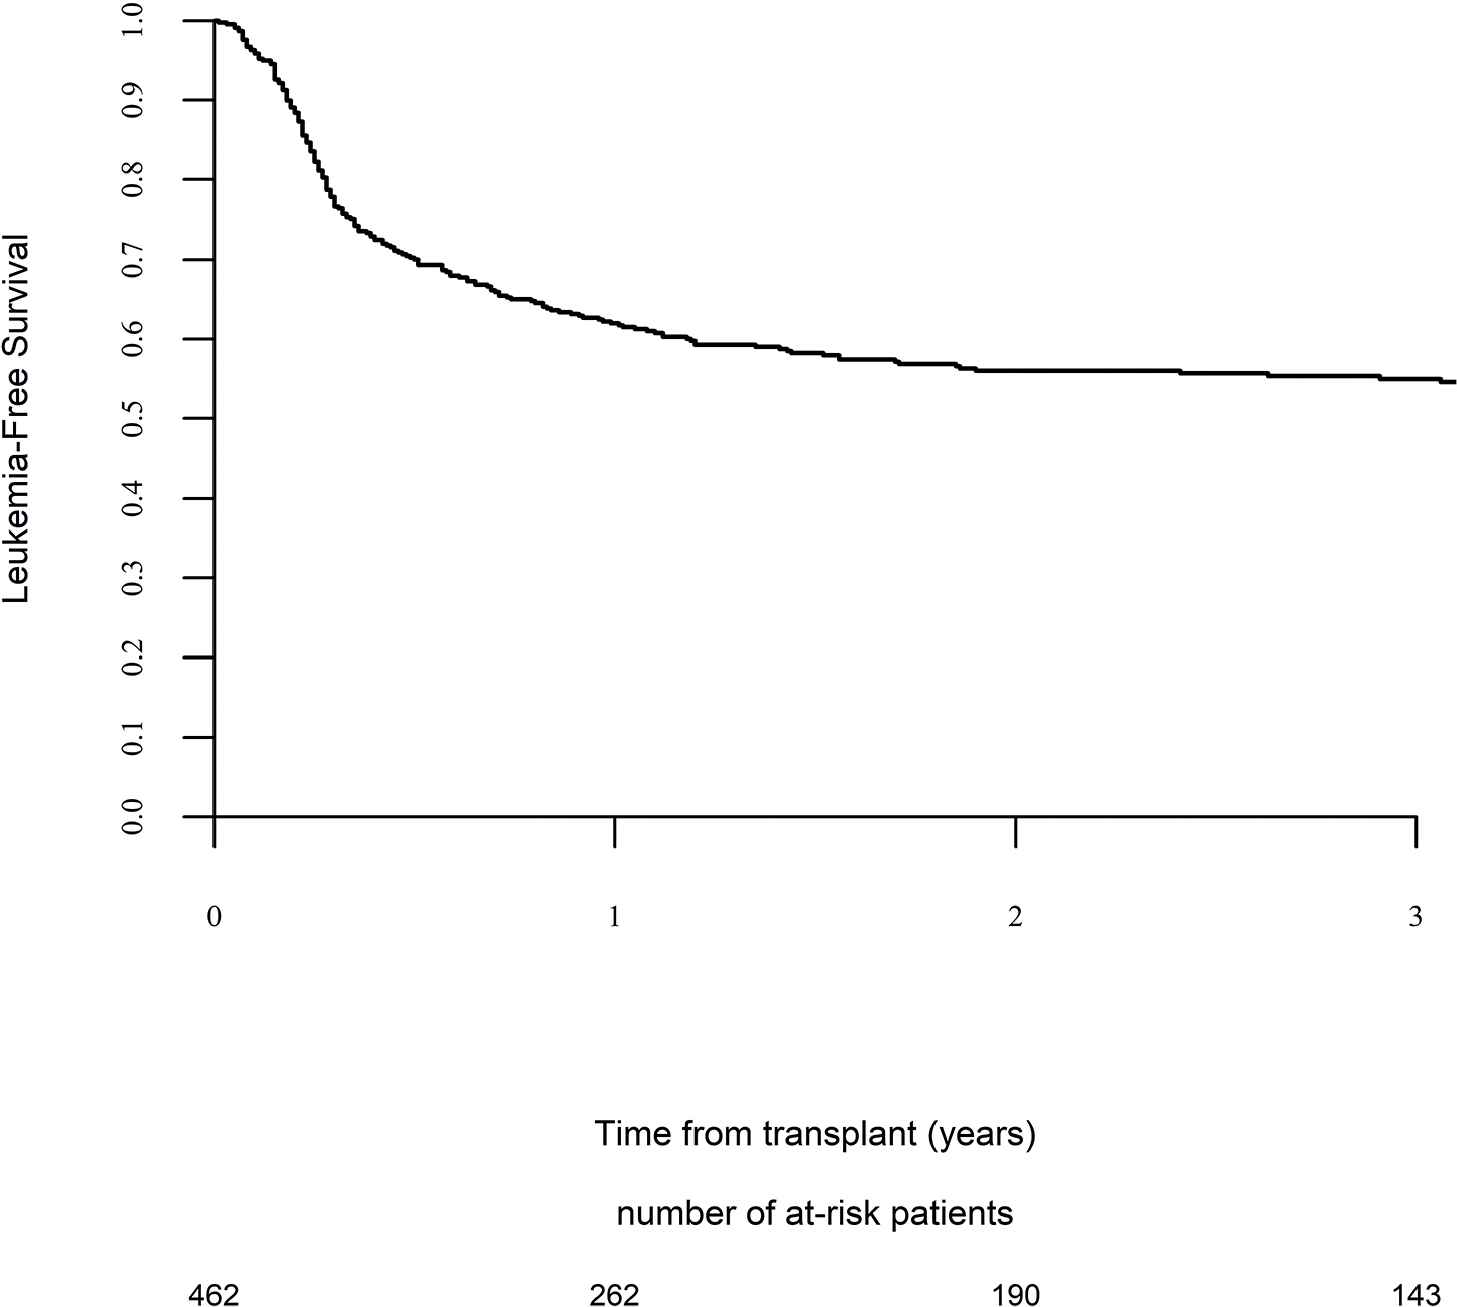
Leukemia-free survival.
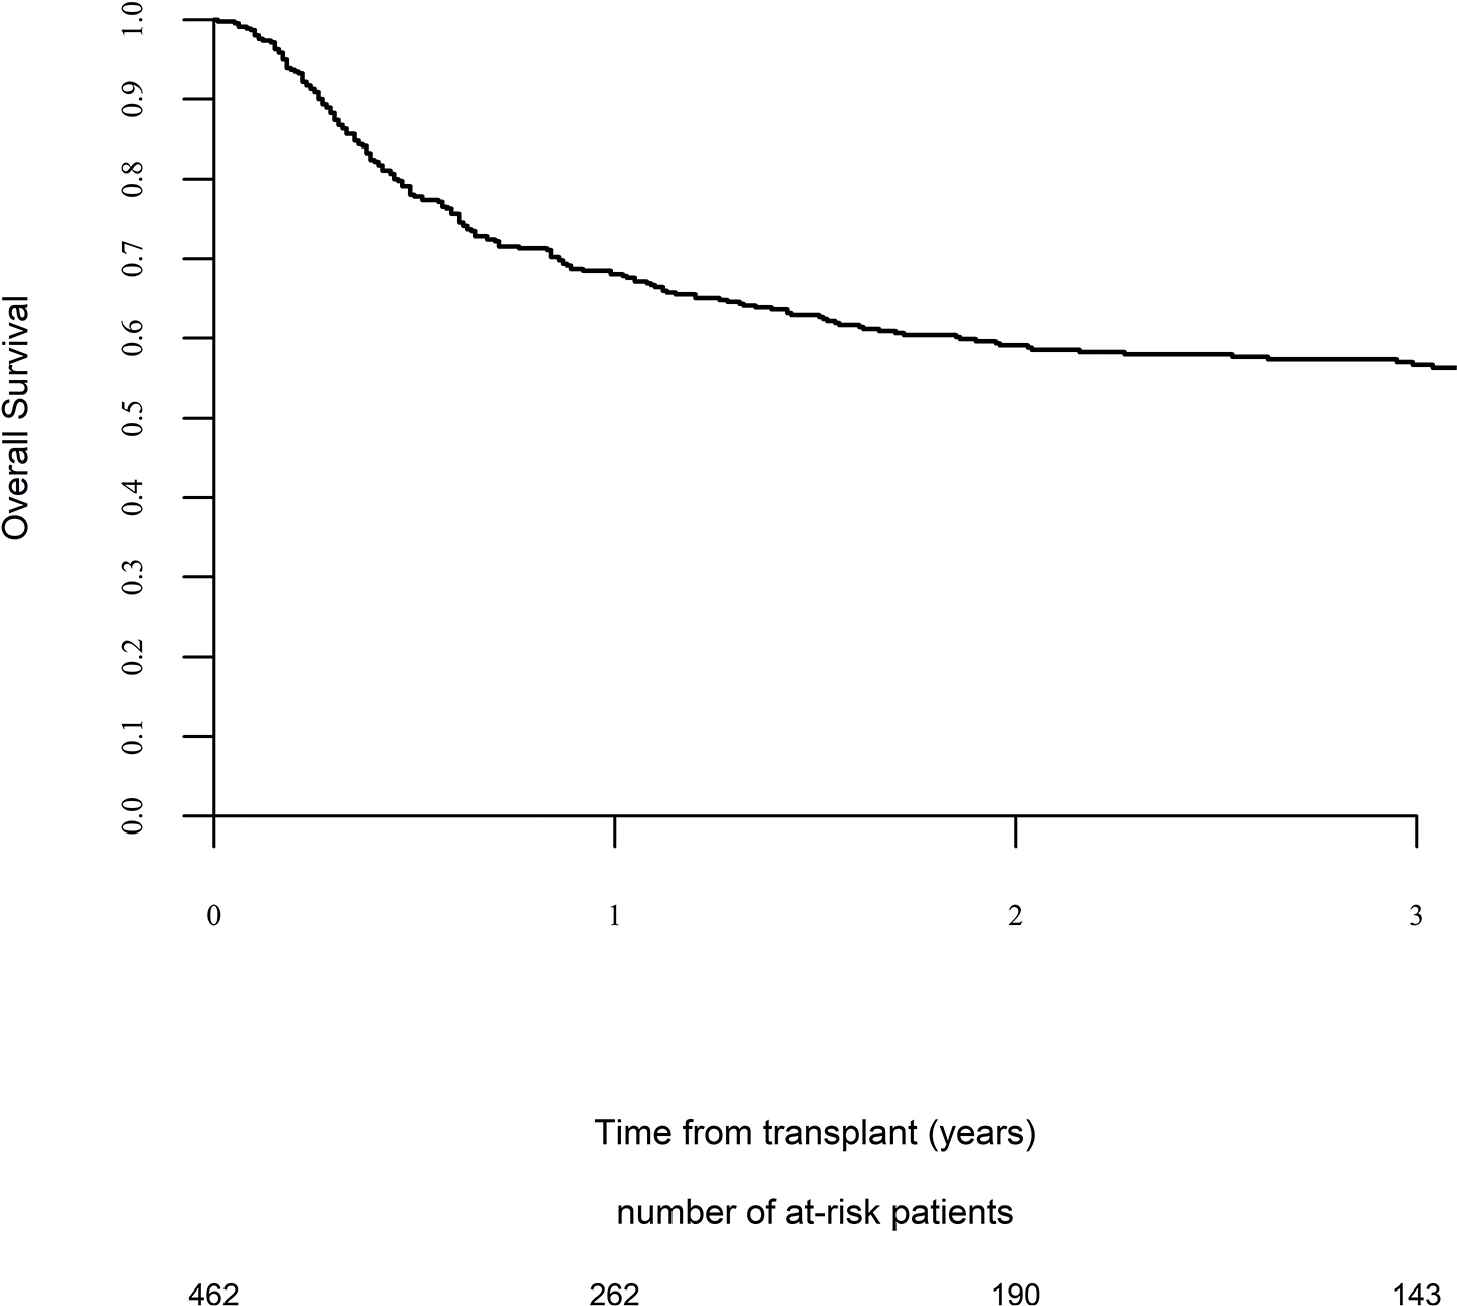
Overall survival.
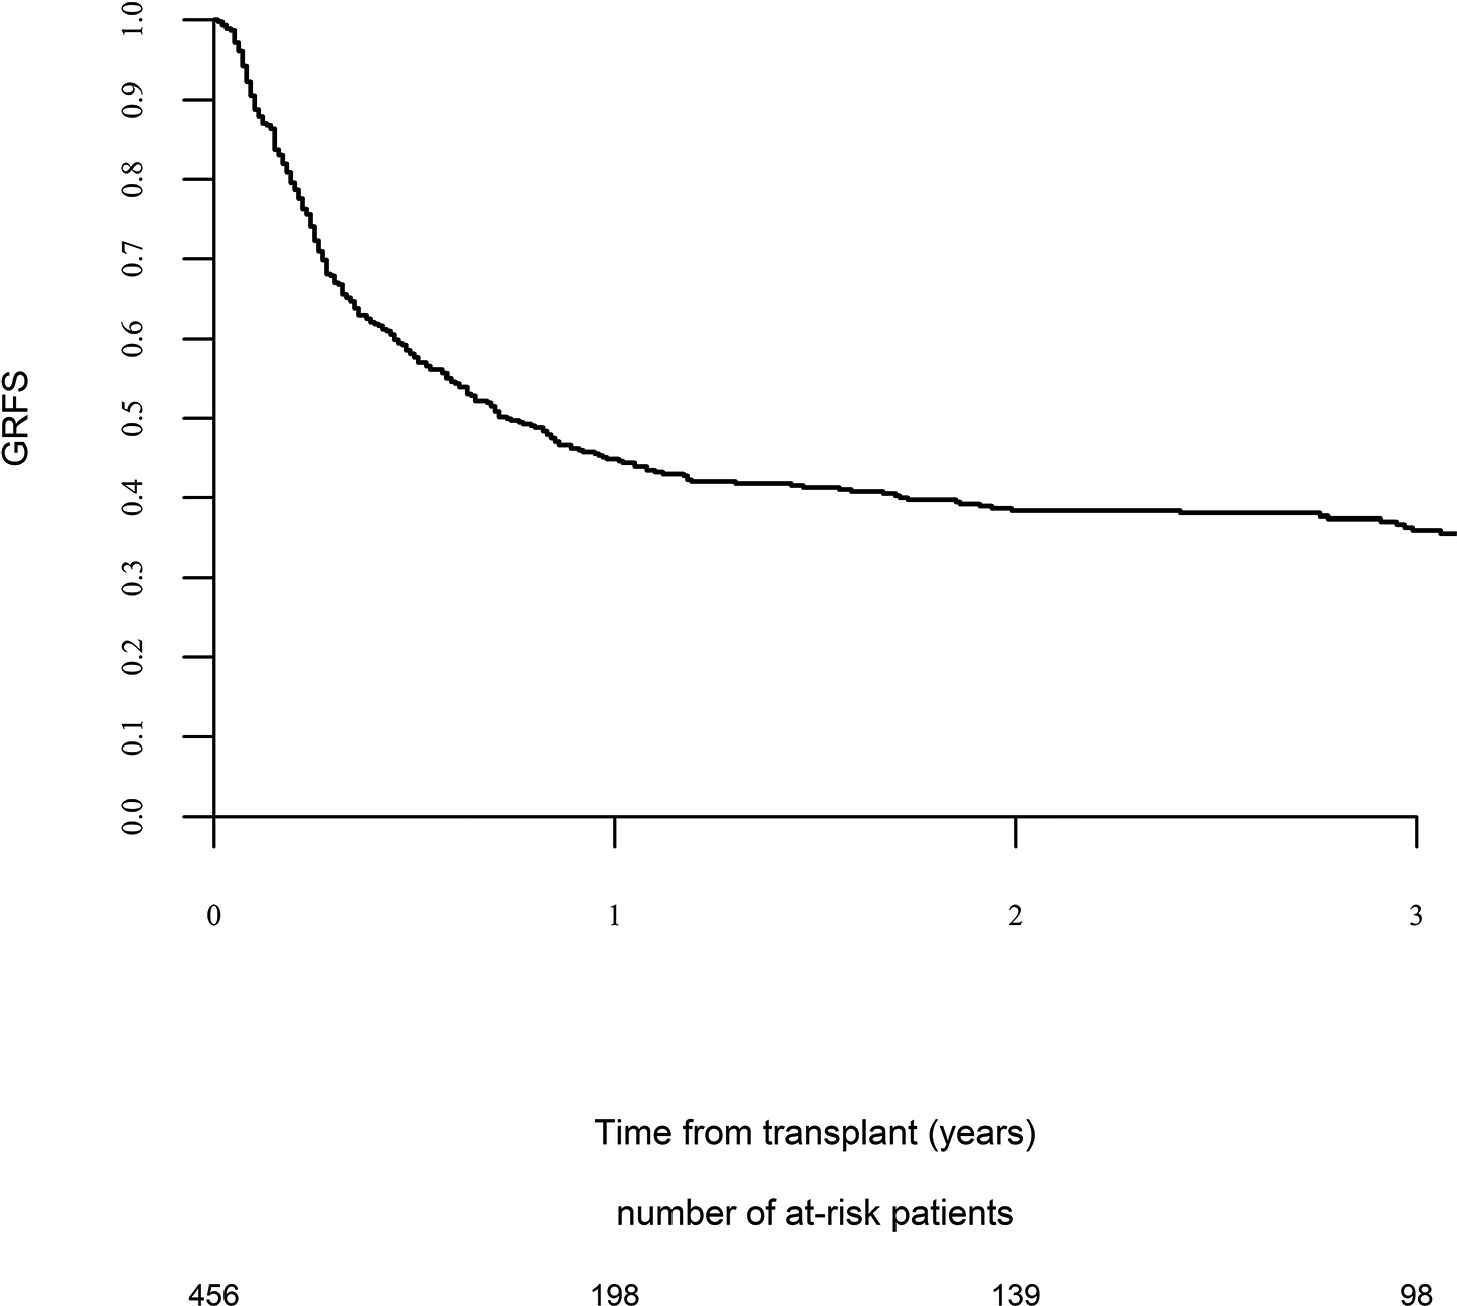
Graft versus host disease (GVHD) relapse-free survival.
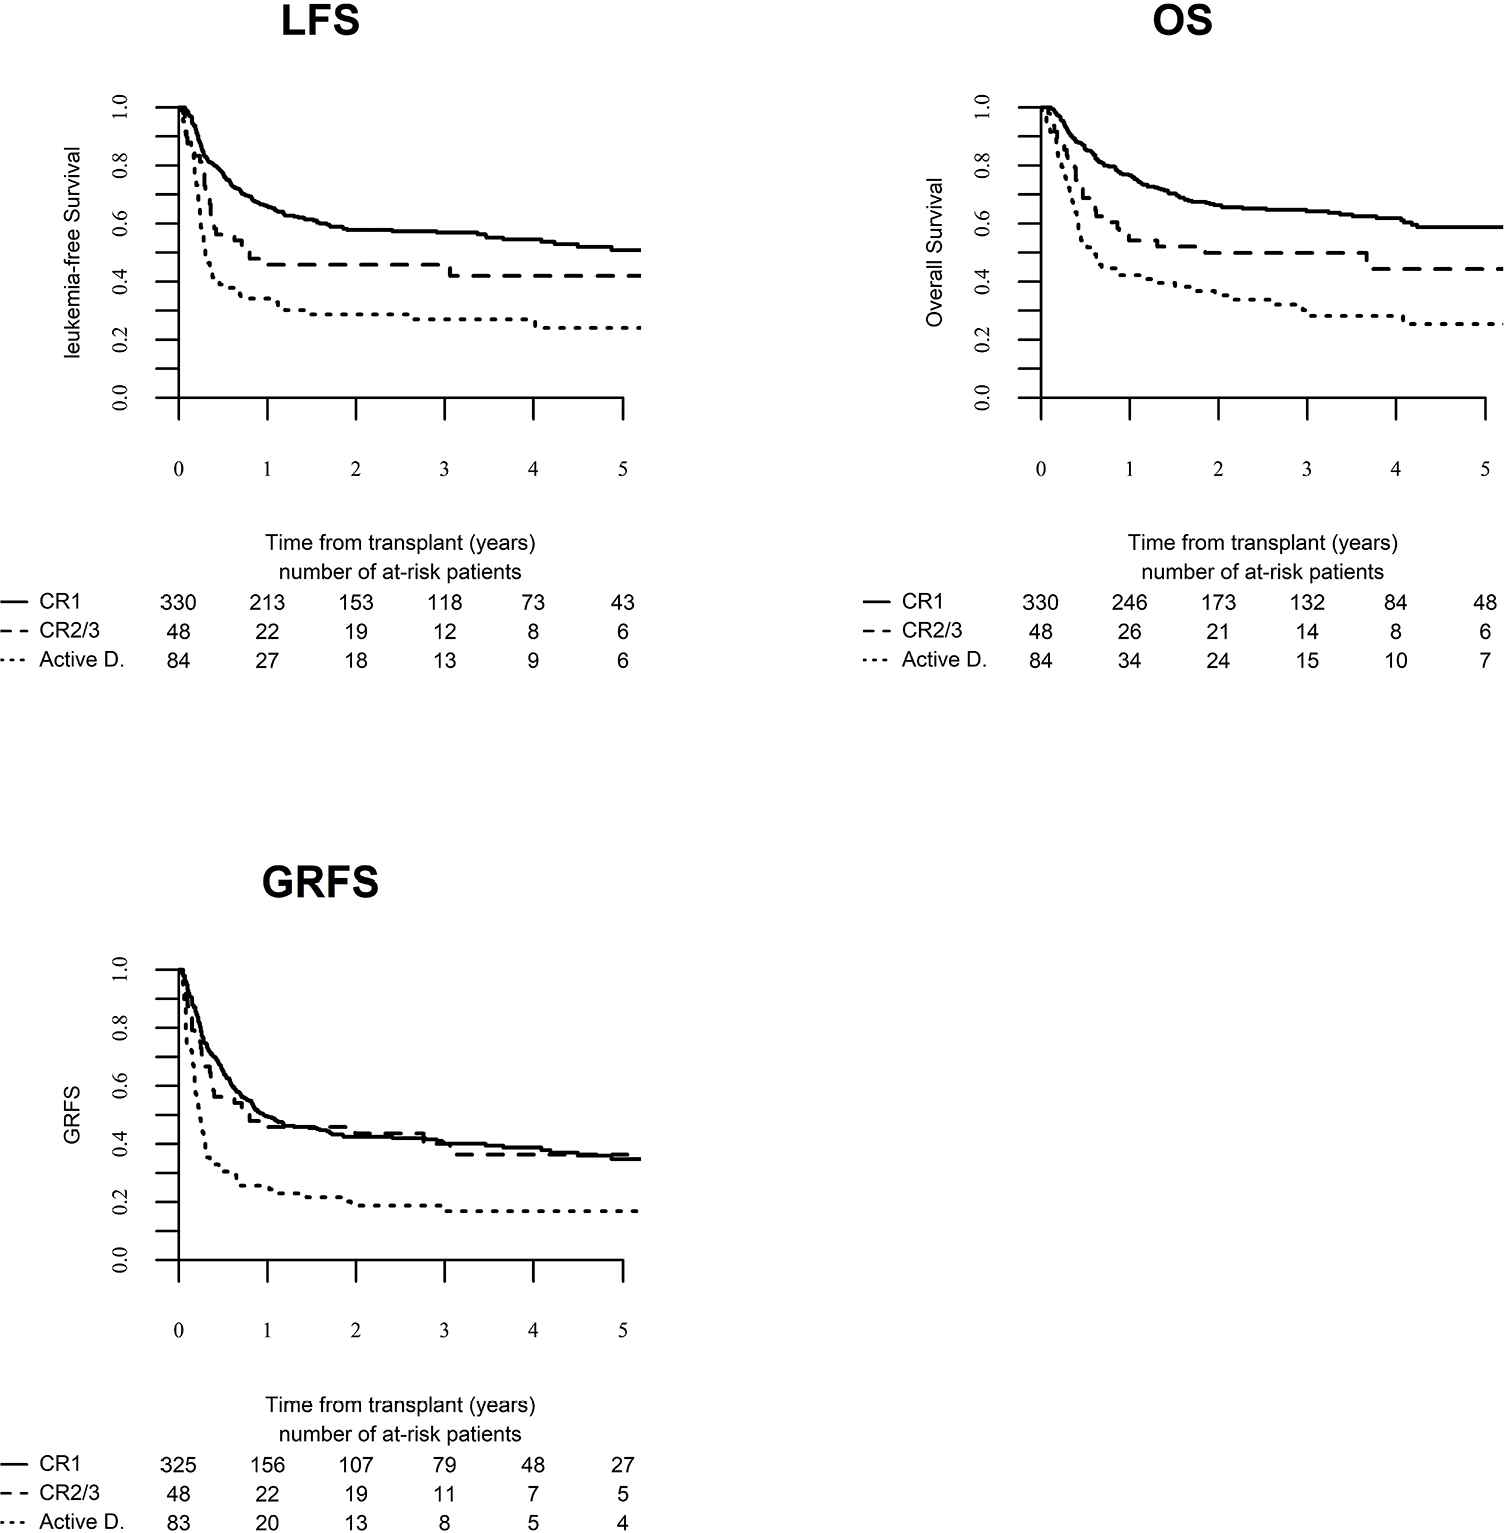
Leukemia-free survival (LFS), overall survival (OS) and graft versus host disease relapse-free survival (GRFS) according to disease status at transplant.
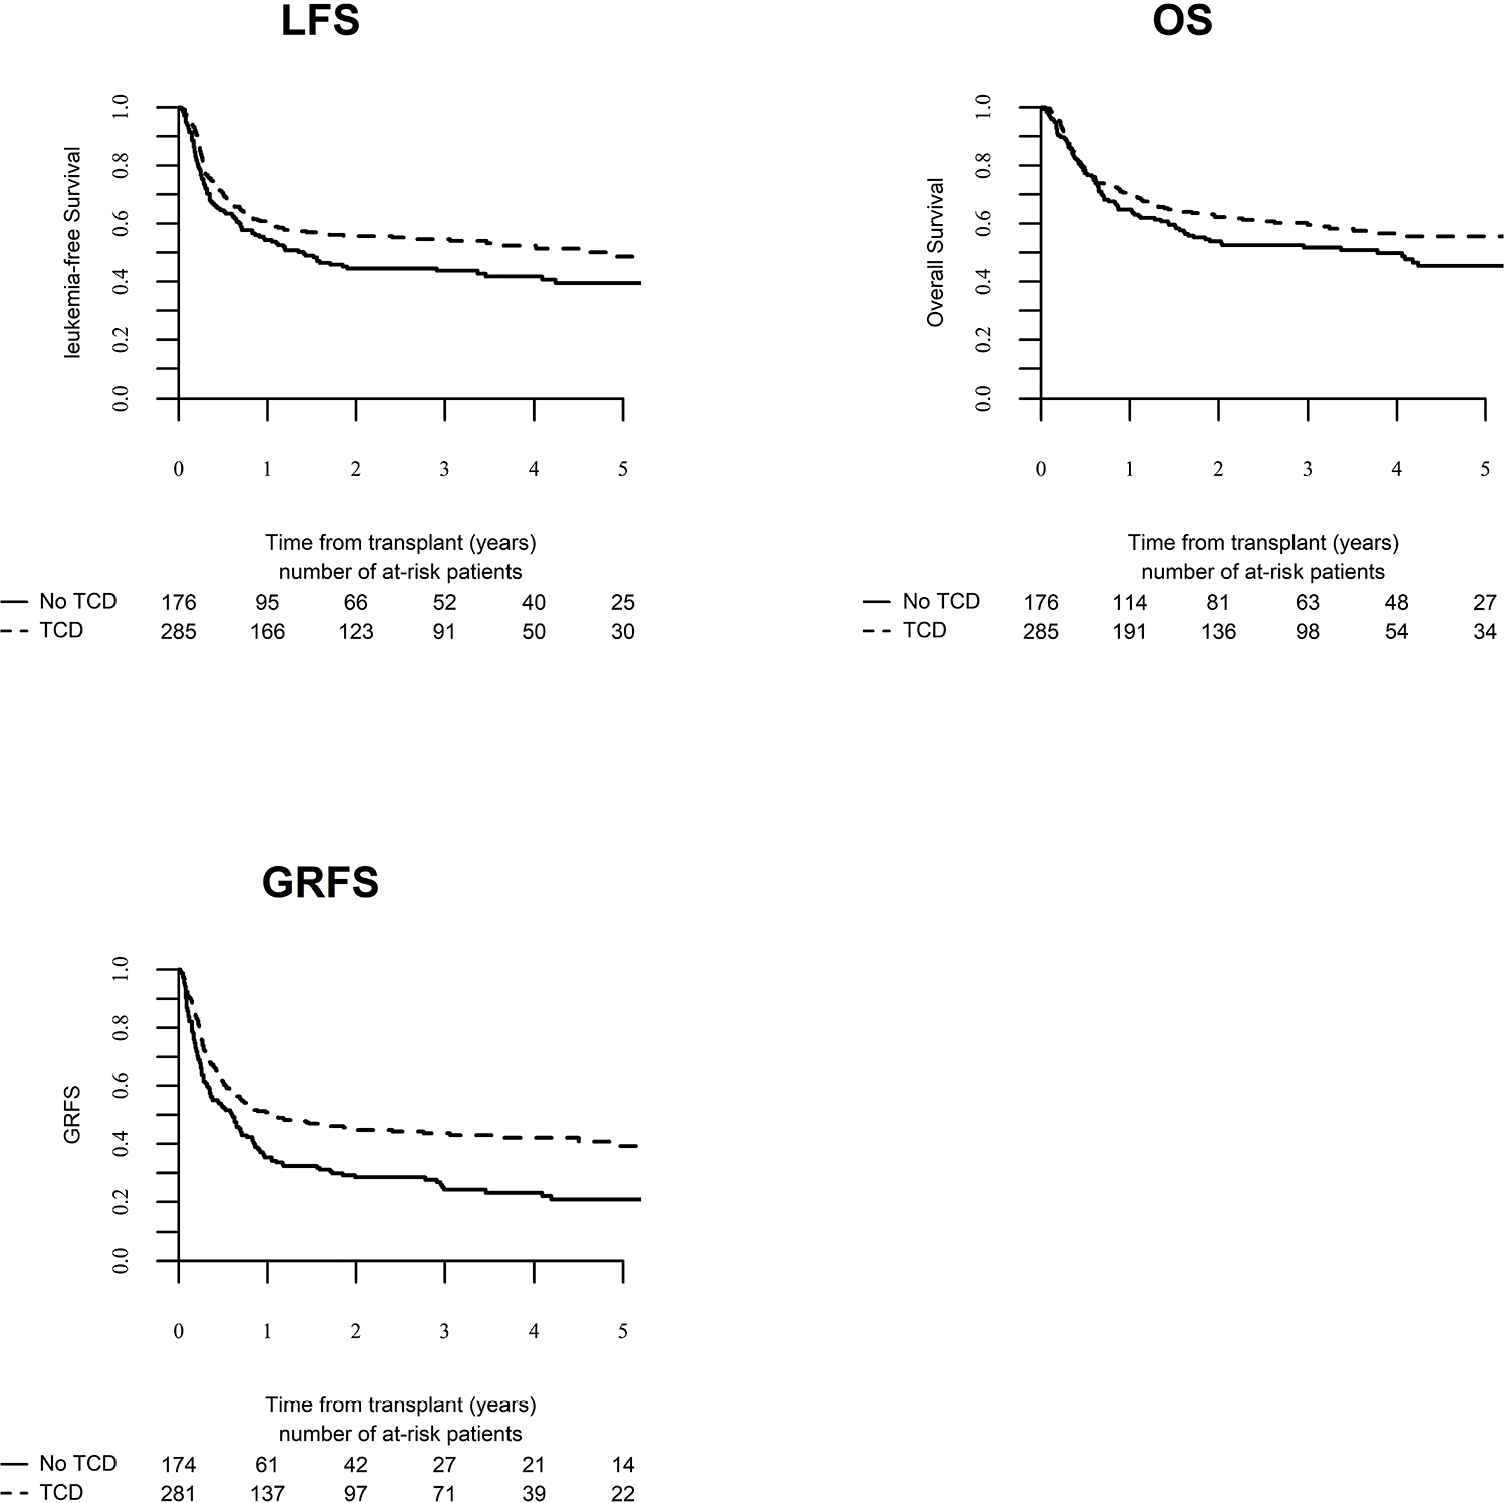
Leukemia-free survival (LFS), overall survival (OS) and graft versus host disease relapse-free survival (GRFS) for patients who received T-cell depletion (TCD) versus patients who did not receive T-cell depletion.
3.4. Multivariate Analysis
In multivariate Cox analysis (Table 3), female patients had a reduced NRM, and the use of MUD was associated with reduced RI. The need for more than one induction negatively affected NRM, RI, LFS, and OS. Similarly, transplantation in CR2 (compared to CR1) negatively affected RI, LFS, and OS, whereas active disease at transplant negatively affected RI, LFS, and GRFS. On the other hand, NPM1 mutation significantly reduced the RI and positively affected LFS, OS, and GRFS. Similarly, in vivo T-cell depletion reduced chronic GVHD (HR 0.53; p = 0.001) and increased LFS (HR = 0.71; p = 0.03), OS (HR = 0.66; p = 0.01) and GRFS (HR = 0.55; p < .001). Finally, posttransplant sorafenib maintenance as a time-dependent variable significantly reduced the RI (HR = 0.39; p = 0.05), and improved LFS (HR = 0.35; p = 0.01), OS (HR = 0.36; p = 0.03) and GFRS (HR = 0.44; p = 0.02). Overall, GRFS was positively affected by NPM1 mutation (HR = 0.66; p = 0.002), the use of a haploidentical donor compared to matched sibling donors (HR = 0.61; p = 0.04), in vivo T-cell depletion (HR = 0.55; p < .001), and sorafenib maintenance (HR = 0.44; p = 0.02), whereas the need for more than one induction (HR = 1.5; p = 0.005) and active disease at transplant (HR = 2.5; p < .001) were unfavourable.
| Outcomes | Variables | HR | 95% CI | p Value |
|---|---|---|---|---|
| NRM | Sorafenib maintenance (time dependent) | 0.2 | 0.03–1.5 | 0.12 |
| Age (per 10 years) | 1.2 | 0.92–1.46 | 0.21 | |
| Number of induction >1 | 2 | 1.13–3.67 | 0.02 | |
| Consolidation therapy (yes/no) | 1 | 0.53–1.99 | 0.93 | |
| CR1 (reference) | 1 | – | ||
| CR2 versus CR1 | 0.9 | 0.34–2.42 | 0.85 | |
| Active disease versus CR1 | 1.7 | 0.82–3.46 | 0.15 | |
| NPM1 positive | 1.1 | 0.63–1.9 | 0.74 | |
| Matched related donor (reference) | 1 | – | ||
| Matched unrelated donor | 1.39 | 0.76–2.54 | 0.29 | |
| Haplo-identical donor | 1.72 | 0.72–4.11 | 0.22 | |
| Female patient | 0.59 | 0.34–1 | 0.05 | |
| Female donor | 1.24 | 0.73–2.09 | 0.43 | |
| Year of transplant | 0.91 | 0.77–1.06 | 0.22 | |
| RIC versus MAC | 0.56 | 0.31–1.01 | 0.053 | |
| In vivo T-cell depletion | 0.69 | 0.4–1.19 | 0.19 | |
| RI | Sorafenib maintenance (time dependent) | 0.39 | 0.16–1 | 0.05 |
| Age (per 10 years) | 1.09 | 0.94–1.26 | 0.26 | |
| Number of induction >1 | 1.58 | 1.07–2.36 | 0.02 | |
| Consolidation therapy (yes versus no) | 0.96 | 0.62–1.47 | 0.84 | |
| CR1 (reference) | 1 | – | ||
| CR2 versus CR1 | 2.29 | 1.34–3.9 | 0.002 | |
| Active disease versus CR1 | 3.19 | 2.1–4.84 | <0.001 | |
| NPM1 positive | 0.56 | 0.39–0.81 | 0.001 | |
| Matched related donor (reference) | 1 | – | ||
| Matched unrelated donor | 0.67 | 0.467–0.97 | 0.03 | |
| Haplo-identical donor | 0.58 | 0.31–1.07 | 0.08 | |
| Female patient | 1 | 0.7–1.41 | 0.98 | |
| Female donor | 0.8 | 0.53–1.08 | 0.12 | |
| Year of transplant | 1 | 0.9–1.1 | 0.97 | |
| RIC versus MAC | 0.82 | 0.56–1.22 | 0.33 | |
| In vivo T-cell depletion | 0.7 | 0.49–1 | 0.05 | |
| LFS | Sorafenib maintenance (time dependent) | 0.35 | 0.15–0.8 | 0.01 |
| Age (per 10 years) | 1.1 | 0.97–1.25 | 0.13 | |
| Number of induction >1 | 1.67 | 1.2–2.3 | 0.002 | |
| Consolidation therapy (yes versus no) | 0.97 | 0.68–1.39 | 0.87 | |
| CR1 (reference) | 1 | – | ||
| CR2 versus CR1 | 1.8 | 1.13–2.87 | 0.01 | |
| Active disease versus CR1 | 2.667 | 1.865–3.815 | <0.001 | |
| NPM1-mutation positive | 0.69 | 0.51–0.93 | 0.01 | |
| Matched related donor (reference) | 1 | – | ||
| Matched unrelated donor | 0.82 | 0.6–1.12 | 0.21 | |
| Haplo-identical donor | 0.78 | 0.48–1.29 | 0.34 | |
| Female patient | 0.85 | 0.64–1.14 | 0.27 | |
| Female donor | 0.87 | 0.65–1.17 | 0.36 | |
| Year of transplant | 0.97 | 0.89–1.06 | 0.52 | |
| RIC versus MAC | 0.75 | 0.54–1.04 | 0.08 | |
| In vivo T-cell depletion | 0.71 | 0.53–0.96 | 0.03 | |
| OS | Sorafenib maintenance (time dependent) | 0.36 | 0.14–0.91 | 0.03 |
| Age (per 10 years) | 1.13 | 0.99–1.28 | 0.07 | |
| Number of induction >1 | 1.58 | 1.11–2.24 | 0.01 | |
| Consolidation therapy (Yes versus No) | 1.24 | 0.84–1.84 | 0.28 | |
| CR1 (reference) | 1 | – | ||
| CR2 versus CR1 | 1.92 | 1.18–3.14 | 0.008 | |
| Active disease versus CR1 | 3.24 | 2.22–4.73 | 1.24 | |
| NPM1-mutation positive | 0.7 | 0.51–0.97 | 0.03 | |
| Matched related donor (reference) | 1 | – | ||
| Matched unrelated donor | 0.91 | 0.65–1.27 | 0.57 | |
| Haplo-identical donor | 0.77 | 0.45–1.3 | 0.32 | |
| Female patient | 0.93 | 0.68–1.26 | 0.63 | |
| Female donor | 0.87 | 0.63–1.18 | 0.37 | |
| Year of transplant | 0.95 | 0.87–1.04 | 0.28 | |
| RIC versus MAC | 1.01 | 0.72–1.42 | 0.96 | |
| In vivo T-cell depletion | 0.66 | 0.48–0.91 | 0.01 | |
| GRFS | Sorafenib maintenance (time dependent) | 0.44 | 0.22–0.9 | 0.02 |
| Age (per 10 years) | 1.02 | 0.91–1.14 | 0.75 | |
| Number of induction >1 | 1.5 | 1.12–2.01 | 0.005 | |
| Consolidation therapy (yes versus no) | 1.12 | 0.81–1.56 | 0.5 | |
| CR1 (reference) | 1 | – | ||
| CR2 versus CR1 | 1.36 | 0.87–2.12 | 0.18 | |
| Active disease versus CR1 | 2.43 | 1.73–3.4 | <0.001 | |
| NPM1-mutation positive | 0.66 | 0.5–0.86 | 0.002 | |
| Matched related donor (reference) | 1 | – | ||
| Matched unrelated donor | 0.88 | 0.67–1.17 | 0.38 | |
| Haplo-identical donor | 0.61 | 0.38–0.98 | 0.04 | |
| Female patient | 0.87 | 0.68–1.13 | 0.3 | |
| Female donor | 1.15 | 0.89–1.49 | 0.28 | |
| Year of transplant | 0.99 | 0.92–1.07 | 0.86 | |
| RIC versus MAC | 0.91 | 0.68–1.22 | 0.52 | |
| In vivo T-cell depletion | 0.55 | 0.41–0.72 | <0.001 | |
| cGVHD | Sorafenib maintenance (time dependent) | 1.84 | 0.96–3.53 | 0.07 |
| Age (per 10 years) | 0.95 | 0.81–1.11 | 0.49 | |
| Number of induction>1 | 1.22 | 0.82–1.82 | 0.32 | |
| Consolidation therapy (yes versus no) | 1.21 | 0.76–1.92 | 0.43 | |
| CR1 (reference) | 1 | – | ||
| CR2 versus CR1 | 0.7 | 0.35–1.41 | 0.32 | |
| Active disease versus CR1 | 0.83 | 0.47–1.47 | 0.52 | |
| NPM1-mutation positive | 0.92 | 0.63–1.32 | 0.64 | |
| Matched related donor (reference) | 1 | – | ||
| Matched unrelated donor | 1.3 | 0.89–1. 9 | 0.18 | |
| Haplo-identical donor | 0.99 | 0.55–1.75 | 0.96 | |
| Female patient | 1.21 | 0.86–1.71 | 0.27 | |
| Female donor | 1.35 | 0.96–1.88 | 0.08 | |
| Year of transplant | 0.97 | 0.88–1.08 | 0.57 | |
| RIC versus MAC | 1.08 | 0.73–1.61 | 0.69 | |
| In vivo T-cell depletion | 0.53 | 0.37–0.78 | 0.001 |
Abbreviations: CR: Complete remission, RIC: Reduced intensity conditioning, MAC: Myeloablative conditioning, NRM: Non relapse mortality, RI: Relapse incidence, LFS: Leukemia-free survival, GRFS: Graft versus host disease and relapse-free survival, OS: Overall survival, cGVHD: Chronic graft versus host disease, bold values are statistically significant p values.
Multivariate analysis.
3.5. Pair-Matched Analysis
We were able to match 26 patients in the sorafenib group and 26 controls. The latter had engrafted and survived post allo-SCT without relapse and without acute GVHD grade II–IV for periods at least identical to or longer than the time from allo-SCT to sorafenib initiation in the drug cohort. The two groups were comparable in terms of patient, disease, and transplant characteristics (Supplementary Table S3), except that patients in the sorafenib group were more recently transplanted and more likely to have required more than one induction course. Two-year LFS and OS were, respectively, 79% and 83% for patients in the sorafenib group versus 54% and 62% for controls (Fig. 5 and Supplementary Table S4). Comparison using the Cox model confirmed that prophylactic or preemptive sorafenib significantly reduced RI (HR = 0.38; p = 0.046) and improved LFS (HR = 0.37; p = 0.02), and OS (HR = 0.32; p = 0.007) without affecting NRM.
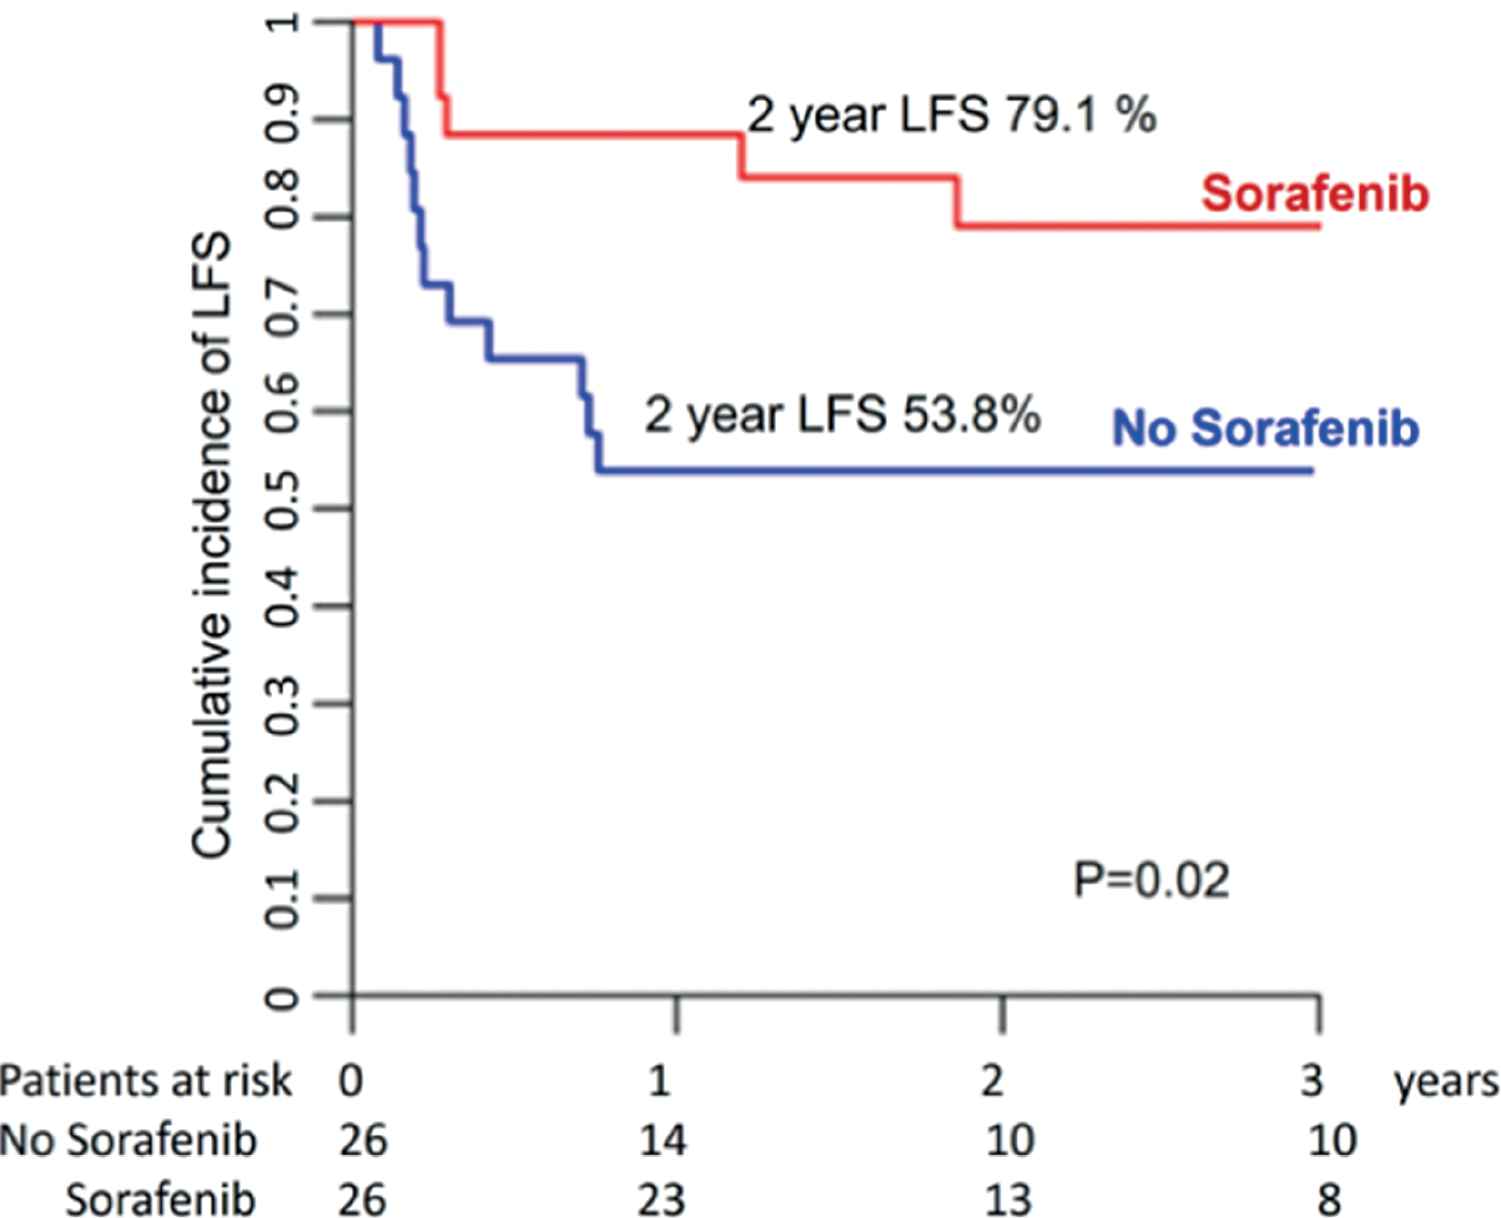
Leukemia-free survival for sorafenib versus no sorafenib maintenance (pair-matched analysis).
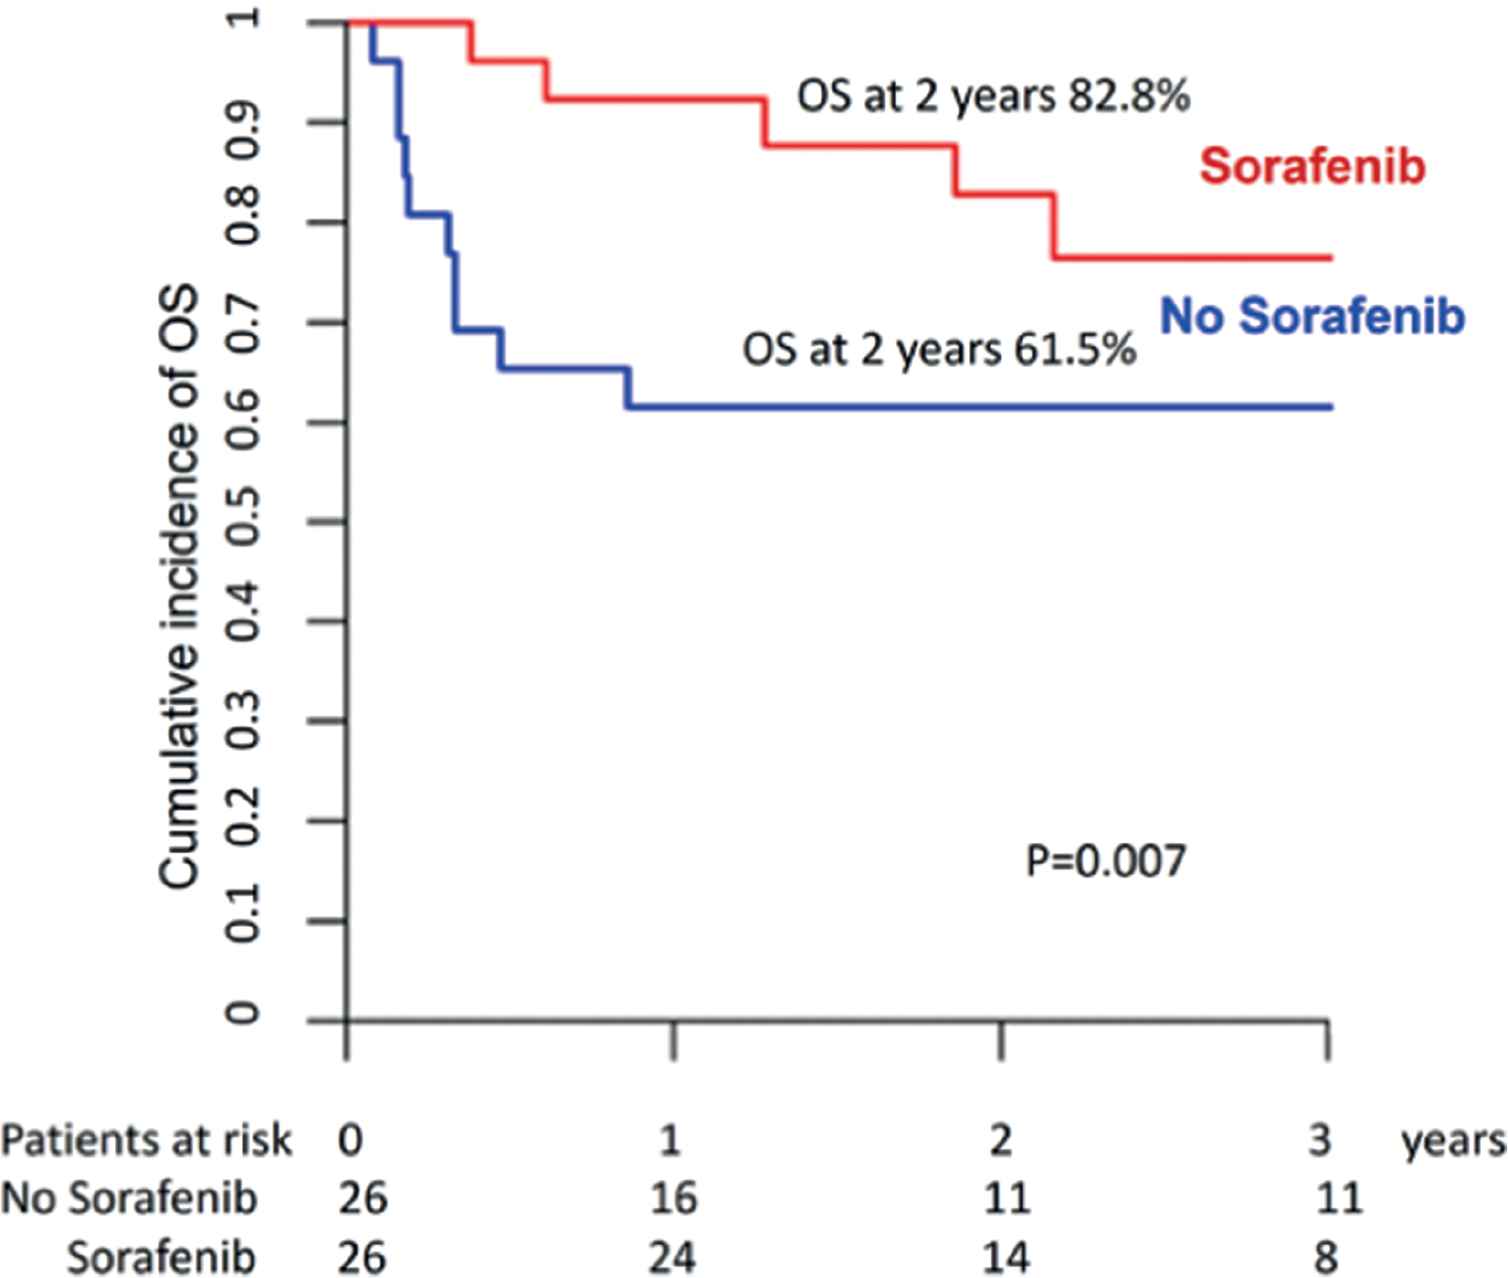
Overall survival for sorafenib versus no sorafenib maintenance (pair-matched analysis).
4. DISCUSSION
In this study, we evaluated the predictive factors for posttransplant outcome in FLT3-mutated AML using a large data set of 462 patients from the EBMT. We found that LFS and OS were significantly better in patients with concomitant NPM1 mutation, in patients transplanted in CR1 and, importantly, in patients receiving in vivo T-cell depletion and/or posttransplant sorafenib maintenance. Similarly, NPM1 mutation, the use of a haplo-identical donor, in vivo T-cell depletion, and posttransplant sorafenib maintenance significantly improved GRFS. These results may set the standard for allo-SCT in FLT3-mutated AML.
Because of the poor prognosis associated with FLT3-mutated AML, allo-SCT is most frequently performed in CR1 [9,40–47], including in patients ≥ 60 years of age [48]. In most studies, the LFS at 2 years was around 50–60% in that setting [9,13,14,49], although a wide variation from 20% [43,50] to 70% [10] was reported. However, little is known about the predictive factors for outcome. A previous EBMT study [14] reported that FLT3-mutated AML patients with concomitant NPM1 mutation had an improved posttransplant outcome compared to those without NPM1 mutation. Similarly, Gaballa et al. [51] recently reported that the presence of active disease or MRD positivity before allo-SCT was associated with a poor posttransplant outcome.
We found that in vivo T-cell depletion decreased chronic GVHD and significantly improved LFS, OS, and GRFS, without increasing the risk of relapse. This indicates that, even in the setting of FLT3-mutated AML, in vivo T-cell depletion does not hamper the graft versus leukemia (GVL) effect. Importantly, we also found that the use of haplo-identical donors was associated with improved GRFS. Given the high risk of rapid relapse of FLT3-mutated AML patients in CR1, and given the poor outcome of transplanting patients in CR2 or beyond, our results indicate that, at least in the absence of a matched sibling donor, performing haplo-identical transplants in CR1 may be superior to other strategies.
Even after allo-SCT, FLT3-mutated AML is associated with a higher risk of early relapse [13]. Furthermore, treatment of patients with FLT3-mutated AML who relapse or progress after allo-SCT, remains an unmet medical need. Chemotherapy or TKI alone or combined with donor lymphocyte infusions are rarely effective in the long term. A second allogeneic SCT can be proposed to only a small percentage of patients and is associated with rather high transplant-related mortality [52]. Therefore, several studies investigated the use of posttransplant sorafenib maintenance as a strategy to reduce the risk of relapse after allo-SCT [15,30–33]. While their results were encouraging, all of these studies but one had no adequate control group. Only one of these nonrandomized studies included 55 control patients concomitant with 26 patients treated with sorafenib maintenance, and reported improved 2-year LFS and OS rates of 82% and 81%, respectively, for patients receiving sorafenib (vs 53% and 62%, respectively, for patients not receiving sorafenib; p < 0.05 and <0.05) [32]. Besides the larger number of patients in our study, one important difference from these previous reports is that we included a large control group and performed a pair-match analysis. Interestingly, posttransplant sorafenib toxicity was rather low in our study, in spite of drugs including TKI being generally less tolerated after allo-SCT [53–55]. More recently, preliminary conclusions of a prospective trial randomizing maintenance treatment with sorafenib versus placebo introduced during the first 60–100 days after allo-HSCT, further supported the use of sorafenib in this high-risk setting [56].
In addition to its direct antileukemia effect, a possible synergism between sorafenib and alloreactive donor T cells in facilitating long-term disease control has been suggested [57], and also has been proposed in murine models in which sorafenib apparently exacerbated GVHD [58]. A recent elegant report demonstrated that sorafenib promotes GVL activity in mice and humans through interleukin-15 production in FLT3-ITD leukemia cells [59].
One important limitation of our retrospective registry study is the risk of selection bias. Ideally, this question of posttransplant sorafenib maintenance should be answered by a prospective randomized trial. A stratification is needed for whether patients were or not exposed to sorafenib or midostaurin prior to allo-SCT. To address these unmet clinical needs, the Blood and Marrow Transplant Clinical Trials Network (BMT-CTN) is launching BMT-CTN 1506, a multicenter, randomized, double-blind, placebo-controlled trial of gilteritinib, a FLT3 inhibitor, as a posttransplant maintenance agent for patients with FLT3-ITD AML in CR1. However, one concern is the expected and potentially unacceptable high risk of relapse in the placebo arm, suggesting that sorafenib may be recommended as the control arm in this type of study. Furthermore, the recent approval of midostaurin in the frontline treatment of FLT3-mutated AML in the USA and Europe may impact the efficacy of posttransplant TKI maintenance including sorafenib, so new data should be generated in that setting. However, most FLT3-mutated AML patients are not currently receiving midostaurin, at least outside the USA; therefore, for the upcoming years, patients may still benefit from sorafenib maintenance after allo-SCT.
Another limitation of our study is that stratification of patients according to their FLT3 mutant-to wild-type allelic ratio at the time of diagnosis was not possible, because it was not systematically performed in most centers. Recent reports have suggested that allele burden might affect prognosis in FLT3-mutated AML patients [60], and that its negative impact might be overcome when patients undergo allo-SCT at the time of CR1 [61]. A recent study from the MD Anderson Cancer Center showed that allo-SCT improved LFS and OS independently from the FLT3/ITD allelic ratio and NPM1 mutation status in multivariate regression models [29].
Finally, although this study included 462 patients, only 28 of them received posttransplant sorafenib. This low number can be explained by the lack of approval of sorafenib in this indication and/or by the lack of sufficient data on posttransplant sorafenib between 2010 and 2015.
5. CONCLUSION
FLT3-mutated AML remains a challenge even following allo-SCT. Transplantation in CR1 is associated with better outcomes. In vivo T-cell depletion and post transplant maintenance with sorafenib appear to significantly improve survival and may be considered as standard of care in that setting.
CONFLICT OF INTEREST
The authors do not have any conflicts of interest. No financial support was provided for this work.
ACKNOWLEDGMENT
A.B. and M.M. designed the study, interpreted the data, and wrote the manuscript. A.N. and J.ES. participated in study design, interpreted the data, and edited the manuscript. M.L. helped with the design and was responsible for statistical analysis. A.D. was the study coordinator. All other authors reported updated patient data and read and commented on the manuscript. All authors proofread the manuscript and agreed on the data presented.
Participating centers (center, city) by decreasing number of patients enrolled in the study: University Hospital, Hematology, Basel; Hopital St. Louis, Dept. of Hematology – BMT, Paris; CHU Bordeaux, Hôpital Haut-leveque, Pessac; Programme de Transplantation & Therapie Cellulaire, Centre de Recherche en Cancérologie de Marseille, Institut Paoli Calmettes, Marseille; CHU Nantes, Dept. D`Hematologie, Nantes; CHRU, Service des Maladies du Sang, Angers; Hopital Saint Antoine, Department of Hematology, Paris; Erasmus MC Cancer Institute, University Medical Center Rotterdam, Department of Hematology, Rotterdam; ¨Tor Vergata¨ University of Rome, Stem Cell Transplant Unit, Policlinico Universitario Tor Vergata, Rome; CHU CAEN, Institut d'hématologie de Basse-Normandie, Caen; Turku University Hospital, TD7 (Stem Cell Transplant Unit), Turku; Cliniques Universitaires St. Luc, Dept. of Haematology, Brussels; Klinikum Grosshadern, Med. Klinik III, Munich; Techniciens d`Etude Clinique suivi de patients greffes, Nouvel Hopital Civil, Strasbourg; University Hospital Gasthuisberg, Dept. of Hematology, Leuven; University Hospital, Dept. of Bone Marrow Transplantation, Essen; Sheffield Teaching Hospitals NHS Trust, South Yorkshire Region (Adult) BMT Programme, Royal Hallamshire Hospital, Sheffield; Hospital Clinic, Institute of Hematology & Oncology, Dept. of Hematology, Barcelona; Gazi University Faculty of Medicine, Hematology, Ankara; S.S.C.V.D Trapianto di Cellule Staminali, A.O.U Citta della Salute e della Scienza di Torino, Torino; Nijmegen Medical Centre, Department of Hematology, Nijmegen; Ospedale Civile, Dipartimento di Ematologia, Medicina Trasfusionale e Biotecnologie, Pescara; Hopital Bretonneau, Service d`Oncologie Médicale, Tours; Istituto Clinico Humanitas, Transplantation Unit, Department of Oncology and Haematology, Milano; Department of Internal Medicine, American University of Beirut Medical Center, Beirut; George Papanicolaou General Hospital, Haematology Department / BMT Unit, Thessaloniki; Charles University Hospital, Dept. of Hematology/Oncology, Pilsen; Florence Nightingale Sisli Hospital, Hematopoietic SCT Unit, Abide - i Hurriyet Cad. 164 Sisli, Istanbul; Tel Aviv Sourasky Medical Center, Blood and Bone Marrow Transplantation, Tel Aviv; Leiden University Hospital, BMT Centre Leiden, Leiden; Western General Hospital, Dept. of Haematology, Edinburgh; Hannover Medical School, Department of Haematology, Hemostasis, Oncology, and Stem Cell Transplantation, Hannover; Universitaetsklinikum Goettingen, Abteilung Hämatologie und Onkologie, Goettingen; Institute of Hematology and Transfusion Medicine, Warsaw; University of Liege, Dept. of Hematology, CHU Sart-Tilman, Liege.
| 2 Years | ||||||
|---|---|---|---|---|---|---|
| Relapse Incidence | Nonrelapse Mortality | Leukemia-Free Survival | Overall Survival | GVHD Relapse-Free Survival | ||
| Patient age | ≤50 | 34% [27.9–40.3] | 16.6% [12–21.8] | 49.4% [42.8–56] | 59.3% [52.8–65.8] | 36.1% [29.8–42.5] |
| >50 | 33.8% [27.7–40] | 12.8% [8.8–17.5] | 53.4% [46.9–59.9] | 58.8% [52.3–65.3] | 40.7% [34.2–47.1] | |
| p value | 0.85475 | 0.44168 | 0.46403 | 0.82136 | 0.22074 | |
| Cytogenetics risk | Good | 28.5% [9.7–50.9] | 27.8% [9.6–49.7] | 43.8% [20.5–67] | 55.6% [32.6–78.5] | 43.8% [20.5–67] |
| Intermediate | 31.8% [27.2–36.6] | 13.6% [10.3–17.3] | 54.6% [49.5–59.7] | 61% [56–66] | 41% [36–46.1] | |
| Adverse | 59.4% [42.7–72.8] | 11.4% [4–22.9] | 29.2% [15.3–43] | 46.9% [31.9–62] | 15.6% [4–27.2] | |
| NA/Failed | 21.2% [6.2–42.2] | 30.9% [12–52.2] | 47.8% [25.4–70.3] | 52.6% [29.9–75.3] | 32.5% [11.3–53.7] | |
| p value | 0.0053115 | 0.070339 | 0.055977 | 0.13834 | 0.0076613 | |
| Number of inductions | 1 induction | 29.3% [24.1–34.7] | 13.9% [10.1–18.3] | 56.8% [51–62.6] | 63.3% [57.6–69.1] | 43.4% [37.5–49.2] |
| >1 induction | 41.6% [34.1–48.9] | 16% [10.9–21.9] | 42.4% [35–49.9] | 51.9% [44.4–59.5] | 30.1% [23.1–37.2] | |
| p value | 0.0015126 | 0.47408 | 0.00027097 | 0.0024849 | 0.0015786 | |
| Consolidation | No consolidation | 43.4% [34–52.5] | 15.7% [9.5–23.3] | 40.8% [31.6–50.1] | 50.9% [41.5–60.3] | 29.4% [20.8–38.1] |
| Consolidation | 30.7% [25.8–35.6] | 14.4% [10.9–18.3] | 55% [49.7–60.3] | 61.9% [56.7–67.1] | 41.3% [36–46.6] | |
| p value | 0.011258 | 0.84958 | 0.010618 | 0.076255 | 0.015352 | |
| Year of transplant | ≤2013 | 36% [30.6–41.4] | 15.2% [11.4–19.5] | 48.8% [43.1–54.4] | 55.7% [50.1–61.3] | 35.4% [29.9–40.8] |
| >2013 | 29.8% [22.6–37.4] | 13.4% [8.5–19.6] | 56.7% [48.6–64.9] | 65.8% [57.9–73.8] | 43.9% [35.5–52.2] | |
| p value | 0.13696 | 0.78003 | 0.092915 | 0.082333 | 0.042129 | |
| Status at transplant | CR1 | 27.3% [22.5–32.3] | 15% [11.3–19.2] | 57.7% [52.2–63.1] | 66.3% [61–71.5] | 42.5% [37–48] |
| CR2 | 39.6% [25.7–53.2] | 14.6% [6.3–26.1] | 45.8% [31.7–59.9] | 49.9% [35.7–64.1] | 43.7% [29.6–57.7] | |
| Active disease | 57.7% [46.1–67.7] | 13.5% [7.1–22] | 28.7% [18.8–38.7] | 35.3% [24.8–45.8] | 18.8% [10.1–27.4] | |
| p value | 4.6143e-08 | 0.99333 | 1.3044e-09 | 6.6158e-11 | 4.4181e-08 | |
| Donor | MSD | 39.5% [32.4–46.6] | 12.1% [7.8–17.3] | 48.4% [41.1–55.7] | 58.6% [51.4–65.7] | 33.7% [26.8–40.6] |
| MUD | 30.4% [24.4–36.6] | 15.5% [11.1–20.7] | 54% [47.4–60.7] | 60.5% [53.9–67] | 40.3% [33.7–47] | |
| Haplo | 28.7% [16.7–41.9] | 20.6% [10.5–33] | 50.7% [36.6–64.8] | 54.7% [40.7–68.8] | 46.8% [32.7–60.8] | |
| p value | 0.052272 | 0.26444 | 0.40612 | 0.7683 | 0.10193 | |
| NPM1 | Negative | 43.1% [35.9–50.1] | 14.8% [10.1–20.4] | 42.1% [34.9–49.2] | 51.1% [43.8–58.5] | 30% [23.4–36.7] |
| Positive | 26.2% [20.6–32.1] | 14.1% [9.9–18.9] | 59.8% [53.3–66.2] | 66.4% [60.2–72.6] | 44.5% [37.9–51.2] | |
| p value | 9.8134e-06 | 0.72842 | 5.2085e-05 | 0.001883 | 0.00017455 | |
| Conditioning | MAC | 32.2% [26.4–38.1] | 16.2% [11.9–21.2] | 51.6% [45.3–57.9] | 62.2% [56–68.3] | 40.2% [34–46.4] |
| RIC | 35.9% [29.4–42.4] | 12.8% [8.7–17.8] | 51.2% [44.4–58] | 55.4% [48.6–62.3] | 36.1% [29.4–42.8] | |
| p value | 0.52714 | 0.47614 | 0.99812 | 0.087851 | 0.73439 | |
| In vivo TCD | No in vivo TCD | 39.8% [32.4–47] | 15.7% [10.7–21.6] | 44.5% [37.1–52] | 53.9% [46.5–61.4] | 28.5% [21.7–35.3] |
| In vivo TCD | 30.4% [25–35.8] | 14% [10.2–18.3] | 55.7% [49.8–61.5] | 62.2% [56.5–68] | 44.7% [38.8–50.7] | |
| p value | 0.07276 | 0.51297 | 0.033666 | 0.10138 | 0.00013018 | |
| Patient sex | Male | 35.2% [29–41.4] | 18.4% [13.6–23.7] | 46.4% [39.9–52.9] | 55.2% [48.7–61.7] | 34.3% [28.1–40.5] |
| Female | 32.6% [26.5–38.8] | 10.8% [7.1–15.3] | 56.6% [50.1–63.1] | 63% [56.6–69.4] | 42.5% [35.9–49.1] | |
| p value | 0.567 | 0.030353 | 0.042068 | 0.073062 | 0.03915 | |
| Donor sex | Male | 36.4% [30.6–42.1] | 13.6% [9.9–18] | 50% [44–56] | 58.9% [53–64.9] | 40.3% [34.3–46.2] |
| Female | 29.5% [23–36.2] | 16.3% [11.3–22.2] | 54.2% [46.9–61.5] | 59.5% [52.3–66.8] | 36.1% [29–43.3] | |
| p value | 0.43588 | 0.55863 | 0.60828 | 0.52025 | 0.30227 | |
| Sex matching | No F->M | 34.8% [30–39.7] | 13.1% [9.9–16.8] | 52.1% [47–57.2] | 60.2% [55.2–65.3] | 38.8% [33.8–43.9] |
| F->M | 30.1% [20.7–40] | 21.2% [13.2–30.5] | 48.7% [38–59.3] | 54.3% [43.7–65] | 36.5% [26.1–46.8] | |
| p value | 0.71426 | 0.07495 | 0.40893 | 0.36284 | 0.54364 | |
| Stem cell source | BM | 35% [24.5–45.7] | 16.9% [9.5–26.2] | 48.1% [36.9–59.3] | 62.3% [51.4–73.1] | 39.7% [28.6–50.7] |
| PB | 33.7% [28.9–38.5] | 14.2% [10.8–17.9] | 52.2% [47.1–57.2] | 58.4% [53.4–63.5] | 38.1% [33.1–43.1] | |
| p value | 0.98124 | 0.70146 | 0.83683 | 0.59887 | 0.64935 | |
| Patient CMV | Negative | 33.2% [26.2–40.4] | 11.9% [7.5–17.3] | 54.9% [47.4–62.4] | 64.9% [57.6–72.1] | 40.1% [32.6–47.6] |
| Positive | 34.6% [29.1–40.2] | 16.1% [12–20.6] | 49.3% [43.4–55.2] | 55.7% [49.8–61.6] | 37.2% [31.5–43] | |
| p value | 0.80837 | 0.30838 | 0.40005 | 0.09876 | 0.70887 | |
| Donor CMV | Negative | 31.2% [25–37.6] | 14.6% [10.2–19.8] | 54.2% [47.3–61.1] | 62.4% [55.7–69.2] | 42.5% [35.6–49.3] |
| Positive | 36% [30–42] | 14.9% [10.7–19.7] | 49.2% [42.9–55.5] | 55.9% [49.6–62.2] | 35.3% [29.2–41.4] | |
| p value | 0.18108 | 0.98523 | 0.17405 | 0.16592 | 0.17023 | |
Abbreviations: CR: Complete remission, MSD: Matched sibling donor, MUD: Matched unrelated sibling, haplo: Haplo-identical donor, MAC: Myeloablative conditioning, RIC: Reduced intensity conditioning, TCD: T-cell depletion, F: Female, M: Male, BM: Bone marrow, PB: Peripheral blood, CMV: Cytomegalovirus, bold values indicate statistically significant p values.
Univariate analysis.
| 100 Days | 2 Years | ||||
|---|---|---|---|---|---|
| Acute GVHD II–IV | Acute GVHD III–IV | Chronic GVHD | Ext. cGVHD | ||
| Age | ≤50.415 | 29.8% [23.9–35.9] | 9.9% [6.4–14.2] | 33.4% [27.2–39.8] | 18.6% [13.7–24] |
| >50.415 | 22.7% [17.5–28.4] | 8% [4.9–12] | 35% [28.7–41.3] | 14% [9.8–19] | |
| p value | 0.059328 | 0.58369 | 0.7318 | 0.15442 | |
| Cytogenetics | Good | 27.8% [9.7–49.6] | 5.6% [0.3–23.1] | 23% [6.5–45.5] | 5.6% [0.3–23.3] |
| Intermediate | 25.8% [21.5–30.4] | 7.9% [5.5–11] | 35.5% [30.6–40.5] | 16.2% [12.6–20.2] | |
| Adverse | 31.8% [18.6–45.8] | 13.6% [5.5–25.5] | 34.9% [20.9–49.3] | 26.4% [13.8–40.8] | |
| NA/Failed | 20% [6–39.9] | 20% [6–39.9] | 16.8% [3.8–37.9] | 5.6% [0.3–23.6] | |
| p value | 0.72127 | 0.23598 | 0.64567 | 0.080007 | |
| Number of inductions | 1 induction | 25.8% [20.8–31] | 8.8% [5.9–12.5] | 35.7% [30.1–41.4] | 16.6% [12.5–21.2] |
| >1 induction | 27.1% [20.5–34] | 9.1% [5.3–14.2] | 31.6% [24.6–38.9] | 15.6% [10.5–21.7] | |
| p value | 0.68868 | 0.712 | 0.38116 | 0.84164 | |
| Consolidation | No consolidation | 26.1% [18.2–34.8] | 5.8% [2.4–11.4] | 34.3% [25.4–43.4] | 17.7% [11.1–25.5] |
| Consolidation | 26.3% [21.7–31] | 9.9% [7–13.4] | 34.3% [29.2–39.4] | 15.9% [12.1–20.1] | |
| p value | 0.73857 | 0.42716 | 0.89732 | 0.32194 | |
| Year of transplant | ≤2013 | 24.6% [19.9–29.7] | 7.8% [5.1–11.3] | 34.3% [28.9–39.7] | 17% [12.9–21.5] |
| >2013 | 29.4% [22.4–36.8] | 11.1% [6.7–16.7] | 33.6% [26–41.3] | 15.3% [9.7–22.1] | |
| p value | 0.19762 | 0.23159 | 0.98043 | 0.40909 | |
| Status at transplant | CR1 | 23.8% [19.3–28.6] | 7.1% [4.6–10.2] | 39.4% [33.9–44.8] | 18.6% [14.5–23.2] |
| CR2 | 25.6% [14.1–38.7] | 8.8% [2.8–19.2] | 18.9% [9.2–31.2] | 4.3% [0.7–13.1] | |
| Active disease | 37.2% [26.5–47.9] | 17% [9.5–26.2] | 23.6% [14.9–33.5] | 14.1% [7.4–23] | |
| p value | 0.043947 | 0.044357 | 0.0060685 | 0.038592 | |
| Donor | MSD | 23.5% [17.6–30] | 11.2% [7.1–16.3] | 32.8% [26–39.7] | 16% [11.1–21.8] |
| UD | 28.4% [22.6–34.4] | 7.3% [4.3–11.2] | 36.3% [29.8–42.9] | 18.4% [13.4–24.1] | |
| Haplo | 27.1% [15.4–40.2] | 8.5% [2.7–18.6] | 30.6% [18.2–43.9] | 8.2% [2.6–18.1] | |
| p value | 0.57674 | 0.17291 | 0.90663 | 0.3364 | |
| NPM1 | NPM1 neg | 34.3% [27.5–41.2] | 10.5% [6.5–15.5] | 29.5% [23.1–36.3] | 15.4% [10.6–21] |
| NPM1 pos | 19.4% [14.6–24.8] | 5.7% [3.2–9.3] | 38.5% [32–44.9] | 17.6% [12.8–23] | |
| p value | 0.00062503 | 0.054096 | 0.11708 | 0.37259 | |
| Conditioning | MAC | 24.2% [18.9–29.7] | 9.6% [6.3–13.8] | 34% [27.9–40.1] | 14% [9.9–18.8] |
| RIC | 28.7% [22.7–34.9] | 8.1% [4.9–12.4] | 34.4% [27.9–40.9] | 19% [13.9–24.8] | |
| p value | 0.39448 | 0.49267 | 0.94876 | 0.32384 | |
| In vivo TCD | No in vivoTCD | 28.9% [22.3–35.9] | 9.4% [5.6–14.4] | 40.9% [33.4–48.2] | 23.1% [17–29.7] |
| In vivo TCD | 24.4% [19.5–29.6] | 8.3% [5.4–11.9] | 30.1% [24.7–35.7] | 12% [8.4–16.3] | |
| p value | 0.38394 | 0.68959 | 0.040176 | 0.0001831 | |
| Patient sex | Male | 31.3% [25.3–37.4] | 11.6% [7.8–16.1] | 30.3% [24.4–36.4] | 16.2% [11.7–21.3] |
| Female | 21.2% [16–26.8] | 6.3% [3.6–10] | 38.3% [31.8–44.8] | 16.4% [11.8–21.8] | |
| p value | 0.026813 | 0.095282 | 0.083827 | 0.83214 | |
| Donor sex | Male | 23.2% [18.4–28.4] | 7.8% [5–11.4] | 30.7% [25.1–36.4] | 12.4% [8.7–16.7] |
| Female | 30.1% [23.5–37] | 10.9% [6.8–16] | 39.6% [32.4–46.6] | 22% [16.2–28.4] | |
| p value | 0.15564 | 0.31953 | 0.054087 | 0.0039009 | |
| Sex matching | No F->M | 24.3% [20–28.8] | 8.2% [5.7–11.3] | 35.2% [30.3–40.2] | 16% [12.4–20] |
| F->M | 35% [24.9–45.4] | 12.1% [6.2–20.3] | 30.1% [20.7–40] | 17.5% [10.3–26.4] | |
| p value | 0.086996 | 0.41361 | 0.37751 | 0.61605 | |
| Source of SC | BM | 27.9% [18.2–38.4] | 9.4% [4.1–17.3] | 27.1% [17.7–37.4] | 9.1% [4–16.8] |
| PB | 25.9% [21.6–30.5] | 8.9% [6.2–12] | 35.7% [30.8–40.7] | 17.8% [14–22] | |
| p value | 0.85755 | 0.90911 | 0.39107 | 0.063564 | |
| Patient CMV | Negative | 25.7% [19.4–32.6] | 8.4% [4.8–13.3] | 33.3% [26.1–40.6] | 17.4% [12–23.7] |
| Positive | 26.4% [21.4–31.7] | 8.9% [6–12.7] | 34.8% [29.2–40.5] | 15.7% [11.6–20.2] | |
| p value | 0.86818 | 0.92168 | 0.49734 | 0.70109 | |
| Donor CMV | Negative | 24% [18.4–30.1] | 6.4% [3.6–10.3] | 35.2% [28.6–41.9] | 15.6% [10.9–21] |
| Positive | 27.6% [22.1–33.3] | 11.2% [7.6–15.5] | 33.3% [27.4–39.3] | 16.7% [12.2–21.8] | |
| p value | 0.64117 | 0.14884 | 0.97509 | 0.92974 | |
Abbreviations: CR: Complete remission, MSD: Matched sibling donor, MUD: Matched unrelated sibling, haplo: Haplo-identical donor, MAC: Myeloablative conditioning, RIC: Reduced intensity conditioning, TCD: T-cell depletion, F: Female, M: Male, BM: Bone marrow, PB: Peripheral blood, CMV: Cytomegalovirus, GVHD: Graft versus host disease.
Univariate analysis.
| No Sorafinib N (%) | Sorafinib N (%) | p Value | |
|---|---|---|---|
| Number of patients | 26 (100) | 26 (100) | |
| Gender | |||
| Male | 10 (38.5) | 14 (53.9) | 0.42 |
| Female | 16 (61.5) | 12 (46.2) | |
| Follow-up months for alive patients median (range) | 56.5 (12.8–86.7) | 30.3 (12.5–60.7) | |
| Age at transplant median (range) | 50.4 (22.2–69.8) | 49.2 (23.6–68.8) | |
| Year of transplant median (range) | 2012 (2010–2015) | 2014 (2011–2015) | 0.004 |
| FLT3 status | |||
| FLT3-ITD | 26 (100) | 25 (96.2) | 0.32 |
| FLT3-TKD | 0 (0) | 1 (3.9) | |
| NPM1 status | |||
| Negative | 10 (38.5) | 10 (38.5) | |
| Positive | 16 (61.5) | 16 (61.5) | |
| Cytogenetics risk | |||
| Good | 23 (88.5) | 24 (92.3) | 0.48 |
| Intermediate | 2 (7.7) | 2 (7.7) | |
| Adverse | 1 (3.9) | 0 (0) | |
| Induction | |||
| Number of inductions median (range) | 1 (1–2) | 2 (1–3) | 0.008 |
| 1 induction | 22 (84.6) | 12 (46.2) | 0.01 |
| >1 induction | 4 (15.4) | 14 (53.9) | |
| No Sorafenib at induction | 25 (96.2) | 24 (92.3) | 1 |
| Sorafinib at induction | 1 (3.86) | 2 (7.7) | |
| No CR after first induction | 4 (16) | 10 (41.7) | 0.11 |
| CR after first induction | 21 (84) | 14 (58.3) | |
| Missing status post induction | 1 | 2 | |
| Consolidation | |||
| No consolidation | 4 (15.4) | 10 (38.5) | 0.11 |
| Consolidation | 22 (84.6) | 16 (61.5) | |
| Sorafinib for consolidation | 1 (3.8) | 5 (19) | |
| Salvage | |||
| No salvage | 3 (33.3) | 10 (71.4) | 0.50 |
| Salvage | 6 (66.7) | 4 (28.6) | |
| Not applicable | 17 | 12 | |
| Status at transplant | |||
| CR1 | 18 (69.2) | 18 (69.2) | |
| CR2 | 4 (15.4) | 4 (15.4) | |
| Active disease | 4 (15.4) | 4 (15.4) | |
| Donor | |||
| Matched sibling donor | 12 (46.2) | 15 (57.7) | 0.58 (MSD versus other) |
| Matched unrelated donor | 13 (50) | 7 (26.9) | |
| Haplo-identical donor | 1 (3.86) | 4 (15.4) | |
| Conditioning | |||
| Myeloablative conditioning | 20 (76.9) | 20 (76.9) | |
| Reduced intensity conditioning | 6 (23.1) | 6 (23.1) | |
| No in vivo T-cell depletion | 12 (46.2) | 6 (23.1) | 0.15 |
| In vivo T-cell cell depletion | 14 (53.9) | 20 (76.9) | |
| Donor gender | |||
| Male | 21 (80.8) | 16 (61.5) | 0.27 |
| Female | 5 (19.2) | 10 (38.5) | |
| No female donor in male recipient | 24 (92.3) | 22 (84.6) | 0.69 |
| Female donor in male recipient | 2 (7.7) | 4 (15.4) | |
| Patient CMV status | |||
| Negative | 12 (46.16) | 5 (19.2) | 0.09 |
| Positive | 14 (53.9) | 21 (80.8) | |
| Donor CMV status | |||
| Negative | 12 (46.2) | 10 (38.5) | |
| Positive | 14 (53.9) | 16 (61.5) | 0.79 |
| Stem cell source | |||
| Bone marrow | 4 (15.4) | 2 (7.7) | 0.69 |
| Peripheral blood | 22 (84.63) | 24 (92.3) | |
| Minimal residual disease | |||
| MRD negative | 13 (86.7) | 15 (57.7) | 0.45 |
| MRD positive | 2 (13.3) | 11 (42.3) | |
| Missing | 11 | 0 |
Abbreviations: FLT3: FMS-like tyrosine kinase 3, ITD: Internal tandem duplication, TKD: tyrosine kinase domain, NPM1: nucleophosmin-1, CR: Complete remission, F: Female, M: Male, MRD: Minimal residual disease, CMV: Cytomegalovirus.
Pair match analysis (patients and transplant characteristics).
| Two-Year Outcomes | Relapse Incidence | Nonrelapse Mortality | Leukemia-Free Survival | Overall Survival |
|---|---|---|---|---|
| No sorafinib maintenance | 34.6% [17–53] | 11.5% [2.8–27.1] | 53.8% [34.7–73] | 61.5% [42.8–80.2] |
| Sorafinib maintenance | 16% [4.8–33] | 4.9% [0.3–21] | 79.1% [62.6–95.6] | 82.8% [67.3–98.3] |
| HR (95% CI) | 0.38 (0.15–0.98) | 0.33 (0.09–1.27) | 0.37 (0.15–0.88) | 0.32 (0.14–0.73) |
| P* (Cox, cluster = match pair) | 0.046 | 0.107 | 0.02 | 0.007 |
Abbreviations: HR, Hazard ratio, CI, confidence interval.
Adjusted on number of induction (1 versus >1), donor (matched related donor versus other), in vivo T-cell depletion.
Pair match analysis (outcomes).
REFERENCES
Cite this article
TY  - JOUR
AU  - Ali Bazarbachi
AU  - Myriam Labopin
AU  - Giorgia Battipaglia
AU  - Azedine Djabali
AU  - Edouard Forcade
AU  - William Arcese
AU  - Gerard Socié
AU  - Didier Blaise
AU  - Joerg Halter
AU  - Sabine Gerull
AU  - Jan J. Cornelissen
AU  - Patrice Chevallier
AU  - Johan Maertens
AU  - Nicolaas Schaap
AU  - Jean El-Cheikh
AU  - Jordi Esteve
AU  - Arnon Nagler
AU  - Mohamad Mohty
PY  - 2019
DA  - 2019/03/18
TI  - Allogeneic Stem Cell Transplantation for FLT3-Mutated Acute Myeloid Leukemia: In vivo T-Cell Depletion and Posttransplant Sorafenib Maintenance Improve Survival. A Retrospective Acute Leukemia Working Party-European Society for Blood and Marrow Transplant Study
JO  - Clinical Hematology International
SP  - 58
EP  - 74
VL  - 1
IS  - 1
SN  - 2590-0048
UR  - https://doi.org/10.2991/chi.d.190310.001
DO  - 10.2991/chi.d.190310.001
ID  - Bazarbachi2019
ER  -