
High Systolic Blood Pressure is Associated with Increased Cardio-ankle Vascular Index in the Elderly
- DOI
- 10.2991/artres.k.201102.002How to use a DOI?
- Keywords
- Cardio-ankle vascular index; arterial stiffness; lipid profile; blood pressure
- Abstract
Background: Increased arterial stiffness caused by elevated Blood Pressure (BP) can be indicated by the Cardio-ankle Vascular Index (CAVI). However, the relationship between arterial stiffness and BP is complex. In addition, changes in BP may contribute to increased risk of cardiovascular disease associated with abnormal lipid profiles. So far, results from published studies have been inconclusive.
Objectives: To evaluate lipid profiles and BP, and their association with CAVI values in elderly participants.
Methods: The study included 95 elderly Thai individuals. Anthropometric data, lipid profiles, and BP and CAVI values were established. Participants were then divided into low-CAVI (CAVI < 9, n = 50) and high-CAVI groups (CAVI ≥ 9, n = 45). Stepwise linear and logistic regression models were used.
Results: The high-CAVI group had significantly higher BP and hypertension levels, than the low-CAVI group. The mean age of the high-CAVI group was also higher (≥65 years). CAVI value was positively correlated with Systolic Blood Pressure (SBP) and Pulse Pressure (PP) in the high-CAVI group. Stepwise multiple regression analysis showed SBP (β = 0.43, p < 0.01) and hip circumference (β = −0.23, p = 0.01) were associated with CAVI values. Logistic regression of the high-CAVI indices showed that the Odds Ratios (ORs) for the factors of age ≥65 years, obesity, hypertension and dyslipidemia were 7.35 (95% CI 2.42–22.36, p < 0.01), 0.20 (95% CI 0.64–0.67, p < 0.01) 4.72 (95% CI 1.67–13.32, p < 0.01), and 4.84 (95% CI 1.42–16.46, p = 0.01), respectively.
Conclusion: A higher SBP level was correlated with a high-CAVI value in elderly people.
- Copyright
- © 2020 Association for Research into Arterial Structure and Physiology. Publishing services by Atlantis Press International B.V.
- Open Access
- This is an open access article distributed under the CC BY-NC 4.0 license (http://creativecommons.org/licenses/by-nc/4.0/).
1. INTRODUCTION
Arterial stiffness is characterized by impaired distensibility of large arteries during aging and can lead to cardiovascular morbidity and mortality. Arterial stiffness can be measured by a parameter known as the Cardio-ankle Vascular Index (CAVI). A high CAVI value is associated with the progression of carotid and coronary arteriosclerosis [1]. Several clinical studies have demonstrated the elevation of CAVI in subjects who presented cardiovascular risk factors such as aging, hypertension, obesity, diabetes mellitus, and dyslipidemia [2–4]. Although the CAVI is calculated without reference to Blood Pressure (BP) [5], chronic elevation of BP can lead to arterial stiffness and can be indicated by the CAVI [6]. However, the relationship between arterial stiffness and BP is complex.
Increased Total Cholesterol (TC), Triglyceride (TG), and Low-density Lipoprotein Cholesterol (LDL-C) are known cardiovascular risk factors. Increased serum LDL-C also led to endothelial dysfunction that contributed to the development of atherosclerosis [7]. In contrast, an elevated concentration of High-density Lipoprotein Cholesterol (HDL-C) was considered an anti-apoptotic condition for vascular endothelial cells [8]. This conclusion was supported by a study of a healthy Japanese population in which an inverse relationship was found between CAVI and serum HDL-C [9]. However, the association between each lipid profile parameter and arterial stiffness was still not elucidated by these various studies and, rather unhelpfully, an individual’s CAVI may also be increased by a complicated lesion of the arterial wall.
Routine opportunistic screening for hypertension and dyslipidemia during health-care visits is commonly offered to older adults in Thailand. But there is a lack of screening for arterial stiffness. A study of the correlation of CAVI with BP and lipid profiles may be a way of raising awareness of vascular wall abnormalities that can define atherosclerosis. Hence, the present study was designed to evaluate the relationships between CAVI scores and serum lipid levels and BP parameters in elderly subjects with high and low cardio-ankle vascular indices.
2. MATERIALS AND METHODS
2.1. Participants
From March to July 2018, 95 Thai adults aged 60 years and older were recruited from a cross-sectional population-based study conducted in Hatyai Chivasuk’s Health Promotion Center. We included participants who were not taking antihypertensive drugs but excluded those with a history of Cardiovascular Disease (CVD), stroke, serious end-stage diseases (cancer or serious liver, or renal insufficiency), uncontrolled thyroid disease, a Body Mass Index (BMI) >40 kg/m2, and those who did not verbally agree to participate. Before participating in any study procedures, all participants signed an informed consent according to the general recommendations of the Declaration of Helsinki. The study was approved by the Research Ethics Committees of the Faculty of Medicine, Prince of Songkla University (REC 60-166-19-2). Anthropometric parameters, lipid profiles, and CAVI scores were established within 2 weeks of the approval of signed informed consent.
2.2. Anthropometric Measurement
Anthropometric data were collected in the morning by trained examiners. During body mass and height measurements, participants wore a light dress without shoes. BMI was calculated as weight in kilograms (kg) divided by height in meters squared (m2). Obesity was defined as a BMI of ≥25 kg/m2, based on criteria for Asians [10]. Waist Circumference (WC) was measured at the narrowest point between the lowest rib and the iliac crest. WC ≥ 90 cm for males or WC ≥ 80 cm for females defined abdominal obesity based on World Health Organization (WHO) recommendations for Asians [11]. Hip Circumference (HC) was measured with a plastic measuring tape at the level of maximum extension of the buttocks in the standing position. Waist-to-Hip Ratio (WHR) was derived from the ratio of WC/HC. Body fat percentage was calculated from body density determined by Bioelectrical Impedance Analysis (BIA) (UM-076 Tanita, Japan).
2.3. Biochemical Analysis
After 12 h of overnight fasting, participants presented themselves at the Hatyai Chivasuk Health Promotion Center, where blood samples were taken between 07:00 a.m. and 08:00 a.m. Samples were drawn from the antecubital vein: 4 ml of blood were collected in a clot activator tube and centrifuged within 1 h of collection. Serum lipid parameters of TC, TG, LDL-C, and HDL-C were analyzed using colorimetric enzymatic assays with the use of an autoanalyzer (HITACHI-7170, Hitachi, Tokyo, Japan). Dyslipidemia was defined as an LDL-C level ≥140 mg/dL, an HDL-C level ≤40 mg/dL, a TG level ≥150 mg/dL, or the use of anti-dyslipidemia medication [12].
2.4. Measurements of CAVI
The CAVI was measured using a VaSera VS-1500® device (Fukuda-Denshi Co. Ltd., Tokyo, Japan). All participants were measured in the supine position in a quiet room. Blood pressure cuffs were wrapped approximately 2 cm above the antecubital fossa on both upper arms and both ankles. ECG electrodes were attached to both wrists. A microphone for phonocardiography was placed at the second intercostal space at the left edge of the sternum. CAVI values were automatically calculated based on the equation
2.5. Group Definitions
When CAVI measurements had been completed, participants were divided into two groups based on a cut-off CAVI score of 9.0. One group comprised those who scored below 9.0 (low-CAVI, n = 50) and the other group those who scored 9.0 or above (high-CAVI n = 45). Clinical study emphasized that a CAVI score of 9.0 was abnormal and indicated subclinical atherosclerosis in a clinical setting [5].
2.6. Statistical Analysis
Statistical analysis was performed using the SPSS software package. Continuous variables were expressed as means ± Standard Deviation (SD) for normally distributed variables or median and range (min, max) for nonnormally distributed variables. Normally distributed variables were compared by using the independent sample t-test, and nonnormally distributed variables were compared by using the Mann–Whitney U-test. Categorical variables were expressed as percentages and were compared using Chi-square tests. The correlations between various characteristics and BP were assessed by Pearson correlation coefficients (r). Stepwise multiple regression analysis was used to assess the association between independent variables (baseline characteristics, anthropometric data, lipid profiles, and BP components) and CAVI value. Logistic regression analysis was used to assess the contribution to high-CAVI by associated clinical parameters such as gender, age, obesity, abdominal obesity, HT, and dyslipidemia. Odds Ratios (OR) and 95% Confidence Intervals (95% CIs) were calculated. A p-value <0.05 was considered statistically significant.
3. RESULTS
From the 95 participants, two groups were formed: a low-CAVI group (n = 50; mean age, 64.28 ± 4.21 years) and a high-CAVI group (n = 45; mean age, 67.96 ± 4.40 years). The median BMI was significantly higher in the low-CAVI group than in the high-CAVI group (p = 0.01). There were no significant differences between the groups in HR (p = 0.50), height (p = 0.88), body mass (p = 0.18), body fat (p = 0.61), WC (p = 0.56), HC (p = 0.17), WHR (p = 0.90), TC (p = 0.79), HDL-C (p = 0.77), TG (p = 0.07), and LDL-C (p = 0.32).
The high-CAVI group comprised more participants aged ≥65 years (p < 0.01), and the incidence of dyslipidemia (p = 0.02) and HT (p < 0.01) was higher when compared with the low-CAVI group. On the other hand, the incidence of obesity was higher in the low-CAVI group (p = 0.02) (Table 1).
| Variables | All participants (N = 95) | Low-CAVI (N = 50) | High-CAVI (N = 45) |
|---|---|---|---|
| Age (years) | 66.02 ± 4.66 | 64.28 ± 4.21 | 67.96 ± 4.40 |
| Male n, (%) | 17 (17.89) | 7 (14.00) | 10 (22.22) |
| HR (bpm) | 68.14 ± 0.94 | 68.74 ± 9.84 | 67.47 ± 8.51 |
| Anthropometric parameters | |||
| Height (cm) | 156 (137, 180) | 155 (140, 180) | 156 (137, 176) |
| Body mass (kg) | 59.67 ± 0.78 | 60.68 ± 8.31 | 58.56 ± 6.67 |
| BMI (kg/m2) | 24.17 (18.26, 36.23) | 24.54 (18.26, 33.16) | 23.49 (18.73, 36.23)* |
| Body fat (%) | 32.85 ± 0.51 | 33.76 ± 4.65 | 31.84 ± 5.19 |
| WC (cm) | 85.98 ± 0.88 | 86.40 ± 9.17 | 85.51 ± 7.61 |
| HC (cm) | 97.04 ± 0.58 | 97.63 ± 5.56 | 96.40 ± 5.39 |
| WHR | 0.87 (0.76, 1.05) | 0.87 (0.86, 1.05) | 0.87 (0.77, 1.01) |
| Lipid profiles | |||
| TC (mg/dL) | 239.09 ± 45.31 | 239.16 ± 46.93 | 239.02 ± 43.97 |
| HDL-C (mg/dL) | 62 (25, 110) | 61 (25, 101) | 64 (41, 110) |
| TG (mg/dL) | 86 (30, 268) | 86 (41, 110) | 87 (30, 268) |
| LDL-C (mg/dL) | 162.61 ± 40.96 | 164.00 ± 42.17 | 161.06 ±39.98 |
| Clinical parameters | |||
| Age ≥ 65, n (%) | 54 (56.84) | 20 (40.00) | 34 (75.55)* |
| Dyslipidemia, n (%) | 69 (72.63) | 31 (62.00) | 38 (84.44)* |
| HT, n (%) | 49 (51.58) | 17 (34.00) | 32 (71.11)* |
| Obesity, n (%) | 35 (36.84) | 24 (48.00) | 11 (24.44)* |
| Abdominal obesity, n (%) | 65 (68.42) | 36 (72.00) | 29 (64.44) |
p < 0.05. p-values were derived from independent t-tests or Mann–Whitney U-tests or chi-square tests, as appropriate.
All variables were presented as means ± SD or median and range (min, max) or number (percentage).
bpm, beats/minute.
Baseline characteristics of the study population grouped according to CAVI threshold
The CAVI was significantly higher on both right and left sides of the body in the high-CAVI group (R-CAVI 9.78 ± 0.71 and L-CAVI 9.72 ± 0.71) than in the low-CAVI group (R-CAVI 8.17 ± 0.49, p < 0.01 and L-CAVI 8.13 ± 0.50, p < 0.01) (Figure 1).
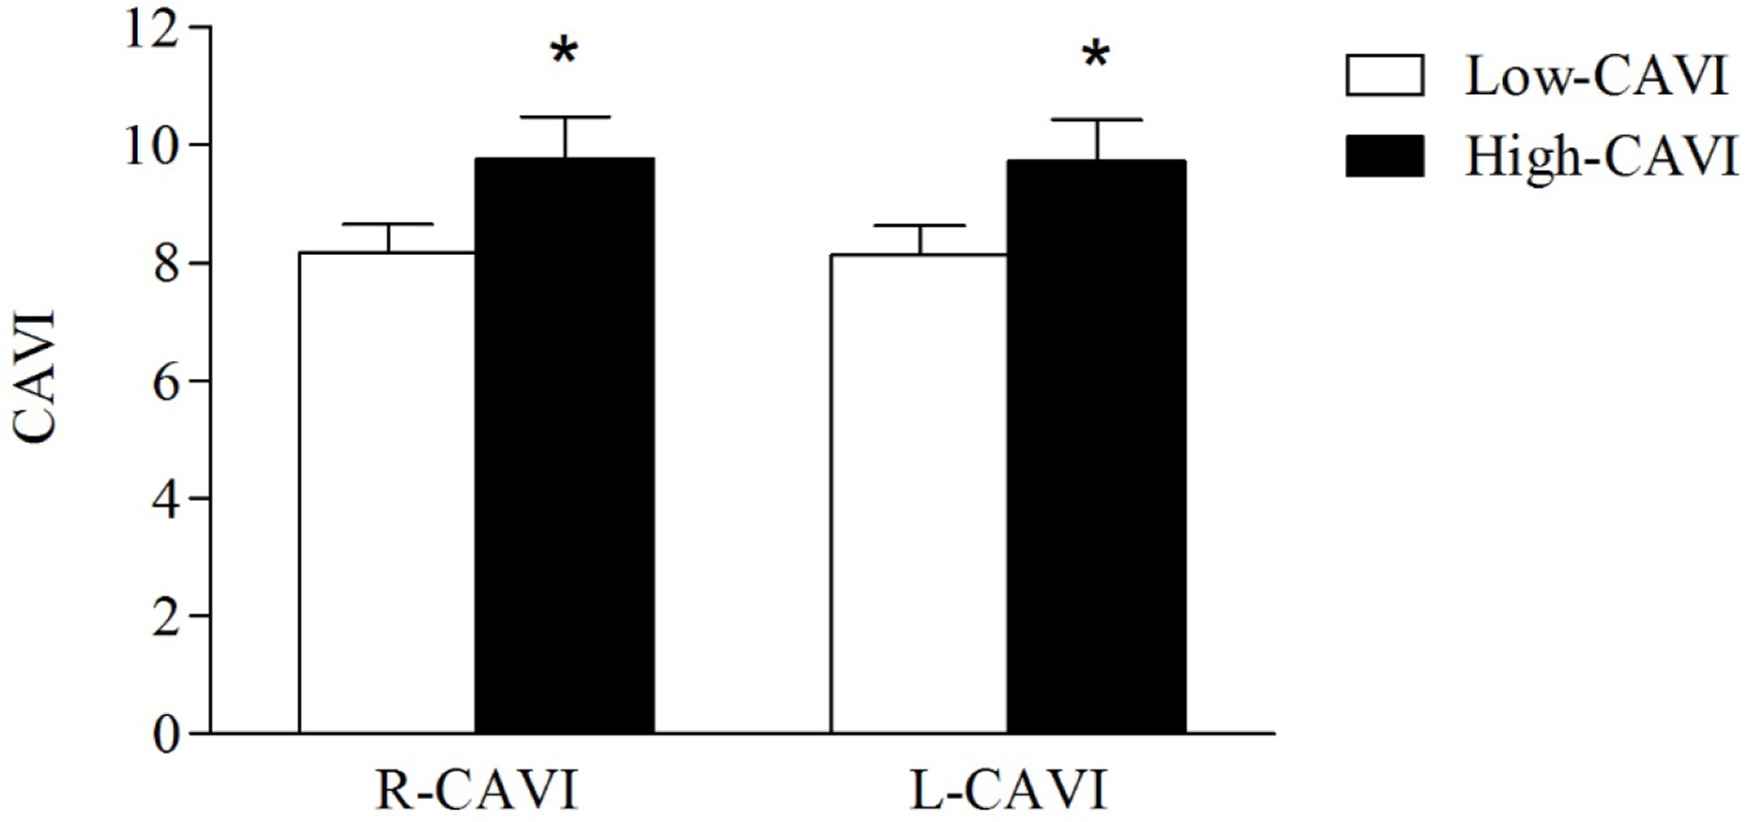
CAVI values of the study population grouped according to a CAVI threshold of 9.0. All variables were presented as means ± SD. *p < 0.05. Independent t-test was used to compare the low- (open bars) and the high-CAVI (closed bars) groups.
Blood pressure components were also significantly higher in the high-CAVI group than in the low-CAVI group (SBP, 133.96 ± 14.09 mmHg vs. 123.16 ± 12.57 mmHg, p < 0.01; DBP, 78.98 ± 7.74 mmHg vs. 75.16 ± 7.49 mmHg, p = 0.01; MAP, 92.72 ± 7.38 mmHg vs. 89.31 ± 7.46 mmHg, p = 0.02; PP, 54.98 ± 11.79 mmHg vs. 48.00 ± 8.72 mmHg, p < 0.01) (Figure 2).
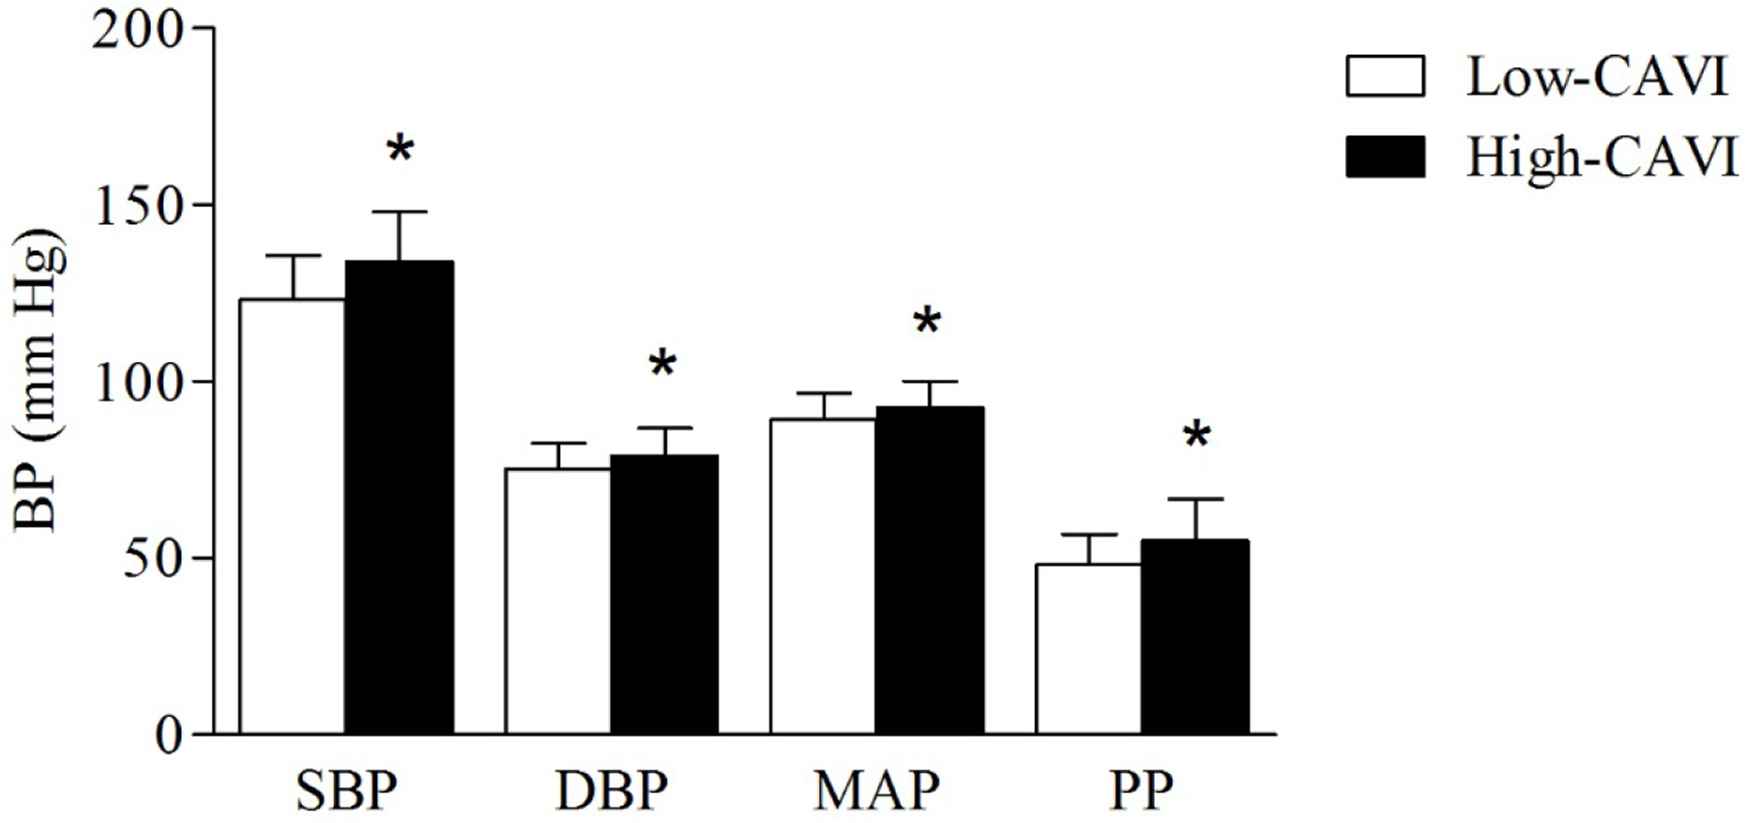
BP components of the study population grouped according to a CAVI threshold of 9.0. All variables were presented as means ± SD. *p < 0.05. Independent t-test was used to compare the low- (open bars) and the high-CAVI (closed bars) groups.
Pearson correlation coefficients were used to describe correlations between the variables (Table 2). In the high-CAVI group, both R- and L-CAVI showed a significantly positive correlation with age (R-CAVI, r = 0.38, p = 0.01; L-CAVI, r = 0.30, p = 0.04), SBP (R-CAVI, r = 0.41, p < 0.01; L-CAVI, r = 0.37, p = 0.01) and PP (R-CAVI, r = 0.56, p < 0.01; L-CAVI, r = 0.51, p < 0.01), whereas negative correlations were shown with HR (R-CAVI, r = −0.35, p = 0.01; L-CAVI, r = −0.29, p = 0.04).
| Variables | All participants (N = 95) | Low-CAVI (N = 50) | High-CAVI (N = 45) | |||
|---|---|---|---|---|---|---|
| R-CAVI | L-CAVI | R-CAVI | L-CAVI | R-CAVI | L-CAVI | |
| Age (years) | 0.30* | 0.29* | −0.18 | −0.15 | 0.38* | 0.30* |
| HR (bpm) | −0.12 | −0.11 | 0.14 | 0.09 | −0.35* | −0.29* |
| Anthropometric data | ||||||
| Height (cm) | −0.08 | −0.06 | −0.24 | −0.11 | −0.00 | 0.01 |
| Body mass (kg) | −0.23* | −0.19 | −0.27 | −0.14 | −0.14 | −0.14 |
| BMI (kg/m2) | −0.17 | −0.17 | −0.15 | −0.04 | 0.00 | −0.01 |
| Body fat (%) | −0.09 | −0.09 | 0.10 | 0.18 | 0.10 | 0.03 |
| WC (cm) | −0.15 | −0.15 | −0.17 | −0.16 | −0.20 | −0.21 |
| HC (cm) | −0.23* | −0.22* | −0.23 | −0.22 | −0.27 | −0.23 |
| WHR | 0.01 | −0.02 | −0.01 | −0.04 | −0.03 | −0.09 |
| Lipid profiles | ||||||
| TC (mg/dL) | 0.03 | 0.07 | 0.03 | −0.14 | 0.06 | 0.01 |
| HDL-C (mg/dL) | −0.08 | −0.02 | 0.04 | −0.13 | −0.01 | −0.15 |
| TG (mg/dL) | 0.01 | −0.02 | −0.09 | −0.11 | −0.06 | 0.08 |
| LDL-C (mg/dL) | 0.02 | 0.05 | 0.02 | −0.09 | 0.13 | 0.06 |
| BP components | ||||||
| SBP (mm Hg) | 0.40* | 0.42* | −0.04 | 0.08 | 0.41* | 0.37* |
| DBP (mm Hg) | 0.18 | 0.20* | 0.14 | 0.19 | −0.13 | −0.10 |
| MAP (mm Hg) | 0.24* | 0.24* | 0.16 | 0.22 | 0.05 | −0.00 |
| PP (mm Hg) | 0.39* | 0.40* | −0.19 | −0.03 | 0.56* | 0.51* |
p < 0.05.
Values of r represent Pearson’s correlation coefficients, which is a bivariate correlation.
bpm, beats/minute.
Correlations between CAVI and baseline characteristics, anthropometric data, lipid profiles, and BP components
Stepwise multiple linear regression analysis was performed to identify variables that were independently associated with the CAVI. This analysis indicated that SBP (β coefficient = 0.43, p < 0.01) and HC (β coefficient = −0.23, p = 0.01) were independently associated with the CAVI (Table 3).
| Variables | B-value | SE | β | p-value |
|---|---|---|---|---|
| (constant) | 9.10 | 1.79 | ||
| SBP (mm Hg) | 0.03 | 0.01 | 0.43 | <0.01* |
| HC (cm) | −0.04 | 0.01 | −0.23 | 0.01* |
| Adjusted R2 = 0.24 | p < 0.01* | F = 15.72 |
p < 0.05.
B, unstandardized regression coefficient; SE, standard error; β = standardized coefficient.
Stepwise multiple regression analysis for CAVI and related parameters among participants
The ORs of risk factors for the high-CAVI group were analyzed by multiple logistic regression. A high CAVI was significantly and independently predetermined by age ≥65 years (OR, 7.35; 95% CI, 2.42–22.36; p < 0.01), obesity (OR, 0.20; 95% CI, 0.64–0.67; p < 0.01), HT (OR, 4.72; 95% CI, 1.67–13.32; p < 0.01), and dyslipidemia (OR, 4.84; 95% CI, 1.42–16.46; p = 0.01). However, the ORs of male gender and abdominal obesity did not reach statistical significance (Table 4).
| Variables | OR (95% CI) | p-value |
|---|---|---|
| Gender (male; 1, female; 0) | 1.74 (0.42–7.14) | 0.43 |
| Age (≥65 years; 1, <65 years; 0) | 7.35 (2.42–22.36) | <0.01* |
| Obesity (BMI >25 kg/m2; 1, <25 kg/m2; 0) | 0.20 (0.64–0.67) | <0.01* |
| Abdominal obesity (+; 1, −; 0) | 0.38 (0.12–1.28) | 0.12 |
| HT (+; 1, −; 0) | 4.72 (1.67–13.32) | <0.01* |
| Dyslipidemia (+; 1, −; 0) | 4.84 (1.42–16.46) | 0.01* |
p < 0.05.
An OR higher than 1 indicated the probability of high-CAVI increases in each variable.
Abdominal obesity was defined as waist circumference ≥90 cm for males or ≥80 cm for females. HT was defined as SBP ≥ 130 mmHg or DBP ≥ 80 mmHg. Dyslipidemia was defined as LDL-C level ≥140 mg/dL, HDL-C level ≤40 mg/dL, TG level ≥150 mg/dL, or the use of anti-dyslipidemia medication.
Logistic regression model to determine the association of clinical parameters with a high CAVI (≥9)
4. DISCUSSION
The high-CAVI group had significantly higher BP components than the low-CAVI group. Consistent with a recent study, SBP and DBP in old patients with chronic kidney disease were higher in the high-CAVI group than the low-CAVI group [12]. Meanwhile, a positive correlation existed between CAVI and both SBP and PP in the high-CAVI group, and in older adults, high SBP and high PP were more powerful independent cardiovascular risk factors: especially increased PP due to decreased DBP and increased SBP [17]. SBP and arterial stiffness increase with advancing age, interacting in a vicious cycle [18]. Structural changes occur with age that reflect a gradual vascular remodeling, leading to a reduction in the elasticity of the arterial wall [3,17,19]. The resultant increase in vascular distension pressure causes an increase in arterial stiffness, which in turn raises SBP. The CAVI was significantly higher in people aged 65 and older than in younger people [3]. Previous studies found that the CAVI was positively correlated with SBP [20–22], DBP [20,22], PP [21,22], and MAP [19]. However, consideration of the correlation between CAVI and the different components of BP in different populations should take into account previous conditions.
Our present study showed that CAVI was higher in participants who presented with hypertension. Hypertension causes increased intraluminal pressure, which stimulates collagen production. This process resulted in increased arterial stiffness [23]. Although the CAVI was considered to be influenced by changes to structural and functional arterial stiffness only in patients with chronically high BP [5,6] it was more strongly influenced by the vascular changes than by the measured BP [5]. Hence, CAVI demonstrated the real effect of hypertension on arterial wall stiffness. Recently, an updated index of arterial stiffness was introduced, called CAVI0, that is theoretically BP-independent [24]. The CAVI0 may offer more robust information about arterial stiffness than the standard CAVI [25]. However, CAVI0 showed unreasonable values between healthy and hypertensive populations [4].
The current study revealed that dyslipidemia was associated with significantly higher CAVI values. A previous study reported that CAVI values were significantly higher in dyslipidemia patients without diabetes or hypertension than in healthy controls [2]. It is known that the progression of atherosclerosis is accelerated in patients with abnormal levels of lipids. However, the present study found no significant difference in lipid profiles between the high-CAVI and low-CAVI groups and no significant association between the CAVI and lipid profiles. Nor could this study determine the time course for the development of vascular changes; possibly because early atherosclerotic changes are not reflected in the CAVI. A previous study reported that there was no significant difference in CAVI between heterozygous familial hypercholesterolemia and healthy controls [26]. That CAVI should be positively correlated with TC but negatively correlated with HDL-C [22] might seem inconsistent with previous studies [19,22,27], but reported lipid profiles were worse among participants with higher CAVI, exhibiting elevated TC and LDL-C and decreased HDL-C [19]. In middle-aged and elderly Chinese patients with metabolic syndrome, abnormally low HDL-C levels were associated with significantly higher CAVI scores [27]. In healthy Japanese individuals, CAVI increased progressively with increasing levels of TC, TG, LDL-C, and decreased with increasing levels of HDL-C, after adjusting for gender, age, SBP, and BMI [28]. However, the significance of the lipid parameters was not confirmed and was questioned by different studies. The association between lipid profiles and arterial stiffness seems to be complex. Several pathophysiological mechanisms are implicated in concomitant conditions and risk factors, such as atherosclerotic plaque development, oxidative stress, vascular inflammation, endothelial dysfunction, low nitric oxide bioavailability, and endothelin action [29].
The negative correlation of CAVI with HC was a finding that stood out. One possible explanation for this association is that HC decreases with the progression of arterial stiffness, which was directly associated with skeletal frame size and adipose and muscle mass in the hip and thighs [30,31]. Although obesity is considered one of the risk factors of atherosclerosis, larger hips may contribute to lipolysis, which was involved in decreased risk of diabetes mellitus and CVD [32] and a linear decrease in CAVI scores in both non-obese and obese individuals without metabolic disorders was associated with fat accumulation [9]. However, excess body weight is more strongly correlated with insulin resistance and has been associated with decreased endothelium-dependent vasodilation, and arterial compliance may be partially dependent on nitric oxide to moderate vascular remodeling and vascular stiffness [33]. It is worth mentioning that differences in CAVI due to obesity could be caused by exaggerated calculations of vascular length in obese people. The greater area of the body surface makes precise measurement difficult. If this were the case, a higher value for PWV would result, and in turn a higher CAVI score. Therefore, the overestimation of the actual distance of the arterial pulse wave may be a potential confounding limitation. It is known that travel distance is proportional to body height but the present study found that height was not significantly different between obese and non-obese participants (data not shown). Nevertheless, the calculation of PWV largely depends on the measuring of distances which are subject to inconsistencies. Hence, analyses that involve PWV as an explanatory variable should be adjusted for body height and possibly heart rate [34].
In the present study, no significant association was observed between male gender and high CAVI. A previous study reported the association between arterial stiffness in females to be twofold higher than in males [35]. Young women have lower arterial stiffness than men, but arterial stiffness in women increases with age [36]. Declining levels of the sex hormones estrogen and progesterone may explain the phenomenon. However, the differences in the mechanisms that change arterial stiffness in both sexes are not fully understood. Further studies are needed to determine the impact of hormones on arterial stiffness.
It must be noted that our study has some limitations. This was a single-center study that considered a relatively small sample, which may limit the generalizability of the results. Moreover, data were lacking on some potential confounders such as physical activity level, diet, hormonal levels, smoking status, and renal function or inflammation markers. Finally, the present study used a CAVI of ≥9 as the threshold level of suspected arteriosclerosis condition, but Thai people with CVD were previously associated with a CAVI of >8 with a reported sensitivity of 92.0%, a specificity of 63.0%, and an accuracy of 70.0% [37]. Thus, a lower CAVI value should be considered an appropriate cut-off value when conducting further research in Thai populations.
5. CONCLUSION
The significant difference in SBP and pulse pressure observed between the high and low CAVI groups may help identify participants with early vascular damage. Elderly people with chronic high SBP need to be further assessed for arterial stiffness using the CAVI. Moreover, assessment of patients with higher CAVI scores enables the identification and proper treatment of those already in the earlier stages of the cardiovascular continuum.
CONFLICTS OF INTEREST
The authors declare they have no conflicts of interest.
AUTHORS’ CONTRIBUTION
TR and NH study conceptualization and writing (review and editing) the manuscript, TR, RS and NH data curation, formal analysis and writing (original draft), TR funding acquisition and project administration, TR supervised the project, TR and NH formal analysis and writing the manuscript.
FUNDING
This work was supported by a grant from the
ACKNOWLEDGMENT
We thank all of the participants for their participation in this study, all of the staff at the Hatyai Chivasuk Health Promotion Center for their technical assistance, and Mr. Thomas Duncan Coyne for help with editing the English language manuscript.
ETHICS APPROVAL
Ethics approval from the Research Ethics Committees of the Faculty of Medicine of the Prince of Songkla University (60-166-19-2).
Footnotes
REFERENCES
Cite this article
TY  - JOUR
AU  - Thapanee Roengrit
AU  - Ruchada Sri-amad
AU  - Nawiya Huipao
PY  - 2020
DA  - 2020/11/18
TI  - High Systolic Blood Pressure is Associated with Increased Cardio-ankle Vascular Index in the Elderly
JO  - Artery Research
SP  - 25
EP  - 31
VL  - 27
IS  - 1
SN  - 1876-4401
UR  - https://doi.org/10.2991/artres.k.201102.002
DO  - 10.2991/artres.k.201102.002
ID  - Roengrit2020
ER  -