
Correlation between Neck Circumference and Pulse Wave Velocity: A Population-based Study
Both authors contributed equally.
- DOI
- 10.2991/artres.k.200225.001How to use a DOI?
- Keywords
- Pulse wave velocity; neck circumference; cardiovascular diseases
- Abstract
Background: Cardiovascular diseases are the main cause of death worldwide. In this setting, Neck Circumference (NC) and Pulse Wave Velocity (PWV) are simple and valuable tools for an early evaluation of cardiovascular risk through the assessment of upper body obesity and arterial stiffness. However, the associations between both measurements have not been systematically explored.
Methods: A population-based cross-sectional study representative of a neighborhood of Salvador-BA, Brazil. Data were collected between December 2016 and May 2019, and comprise 130 individuals for the present study. Variables such as age, sex, education levels and NC were analyzed to verify their associations with PWV status. Correlations between PWV and NC were performed to further depict their association.
Results: There was a predominance of patients with elevated PWV. The subgroup of patients aged 60 years or older presented the largest proportion of PWV alterations over normal results. There was a majority of women in the study population and sex could not determine PWV status. There was a predominance of concomitant elevation of NC and PWV in the studied population. NC measurements could distinguish PWV status from women and the study population. NC and PWV had a positive and statistically significant correlation for women and for the general population.
Conclusion: These findings suggest a possible association between upper body obesity and vascular homeostasis impairment. Therefore, screening patients with both measurements could prove relevant to better identify subclinical vascular perturbations and further delimitate prognosis related to cardiovascular events potentially associated with them.
- HIGHLIGHTS
- •
Elevation of pulse wave velocity (PWV) was associated with the increase of age.
- •
Frequency of patients with elevated PWV and neck circumference was predominant.
- •
Neck circumference and pulse wave velocity were positively correlated.
- •
- Copyright
- © 2020 Association for Research into Arterial Structure and Physiology. Publishing services by Atlantis Press International B.V.
- Open Access
- This is an open access article distributed under the CC BY-NC 4.0 license (http://creativecommons.org/licenses/by-nc/4.0/).
1. INTRODUCTION
Cardiovascular Diseases (CVD) remain as a major public health problem, as well as the leading cause of death worldwide [1,2]. According to the Pan American Health Organization and the World Health Organization (WHO), around 31% of deaths worldwide were related to CVD in 2015 [1,2]. In this setting, millions of dollars are invested annually in studies and strategies which aim to expand knowledge with regard to risk factors and preventive approaches to CVD [2–4].
The relationship between CVD and the majority of its risk factors, such as dyslipidemia, smoking, overweight and obesity, is well defined [1,5]. Furthermore, the success of preventive strategies to CVD is strongly associated with proper management of these risk factors [5]. Some biomarkers have already been proposed for the evaluation of cardiovascular-related impairments associated with these deleterious conditions [6,7]. Such biomarkers range from exams that have been widely used in medical practice for years, such as the assessment of serum cholesterol or Body Mass Index (BMI) calculations, to some novel and promising applications, like the measurement and analysis of Pulse Wave Velocity (PWV) [6].
In recent years, PWV measurement has been presented as a relevant exam in the detection of vascular damage and, consequently, in the early identification of cardiovascular risk [6,8–10]. Some key characteristics of the PWV measurement highlight its importance as a tool capable of indirectly evaluate vascular aging - it is a simple, accurate, and noninvasive exam, easily reproducible in clinical practice [8]. The increase in PWV is consequent to the process of vascular remodeling, which occurs subsequently to a decrease of arterial wall elasticity [11,12]. These events are highly, but not necessarily, associated with the natural process of aging of an individual [6,8,9]. In this context, PWV is considered the gold standard in the assessment of arterial stiffness, and thus potentially predicts cardiovascular events as well [6–8].
In addition, Neck Circumference (NC) measurement is an important tool for the assessment of body adiposity [13,14]. The method is considered a practical, simple, and accurate anthropometric indicator [15,16]. Moreover, upper body obesity has been reported as a more influential factor in the development of CVD than lower body obesity [17]. This phenomenon is apparently due to higher repercussions and increased effects of the release of systemic free fatty acids in this part of the body [18]. In addition, obesity is well known as a chronic condition associated with increased cytokine and chemokine levels, which influence and favors increases in arterial stiffness in the long term [8,19]. Increases in arterial stiffness are reportedly related to increases in PWV [20]. Therefore, an association between upper body obesity and alterations in pulse velocity could be hypothesized.
The present study proposes to verify and evaluate the relationship between upper body obesity and arterial stiffness through the measurements of NC and PWV. Furthermore, there is not only a relevance in the better comprehension of how upper body obesity may influence cardiovascular events, but also in how the screening through the correlation of these measurements could help with an earlier detection of vascular perturbations.
2. MATERIALS AND METHODS
2.1. Study Design and Population
This is a cross-sectional, observational, analytical, population-based study of a Brazilian neighborhood in the city of Salvador. From this region, 152 individuals were recruited between December 2016 and May 2019, and their epidemiological, PWV and NC data, were collected and analyzed.
Individuals had to reside in the studied region and have at least 18 years of age to be included in the present study. Pregnant, bedridden, people with locomotion difficulties and patients with a standard deviation PWV (index related to the accuracy of PWV measurement) ≥10% were excluded from the study. Overall, 130 patients from the 152 total individuals fitted all the inclusion and exclusion criteria.
This study is part of a larger project named VASCOR, carried out by Faculdade de Tecnologia e Ciências (FTC), in a partnership with Fiocruz-Bahia and Universidade de Minho in Portugal, the main purpose of which is to investigate the association between visceral obesity syndrome or metabolic syndrome, low-intensity chronic inflammation and arterial stiffness.
2.2. Area of Coverage
The studied area was the Ogunjá Valley region, which is part of the Acupe from Brotas neighborhood, in the city of Salvador, capital of Bahia, Brazil. This region is subdivided into 12 census tracts, according to the Brazilian Geografic and Stastistic Institute Census [21]. These census sectors were mapped, and are composed by the main roads (aggregates), secondary roads, alleys and smaller alleys (Figure 1). Each sector used in the research was defined by random sampling, as well as its respective used aggregates, to keep representativeness for the different regions. Only one individual was included from each drawn household.
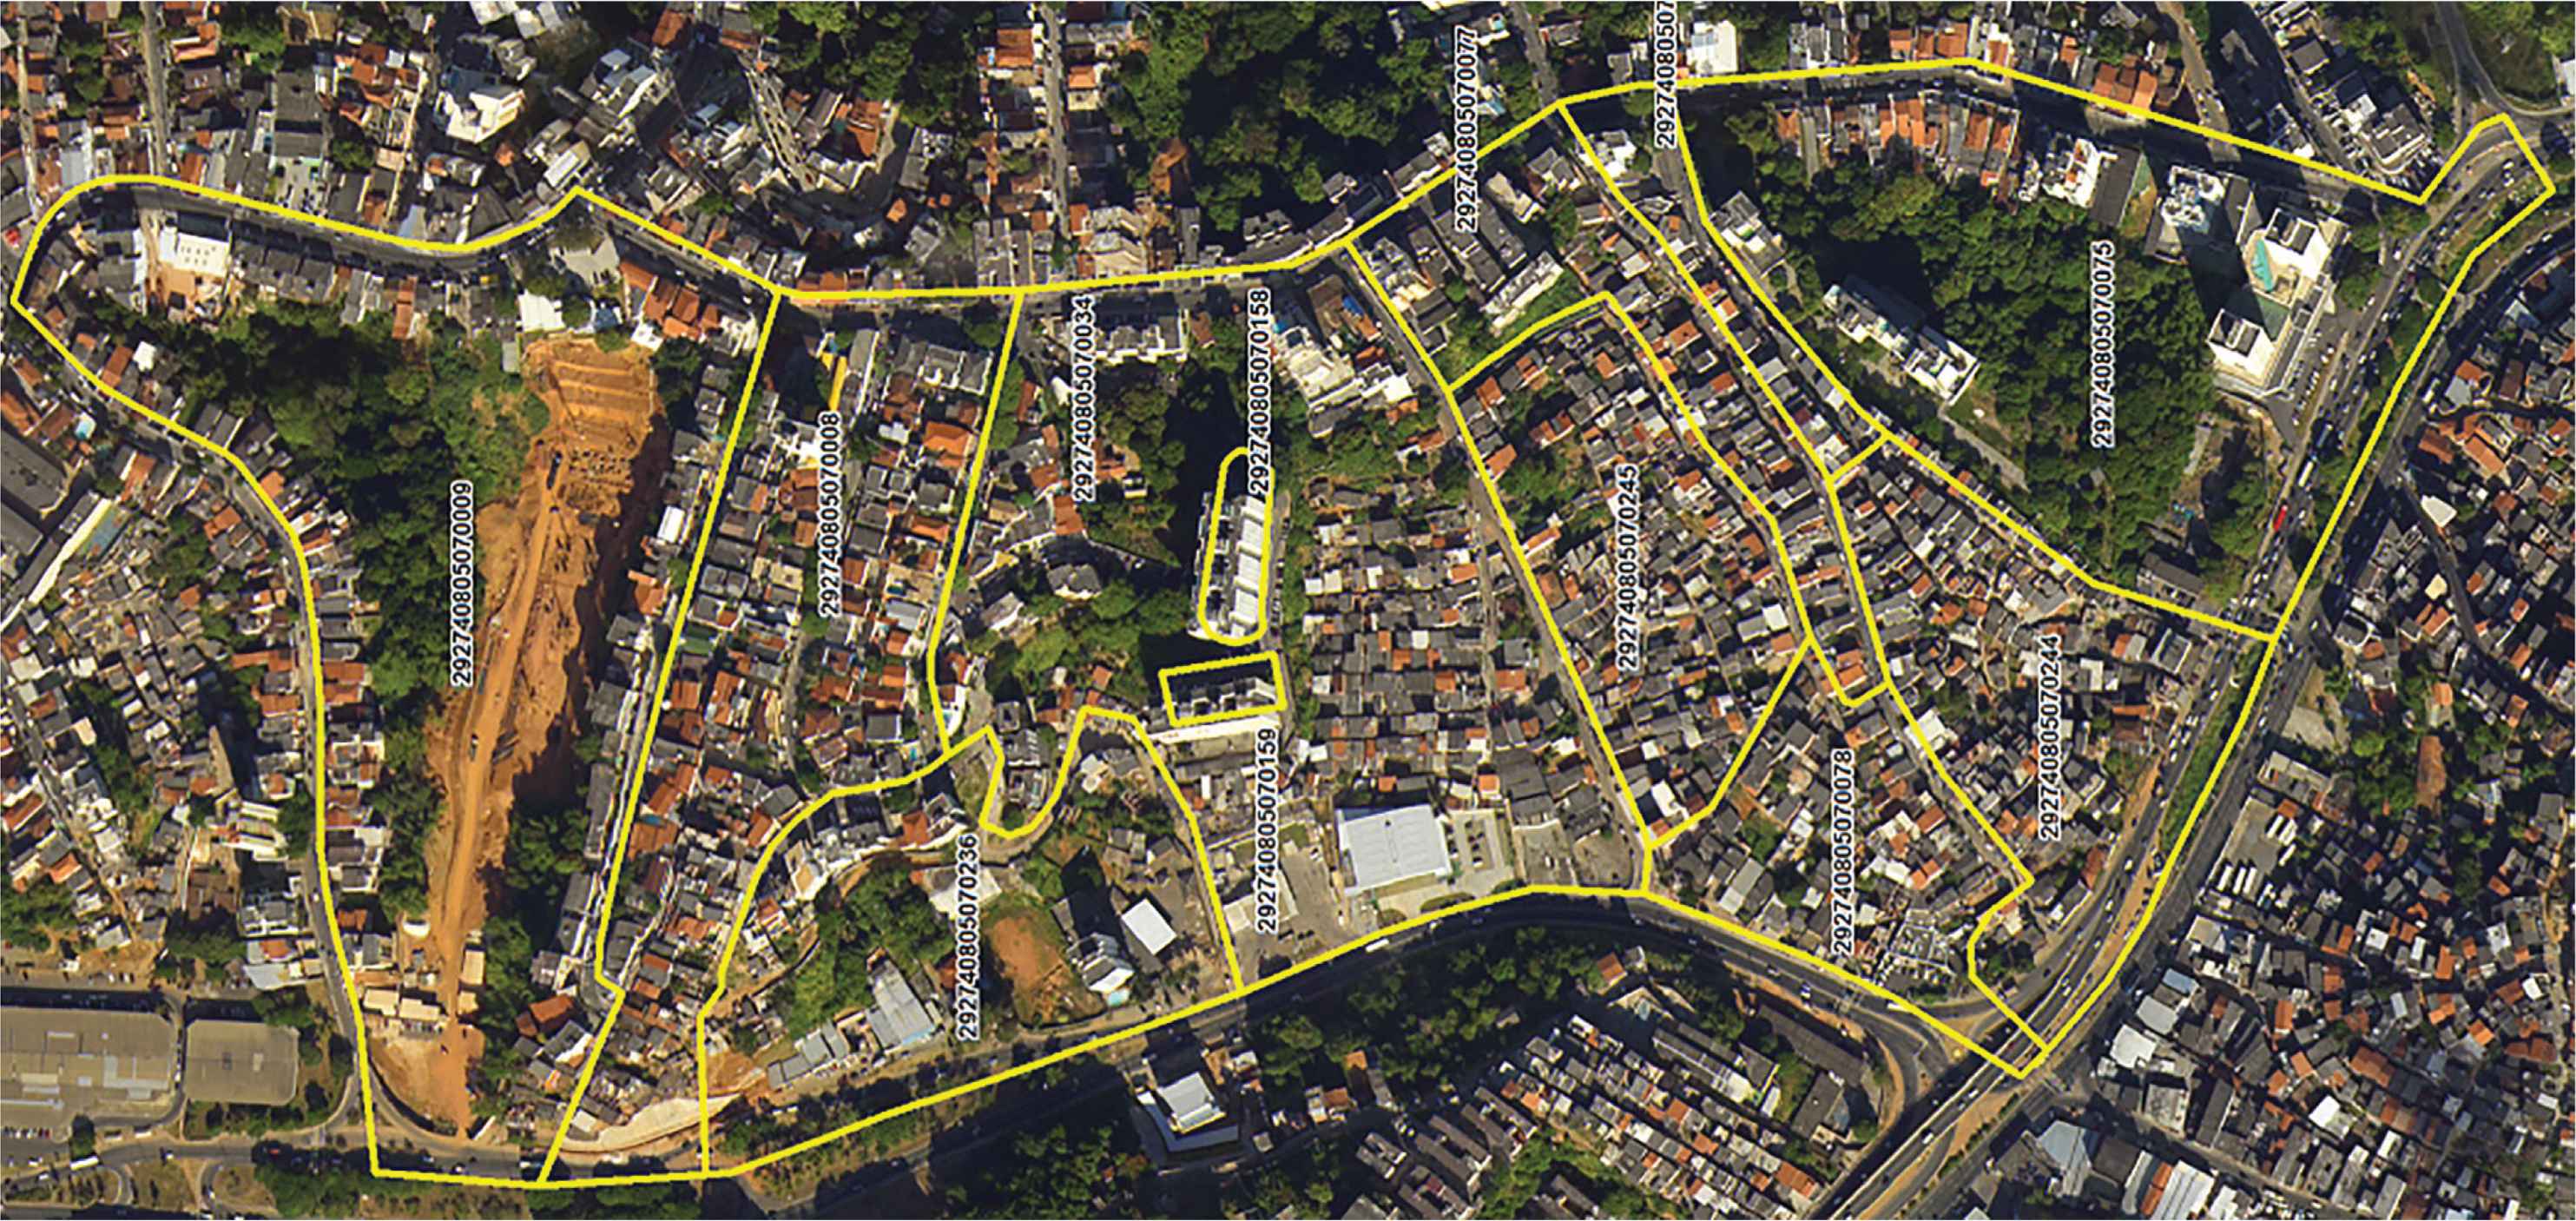
Delimitation of the area used for collecting sample data (areas of the study delimitated by Google Maps). Aerial image of the studied area. The region is subdivided into 12 census tracts, as highlighted by the yellow lines. Each sector used in composed by its own streets, alleys, and aggregates. Random sampling determined the sectors and regions to be studied.
2.3. Data Collection and Definitions
The data were obtained through structured interviews applied at home visits. Individual and household information were collected, and complementary exams, which included the evaluation of PWV and anthropometric measurements, including NC measurement, were scheduled at the FTC School Clinic. Before the interview, participants were informed of the objectives of the study and, after agreement to, the informed consent form was read and signed.
The PWV value was obtained from the measurement of the velocity of the pulse wave between the right cervical carotid and the right femoral arteries. The measurement equipment was the flattening tonometer SphygmoCor® applanation (XCEL, AtCor Medical, Sydney, Australia), coupled with electrocardiogram. The carotidfemoral length was measured in millimeters with the final value corrected by the constant 0.80 [8]. This constant act as a correction factor in distance measurements using a standard tape measure, as it mitigates possible interference related to breast and abdomen volume or surface [8]. Only results with standard deviation for PWV values <10% were considered accurate. The PWV reference values up to 10 m/s or >10 m/s were used to define its status as “normal” or “elevated”, respectively [6,8].
The NC was measured in centimeters with an inelastic fiberglass tape measure, and the cricothyroid cartilage height level was used as a reference for the measurement. For men, the NC was measured just below the cartilage because of the greater prominence of this region [15,16]. The values defined as the NC normality limits were 37 cm for men and 34 cm for women [13], as shown in Figure 2 [22].
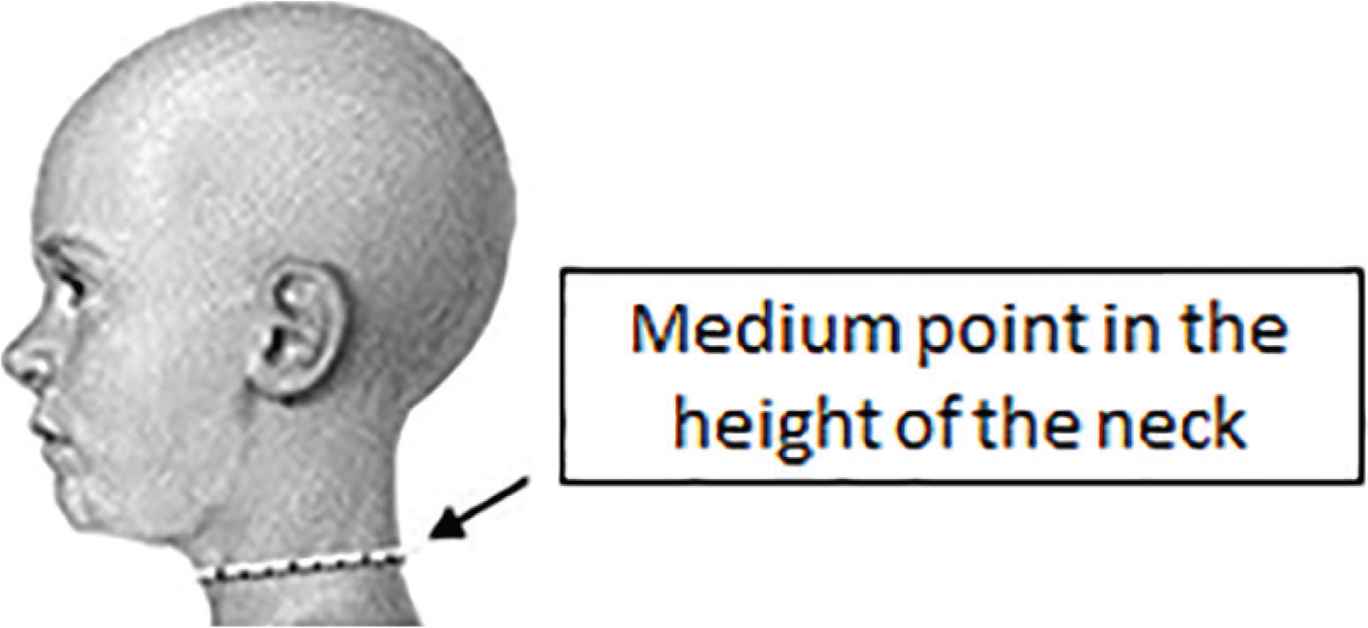
Anatomical site to define the neck circumference. Representation of the midpoint of neck height in the individual. Adapted from Vasques et al. [22]
Data with regard to age group (<40 years, 40–59 years, and 60 or more years of age) and sex were also analyzed. The education classification was based on three levels defined as follows (Basic, Secondary, Tertiary). Patients who only studied until middle school completion were classified in the Basic level of education. Patients who at least started or finished high school education were classified in the Secondary level of education. Individuals who started or completed a bachelor or equivalent preparation and those with master or doctoral degrees were classified in the Tertiary level of education.
2.4. Statistical Analysis
The median values with Interquartile Ranges (IQRs) were used as measures of central tendency. Chi-square test or Fisher’s exact test was used to compare frequency between the study groups. Continuous variables were compared using the Mann–Whitney U-test. Spearman tests were performed to evaluate the correlation between PWV and NC values. The value of Spearman rank (r) necessary to consider the assessment as a correlation was of 0.2 [23]. A p-value below 0.05 was considered statistically significant.
The statistical analyzes were performed using Graphpad Prism 7.0 (GraphPad Software Inc., San Diego, CA, USA).
2.5. Ethics Statement
This study follows the definitions set forth in the Declaration of Helsinki and was submitted to and approved by the FTC’s Research Ethics Committee (CEP), in accordance with the ethical precepts of Resolution 466/2012 of the National Health Council (No1827621), which consists of guidelines and norms governing researches with humans.
Data were collected with the guarantee of confidentiality, that ensures the privacy and anonymity of the subjects regarding the confidential data involved in the research, which aim to mitigate any situations that could cause any kind of biological, physical and/or psychological damage. The Informed Consent Form was read and signed by all participants in this study.
3. RESULTS
Table 1 describes general characteristics from the studied population according to the PWV status. From the 130 patients, there was a predominance of patients with an elevated PWV (n = 75) when compared to the number of those who had normal PWV (n = 55) results. Overall, an elevated PWV was found predominantly in the subgroup of patients with 60 or more years of age (n = 28), even with a smaller number of patients in this subgroup when compared to those composed of younger patients (Table 1). In addition, a significant tendency of increase in the proportion of patients with elevated PWV against those with normal PWV as age increases is also demonstrated in Table 1.
| Variables | Total (%) | PWV (m/s) | p-value | |
|---|---|---|---|---|
| Normal | Elevated | |||
| N | 130 (100) | 55 | 75 | |
| Age (years) – N (%)* | ||||
| <40 | 51 (39.6) | 29 (53.7) | 22 (29.4) | 0.0001 |
| 40–59 | 47 (36.4) | 22 (40.7) | 25 (33.3) | |
| >60 | 31 (24.0) | 3 (5.6) | 28 (37.3) | |
| Gender – N (%) | ||||
| Female | 88 (67.69) | 38 (69.09) | 50 (66.67) | 0.8503 |
| Male | 42 (32.31) | 17 (30.91) | 25 (33.33) | |
| Neck circumference – N (%) | ||||
| Normal | 55 (42.31) | 31 (56.36) | 24 (32) | 0.0071 |
| Elevated | 75 (57.69) | 24 (43.64) | 51 (68) | |
01 participant with normal PWV did not present data regarding to his age. Frequency data were compared using the chi-square test or the Fisher’s exact test. A p-value below 0.05 was considered statistically significant, and was highlighted in bold.
Characteristics of the study participants stratified according to Pulse Wave Velocity (PWV) status
Furthermore, despite the fact of the study population been composed predominantly of women (n = 88), both women and man presented similar proportions of the number of individuals with elevated PWV (around 57% and 60%, respectively, Table 1). In addition, only sex was not able to distinguish patients within the subgroups of elevated or normal PWV (p = 0.8503, Table 1).
With regard to the analysis of NC, it was found a significant predominance of both elevated NC and PWV in the study population (n = 51, p = 0.0071, Table 1). Interestingly, although NC measurement classification could not distinguish the individual level of education (p = 0.0529, Supplementary Table 1), similar frequencies were sufficient to distinguish patients from each level of education based on their PWV status (p = 0.0148, Supplementary Table 1).
The following step was to further depict the association between altered NC and PWV measurements. Thus, the patients were distributed according to their NC values, whilst alterations in PWV status were also highlighted, as illustrated in Figure 3A. In this analysis, the tendency of an increased frequency of patients with altered PWV status as NC values increases, for both men and women, is emphasized – particularly in those patients which NC measurement exceeded its respective reference limit. Even more, there is a statistically significant difference of NC values, according to the elevated or normal status of PWV, found for women (median: 35 cm; IQR: 33.38–37 vs. median: 34 cm, IQR: 32–35, respectively; p = 0.0047) and in the general population (median: 37 cm; IQR: 34–39; vs. median: 35 cm; IQR: 33–37, respectively; p = 0.0030), as shown in Figure 3B and Table 2. However, it can also be noted that such difference was yet to be statistically significant for male subjects (median: 39 cm; IQR: 38–41; vs. median: 38 cm; IQR: 36.5–39.5, respectively; p = 0.0634, Table 2).
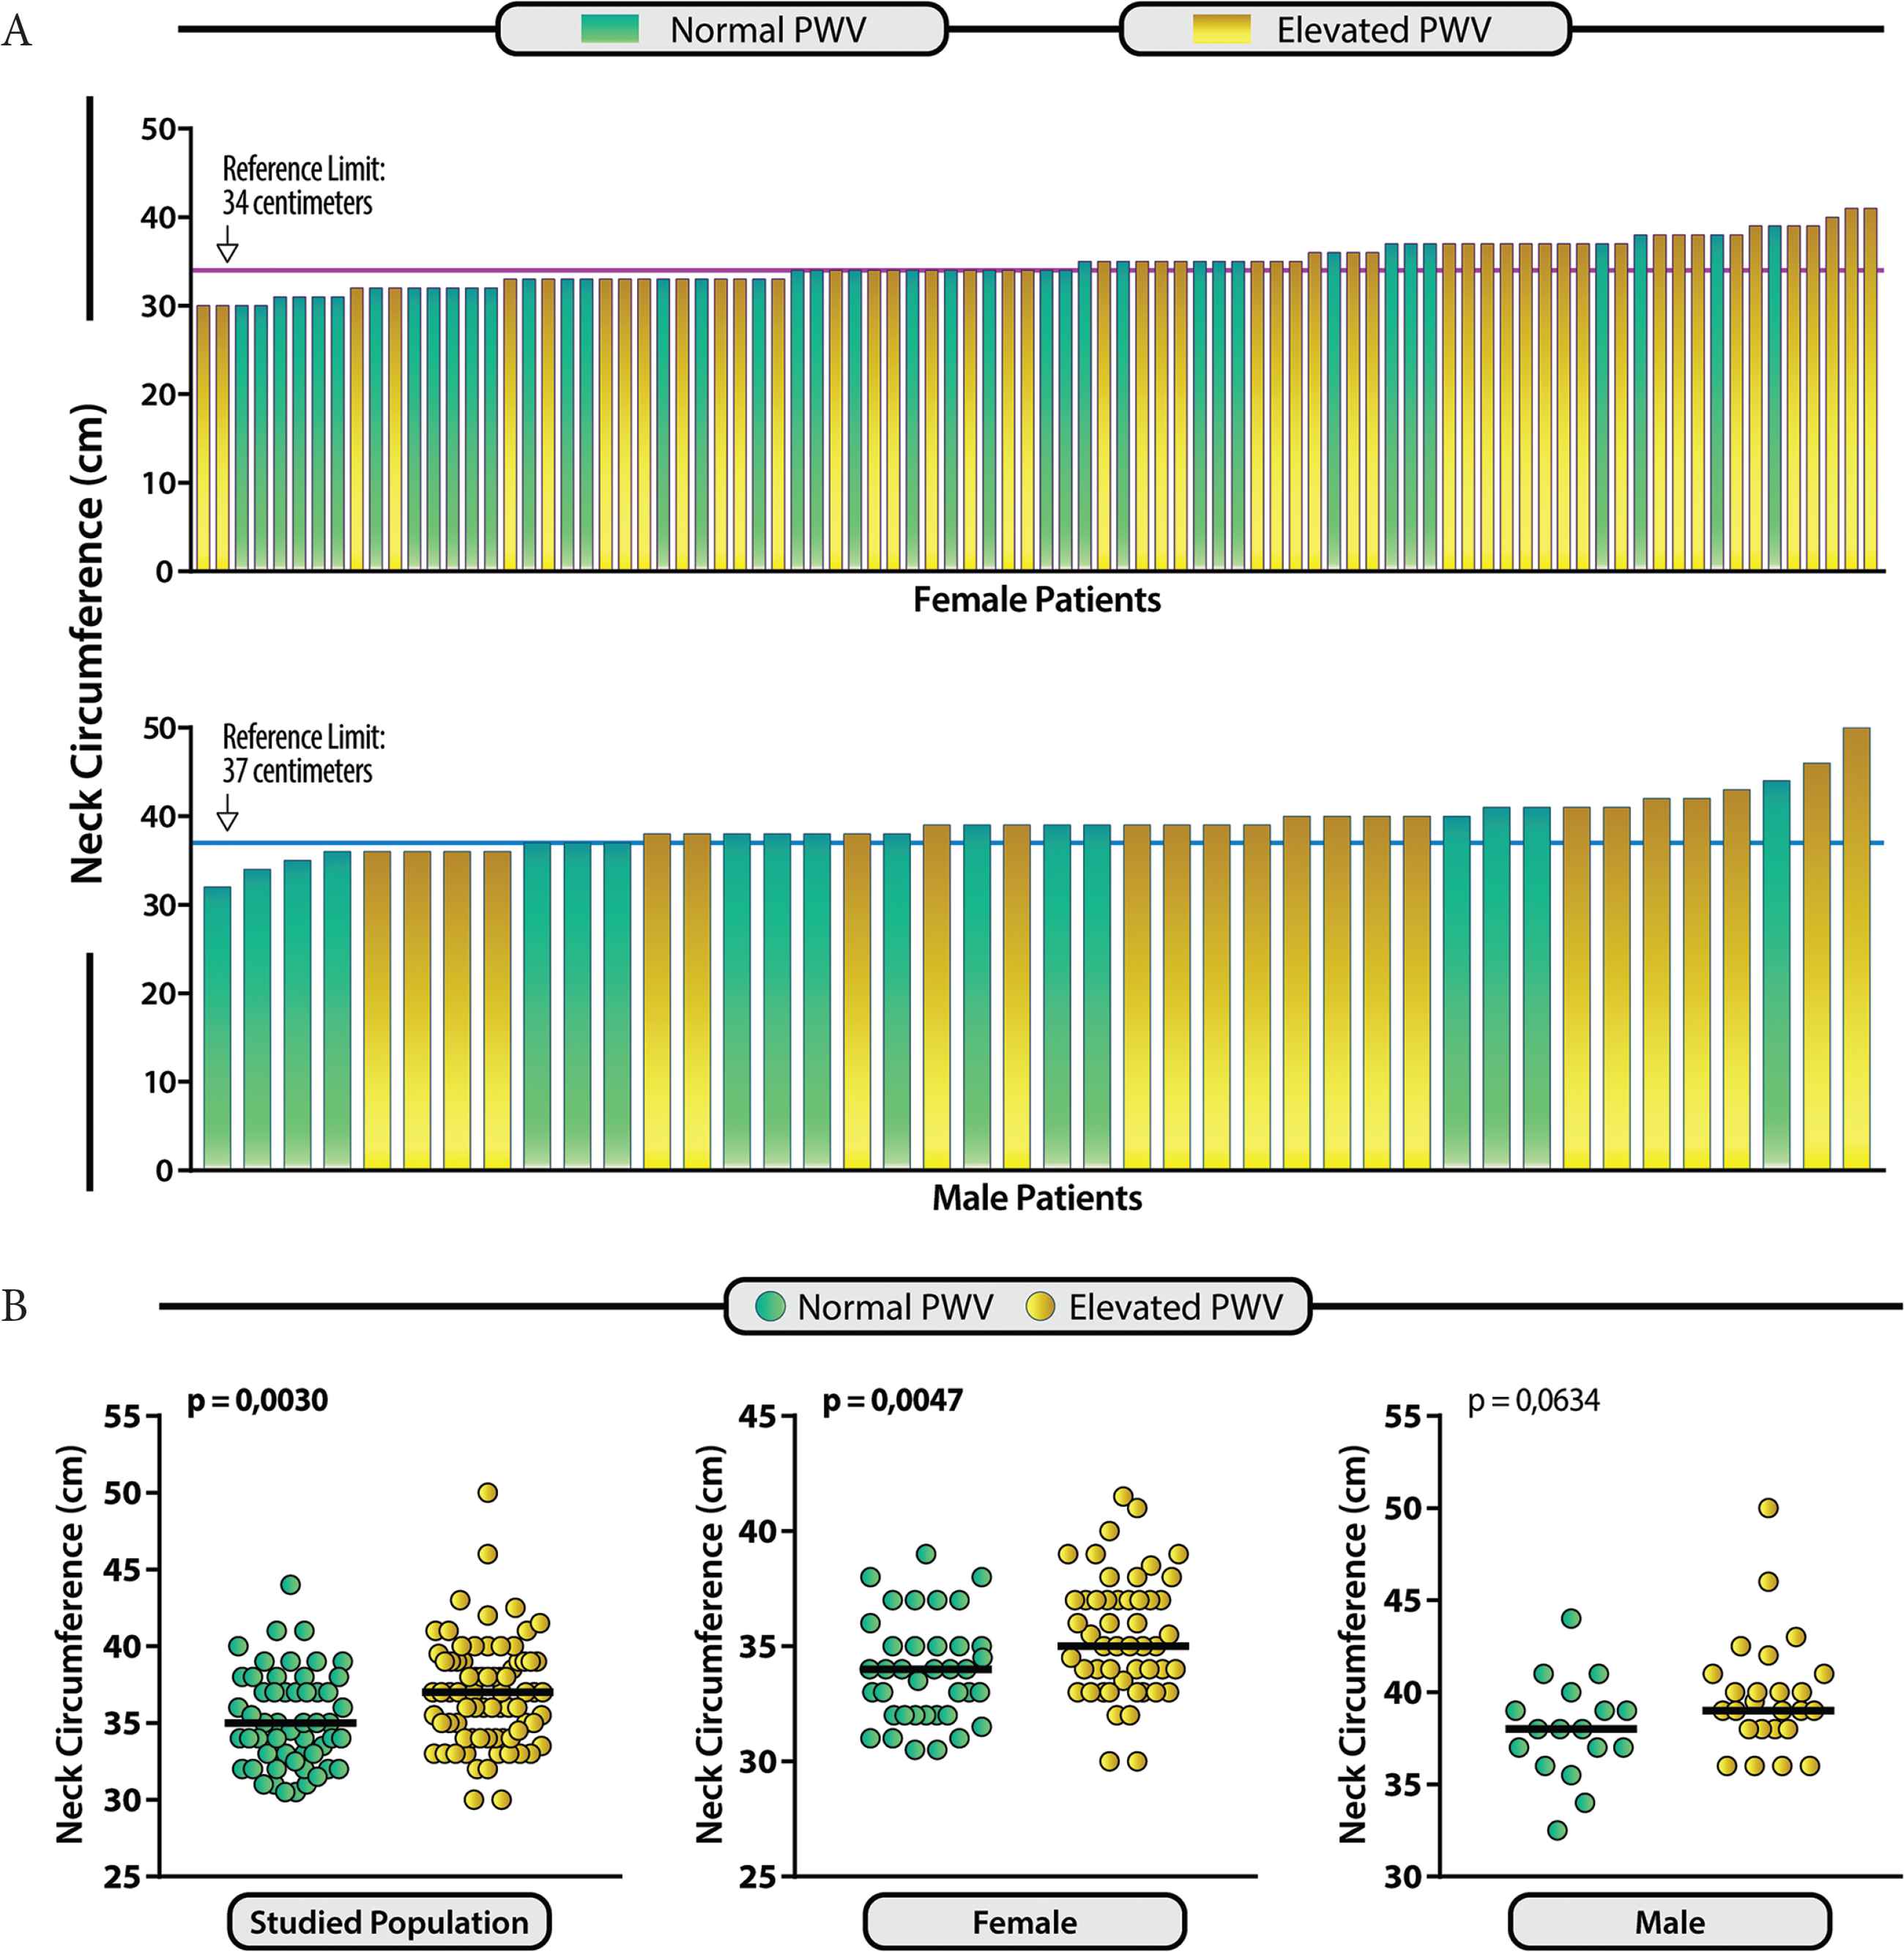
Distribution of patients with Neck Circumference values (NC) and its associations to Pulse Wave Velocity (PWV) status. (A) Histogram representing NC measurements of the 130 studied individuals. The reference limit of the NC values for female (34 cm) and male (37 cm) patients is indicated by the pink and blue are horizontal lines, respectively. The patients are colored accordingly to the PWV status. Patients with normal PWV are represented in green, while patients with elevated PWV are represented in yellow. (B) Scatter-plots of the NC values presented by the studied groups of patients that presented elevated (yellow) or normal (green) PWV. Data analysis was performed using the Mann–Whitney U-test. Bars represent median values
| Variables | PWV (m/s) | p-value | |
|---|---|---|---|
| Normal | Elevated | ||
| N | 56 | 74 | |
| Neck circumference – cm (IQR) | |||
| Studied population | 35 (33–37) | 37 (34–39) | 0.0030 |
| Female | 34 (32–35) | 35 (33.38–37) | 0.0047 |
| Male | 38 (36.5–39.5) | 39 (38–41) | 0.0634 |
Data represents interquartile range. Continuous variables were compared using the Mann–Whitney U-test for neck circumference measurements in groups studied. A p-value below 0.05 was considered statistically significant, and was highlighted in bold.
Neck circumference of the study participants and Pulse Wave Velocity (PWV) status
Moreover, a correlation analysis was also performed between the PWV and NC in the studied population (Figure 4). A positive and significant correlation is observed in the subgroup of female individuals (r = 0.3014; p = 0.0043) and in the general population (r = 0.2662; p = 0.0022). In the subgroup of male patients, a positive yet not statistically significant correlation was found (r = 0.2671; p = 0.0873), which could be justified by the low number of participants and distribution of individuals in this study group.
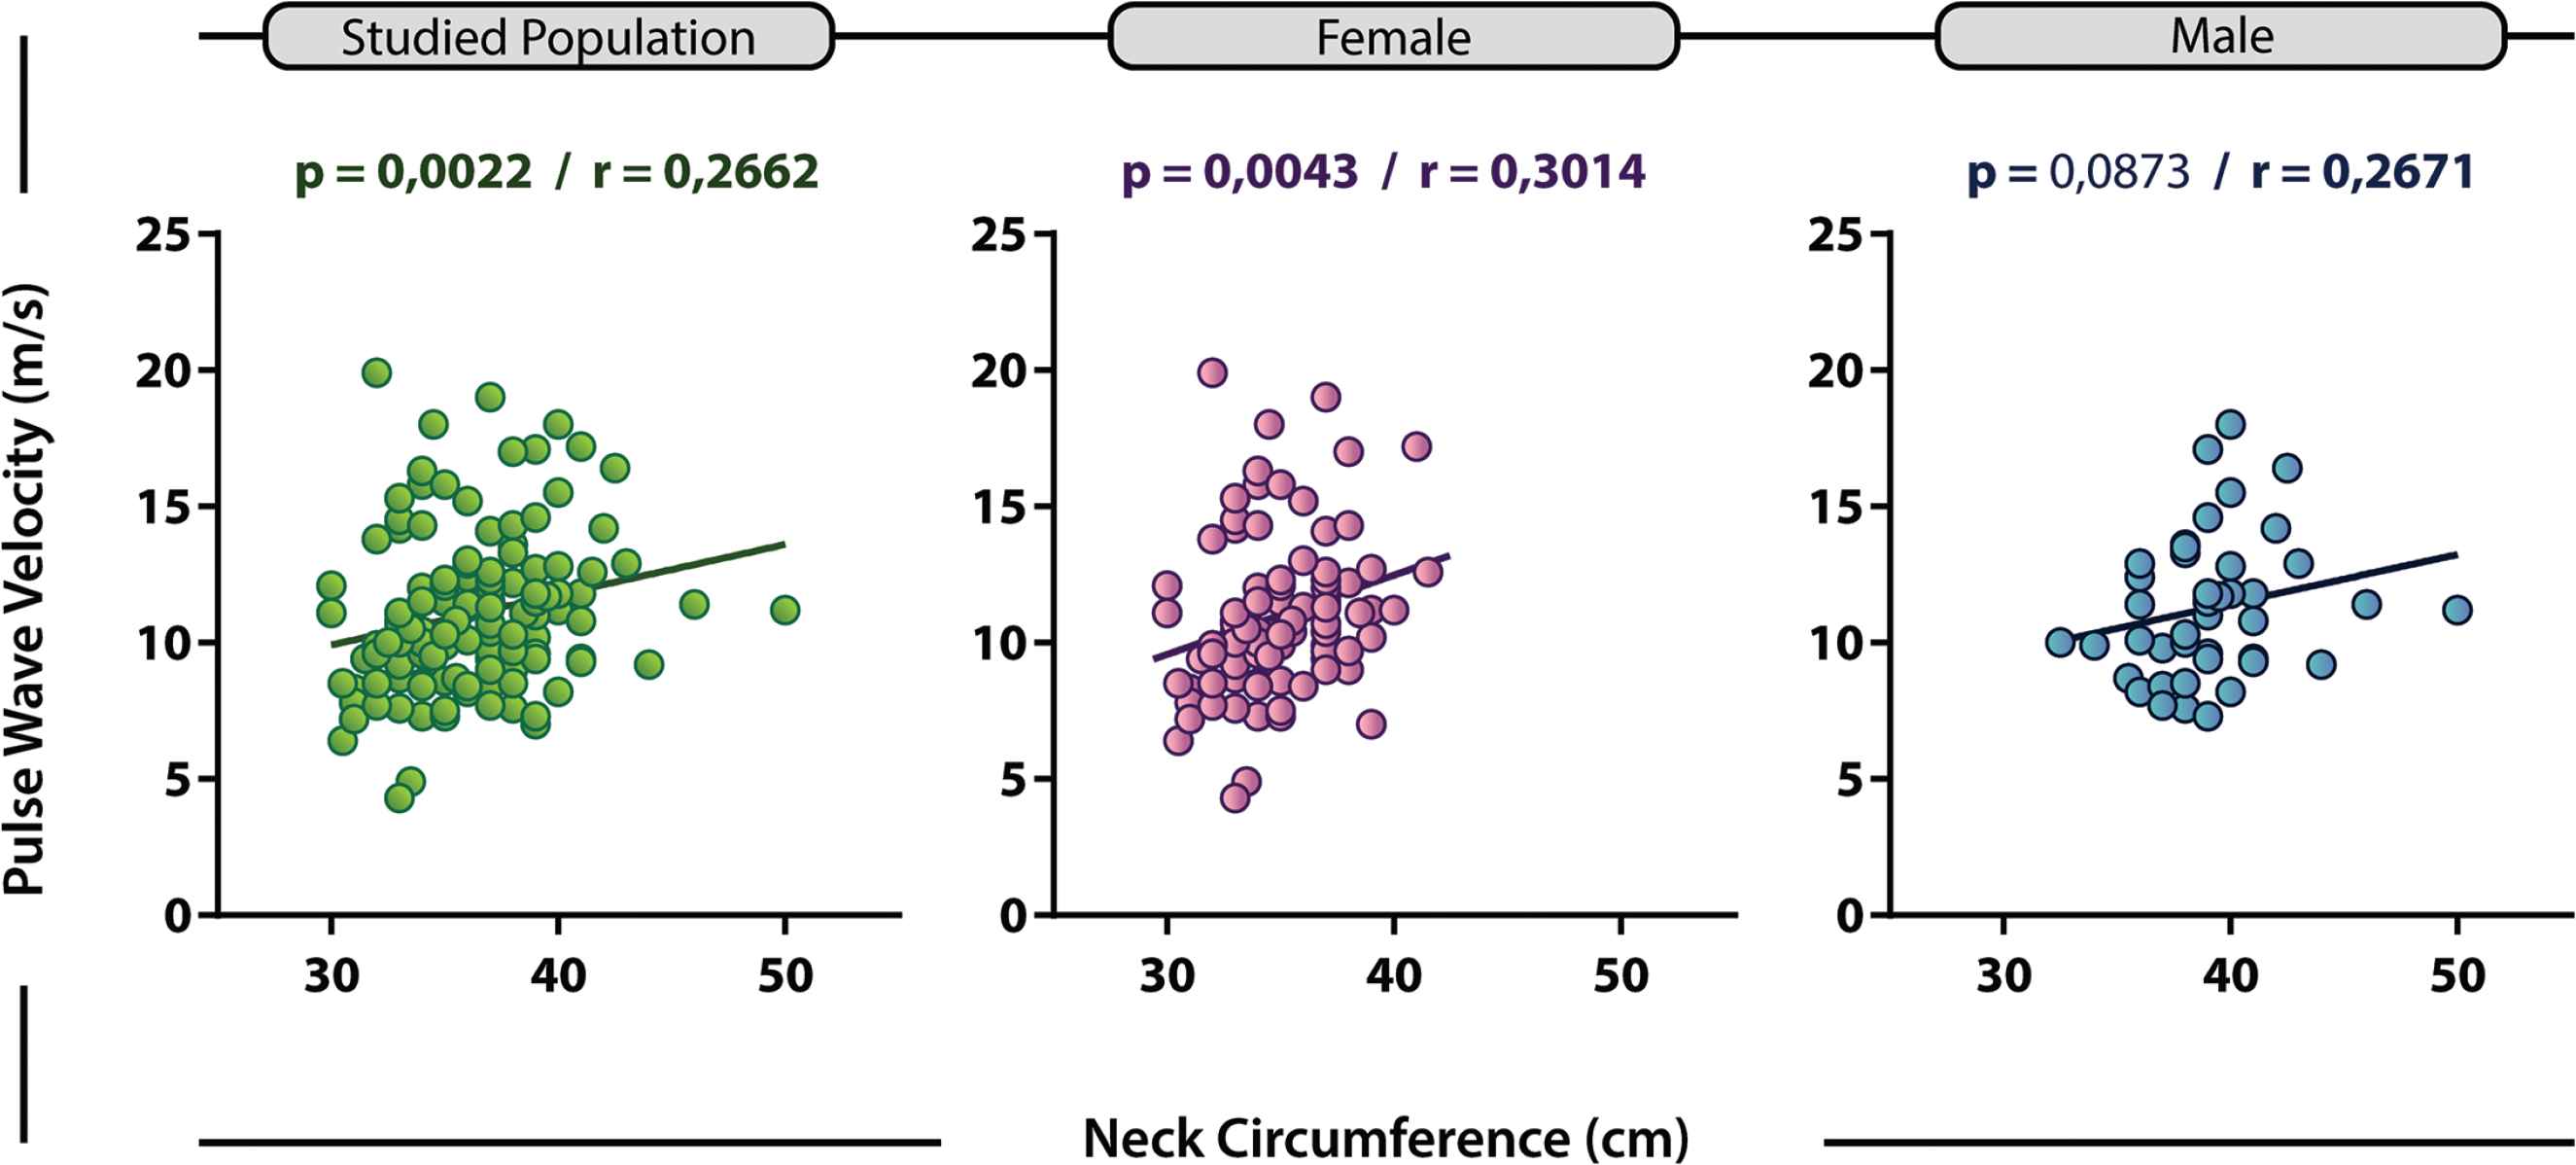
Correlation between Neck Circumference (NC) and Pulse Wave Velocity (PWV). Correlation between NC and PWV variables for studied population (green), female (pink) and male (blue) subgroups. r = Spearman’s correlation coefficient (modular r values ≥0.2 were considered as positive correlations) [23]
4. DISCUSSION
Pulse wave velocity and its importance for early assessment of arterial stiffness in clinical practice have been widely studied [6,8,9,12,20,24]. In this context, the analysis of the carotid-femoral PWV is considered as the gold standard in the estimation of arterial stiffness of an individual [6,7,24]. Some studies even reported the association of PWV with some anthropometric or body composition measurements, such as body mass index (BMI), waist circumference (WC), waist–hip ratio, among others [25–29], as well as with cardiovascular risk factors in different populations [28–33]. However, the associations of PWV status with NC measurements has not been systematically explored, despite the fact that they are both tools which help to identify the chances of cardiovascular events and potentially predict worst outcomes [17,31,32,34]. Moreover, NC and PWV measurements have other important features in common, such as good reproducibility and accuracy, especially when compared to other methods [6,8,13,14,28]. Thus, the association of these two measurements could prove to be relevant for the early evaluation of CVD and its risk factors. Therefore, the present study addresses the relationships between upper body obesity, represented by the assessment of NC, and arterial stiffness, assessed by the PWV analysis between the carotid and femoral arteries.
Stiffening of the artery walls has prognostic implications and is associated with conditions such as Systemic Arterial Hypertension (SAH), Diabetes Mellitus (DM), dyslipidemia and, therefore, Metabolic Syndrome (MS). Furthermore, each of these conditions could be associated with the presentation of a cardiovascular event subsequently [1,8,35]. Cardiovascular diseases are known to be preceded by an asymptomatic period, suggesting the presence of subclinical vascular changes prior to symptom presentation [1,3,6]. In general, several studies reportedly associated SAH, DM and dyslipidemia with subclinical arterial disease, indicated by alteration of arterial wall stiffness, through PWV measurements [7,12,24]. In more recent SAH guidelines, it is recommended the evaluation of some biomarkers for better accuracy in the stratification of cardiovascular risk [6,35]. Among the biomarkers used, the one that reportedly evaluates arterial stiffness with more precision, and thus directs more appropriate conducts in cardiovascular protection, is PWV [11]. In a cohort study of 1980 hypertensive adults, individuals with primary coronary events presented higher PWV values when compared to those without such events [36]. In the present study, a higher number of individuals with elevated PWV (n = 75) was observed, which may suggest higher levels of arterial stiffness and, consequently, increased cardiovascular risk in the studied population (Table 1).
In addition, age and Blood Pressure (BP) were reportedly identified as major determinants of PWV [37]. When age increases, structural and functional changes, characterized by increased stiffness and reduced elastic properties, occur in the arterial walls [7,8,12]. Until the age of 40 years, when such changes usually have not fully developed, the association between age and hypertension becomes less evident, even in the presence of increased arterial stiffness [38]. Thus, in young adults, increased arterial stiffness, assessed by PWV, is likely to be influenced by other factors, such as increased peripheral vascular resistance [39]. Furthermore, other studies have reported associations between PWV and various obesity rates, either with the employment of a broader age range (20–77 years) [25] or with a large young population (up to 36 years old) [40] for the analyses. A higher prevalence of subclinical atherosclerosis was reported in the group of elderly (over 65 years old) subjects in a study of 344 South Korean individuals [41]. In the present study, even though the population is predominantly composed of young patients, there is a significant association between age and PWV status. This was highlighted by the fact that around of 90% of the individuals aged 60 years of older presented altered PWV status, as well as by the shift in the proportions of patients with elevated or normal PWV measurements per age group. These findings reinforce the idea of increased vascular damage and loss of elasticity due to the phenomenon of arterial aging.
In the present study, sex could not determine whether patients would predominantly present elevated PWV or not. The proportions of patients from each sex were extremely similar in the total population, in the group with normal PWV, and in the group with elevated PWV (Table 1). The result of the statistical analysis demonstrates that there was barely no difference between these groups. In addition, there is no sufficient evidence available which could suggest that the sex of the individual interferes in the PWV status.
From a pathophysiological perspective, there are similarities between elevated PWV and higher values of NC, as the metabolic repercussions associated with these changes are, among other factors, due to obesity [7]. In the present study, more than two-thirds of patients with elevated PWV also presented altered NC measurement (Table 1). Interestingly, the total number of patients with higher NC values was similar to those with high PWV (n = 75), representing 57.69% of the general population. Moreover, despite differences in significance found for PWV and NC analyses with regard to educational levels, only one patient was the difference between the frequencies for both of these variables for each subgroup of educational level studied (Supplementary Table 1). It is well reported that poverty (not extreme poverty) have been gradually more associated with obesity and MS in developing countries [1]. Hence, these are interesting and intriguing results, because they could show that decreases in dietary quality and healthy food access influence upper body obesity and arterial stiffness, before and beyond clinical MS conditions.
In fact, changes in NC measurements have been already associated with key factors related to MS and, consequently, increases of the risk of CVD development [13]. Associations between NC and metabolic changes have been described in a population of 264 individuals with type 2 DM in a Turkish report [42]. In the same report, patients identified with MS generally presented NC values around 39 cm for men and 37 cm for women. In the present study, although focused on the assessment of PWV status, similar NC measurements were found for male (39 cm) and female (35 cm) patients with regard to the studied condition (Table 2 and Figure 3B). Furthermore, a large cohort study with 12,151 Chinese patients reported that the higher the NC values, worse are the clinical outcomes, with higher incidence of future fatal or non-fatal cardiovascular events, and increased is the mortality from other causes as well [43]. Therefore, these findings could prove relevant in the field to indicate these reported flagship NC values as good parameters to better assess obesity in this region of the body and, consequently, the risk of CVD (and potentially worse clinical outcomes) in future studies and approaches.
Moreover, the present study demonstrated a positive correlation between NC and PWV, especially in female patients, the main study group (67.69% of the population, Table 1 and Figure 4). However, when men were analyzed separately, the NC values between patients with normal and high PWV (Figure 3B) could not distinguish them, as well as the correlation between NC and PWV (Figure 4) did not achieved statistically significant results. Nevertheless, as there was the aforementioned trend of the same proportion between men and women in each PWV status group (Table 1), it can be inferred that the small number of men in the sample from this study influenced such results. Thus, it could be expected that, with a more representative and, perhaps, similar number of male and female patients, similar results would probably be found for men and women.
Our study presented some limitations, such as the low number of individuals from the studied neighborhood who joined the research. Moreover, the number of men was small when compared to the number of women in the sample, which reduced data accuracy when the subgroup of male patients was included in the analyses. However, despite these limitations, relevant results were still found, such as the predominance of patients with elevated PWV measurements in the studied population (n = 75, Table 1), the most frequent presence of altered NC values in this group (Table 1), and especially the direct positive and significant correlation between these two variables in the main study group. Therefore, the present study contributes to the current knowledge with the demonstration of the relationship between these two easily applicable and important measurements in the detection of cardiovascular risks. Moreover, these results corroborate with the idea that PWV status alteration is related to metabolic changes (and imbalance) associated with NC alterations.
In conclusion, NC and PWV measurements are positively correlated in the main study groups. This fact suggests a possible association of upper body obesity and the impairment of vascular homeostasis, probably due to an increase in arterial wall stiffness. Therefore, the joint use of these two measurements, which help to predict CVD risks and poorer outcomes, could prove relevant in the screening of subclinical vascular perturbations and prognostic delimitation of future cardiovascular events. In addition, a more detailed pathophysiological investigation, as well as broader populational studies and approaches are still needed for better and fully understanding of these events.
CONFLICTS OF INTEREST
The authors declare they have no conflicts of interest.
AUTHORS’ CONTRIBUTION
LRB, LABC, RLSL and LBNCM contributed in study conceptualization and writing (review and editing) the manuscript. LRB, LABC, RLSL, MCLFP, AAOAF, RCAC, ARS, JJOAC, CFSA and DOS contributed in contributed in data curation, formal analysis and writing (original draft). LBNCM, RLSL, and DOS contributed in funding acquisition and project administration. LBNCM and RLSL supervised the project. LRB, LABC, RLSL, MCLFP, CFSA and DOS contributed in formal analysis and writing (original draft) the manuscript.
FUNDING
This research did not receive any specific grant from funding agencies in the public, commercial, or not-for-profit sectors.
SUPPLEMENTARY MATERIAL
Supplementary data related to this article can be found at
Footnotes
REFERENCES
Cite this article
TY  - JOUR
AU  - Larissa Ribeiro Bessa
AU  - Luís Antônio Bahiana Cruz
AU  - Rodrigo Lins Sant’Ana de Lima
AU  - Maria Cristina Lima Fontenele Presta
AU  - Antonio de Assis Oliveira Alves Filho
AU  - Roberta de Castro Araújo Cunha
AU  - Alana dos Reis Silva
AU  - Juan Jailson Oliveira Almeida Costa
AU  - Cecília Freitas da Silva Araújo
AU  - Diorlene Oliveira da Silva
AU  - Lucélia Batista Neves Cunha Magalhães
PY  - 2020
DA  - 2020/03/02
TI  - Correlation between Neck Circumference and Pulse Wave Velocity: A Population-based Study
JO  - Artery Research
SP  - 48
EP  - 55
VL  - 26
IS  - 1
SN  - 1876-4401
UR  - https://doi.org/10.2991/artres.k.200225.001
DO  - 10.2991/artres.k.200225.001
ID  - Bessa2020
ER  -