
Validation of a Method to Estimate Stroke Volume from Brachial-cuff Derived Pressure Waveforms
- DOI
- 10.2991/artres.k.200223.001How to use a DOI?
- Keywords
- Stroke volume; validation study; hemodynamic model
- Abstract
Background: Steady state hemodynamics [Stroke Volume - SV, cardiac output, peripheral resistance (Rp)] have attracted researchers in hypertension for decades. However, due to technical difficulties, they never entered clinical medicine.
Objective: To investigate the performance of a model-based algorithm, utilizing brachial pressure waveforms obtained with a cuff, to estimate stroke volume. The model combines a modified three-element like Windkessel system and transmission line theory.
Participants and Methods: In study 1, 97 patients with reperfused acute myocardial infarction and two healthy controls underwent cardiac magnetic resonance imaging (1.5 Tesla Magnetom, Siemens, Germany), and SV was measured with standard protocols from short axis cine images (11 slices). In study 2, 19 healthy individuals (12 females) had SVs measured with inert gas rebreathing at rest, and during light exercise (20 watts) on a bicycle ergometer. In both studies, model-based SV, estimated with a brachial cuff, was the comparator.
Results: In study 1, both SVs were moderately correlated (r = 0.54, p < 0.001). Using the method of Bland–Altman, mean difference between both methods was 8.7 ml (1.96 limits of agreement were 36.7 and –19.3 ml), with no systematic bias. In study 2, both SVs were moderately correlated at rest (r = 0.63, p = 0.004) and at light exercise (r = 0.70, p = 0.0057). Using the method of Bland–Altman, mean difference between both methods was 8.6 ml (1.96 limits of agreement were 39.2 and –22.0 ml) at rest, and 42.7 ml (1.96 limits of agreement were 95.4 and –10.1 ml) at light exercise.
Conclusion: Brachial oscillometry and mathematical modeling provide a reasonable estimate of SV under static conditions, which may be a useful addition to 24-h measurements of blood pressure and pulsatile hemodynamics.
- Copyright
- © 2020 Association for Research into Arterial Structure and Physiology. Publishing services by Atlantis Press International B.V.
- Open Access
- This is an open access article distributed under the CC BY-NC 4.0 license (http://creativecommons.org/licenses/by-nc/4.0/).
1. INTRODUCTION
The hemodynamic basis of elevated Blood Pressure (BP) has attracted researchers for more than 50 years [1]. Despite increasing interest in the pulsatile components of BP (arterial stiffness, wave reflections) in recent years [2], the steady state component of the circulation, expressed by the relationship Cardiac Output (CO) = Mean Arterial Pressure (MAP)/Total Peripheral Resistance (TPR), is still of considerable interest in hypertension research [3,4], for instance for phenotyping hypertensives with regard to CO and TPR [3,4]. However, in contrast to cardiology and intensive care medicine, where CO and TPR are routinely assessed invasively and non-invasively, brachial BP remains the only hemodynamic measure discussed in hypertension guidelines [5] and used in clinical routine.
The obvious reason is the lack of easy-to-use and reliable non-invasive devices for assessment of more advanced hemodynamics. Whereas MAP can be precisely measured with Oscillometric (OSC) blood pressure monitors [6,7], the critical parameter is Stroke Volume (SV), one of the two determinants of CO (CO = heart rate × SV). Although SV can be assessed invasively (thermodilution or pulse contour analysis) and non-invasively (echocardiography, cardiac Magnetic Resonance Imaging - MRI, Inert Gas Rebreathing - IGR, impedance cardiography) with a wide array of methods [8], none of them can be used in primary care, and none of them is suitable for ambulatory 24 h monitoring.
Combining a modified three-element like Windkessel system and transmission line theory, we recently developed a model to estimate SV, based on BP curves. The aim of this study was to compare this model-based SV estimate to SV assessed with different gold standard methods, including MRI and inert gas rebreathing.
2. PARTICIPANTS AND METHODS
2.1. Study Populations
2.1.1. Study 1
From August 2013 to February 2015, acute ST elevation myocardial infarction patients presenting within 24 h after symptom onset and undergoing successful reperfusion by primary percutaneous coronary intervention at the University Hospital of Innsbruck were consecutively screened for study inclusion. Exclusion criteria were age below 18 years, history of previous myocardial infarction, angiographically proven coronary artery disease prior to the index event, Killip class >2 at presentation, estimated glomerular filtration rate <30 ml/min per 1.73 m2 and contraindications for MRI (e.g. claustrophobia, pacemaker and orbital foreign body). In addition, two healthy controls were also included. The present study was performed in conformity with the ethical guidelines of the 1975 Declaration of Helsinki. All patients gave written informed consent before inclusion in the study. The study was approved by the Local Ethics Committee.
2.1.2. Study 2
The study population comprised 19 apparently healthy individuals, recruited from the community and investigated at the Division of Experimental Medicine and Immunotherapeutics, Department of Medicine, University of Cambridge, UK. All individuals were free of overt cardiovascular disease and medications. Local research Ethics Committee approval was obtained and all individuals gave written informed consent.
2.2. Blood Pressure Measurement and Acquisition of Waveforms
Brachial BP was measured with the validated [9] OSC mobilograph® (IEM, Stolberg, Germany) device. The cuff of the device is equipped with a high-fidelity pressure sensor (MPX5050, Freescale Inc., Tempe, AZ, USA). Following BP measurement, pulse waves were recorded, using the brachial cuff, at DBP level for at least 10 s. After digitalization, a two-step quality control algorithm was applied. In a first step, the single pressure waves were verified for their plausibility by testing the position of minima and the corresponding wavelengths. Minima were detected by means of an iterative procedure evaluating higher order time derivatives of the pressure signal. During the second stage, all of the single pressure waves were compared with each other to recognize artifacts.
2.3. Model-based Determination of Stroke Volume
For stroke volume estimation, we used an adopted Windkessel (WK) model, which is well established to estimate arterial properties. Our method describes the outflow of the left ventricle during systole based on an externally provided central pressure waveform similar to a three-element Windkessel model by the means of a dynamic system of second order. We propose a linear model with continuous parameter space for arterial resistance (RC), peripheral resistance (Rp) and arterial compliance (Ca). A fully mathematical description is given elsewhere [10] but to summarize the three steps: the equations for RC, Rp and Ca, are supposed to be formulated as an isoperimetric problem with a constraint to minimize external work. Calculus of variation and application of Lagrange formalism results in a linear inhomogeneous second-order system, which can be solved adequately. Numerical parameter values for RC, Rp and Ca are then obtained by the method of pressure waveform area fitting using the Levenberg–Marquardt method. By substitution of these parameters in the WK formula, SV can be determined.
2.4. Comparator Methods to Assess Stroke Volume
In study 1, on average 3 days after the acute event, SV was measured during cardiac MRI (1.5 Tesla Magnetom, Siemens, Germany) with standard protocols from short axis cine images (11 slices) [11]. Images were acquired using breath hold, retrospective ECG triggered TrueFISP bright blood sequences, and evaluated with standard software (ARGUS, Siemens, Erlangen, Germany).
In study 2, SV and CO were assessed using a non-invasive, IGR device (Innocor®, Innovision A/S, Denmark) [12] which has previously been validated against thermodilution and direct Fick methods [13]. In brief, subjects continuously rebreathed a gas mixture (1% SF6, 5% N2O, and 94% O2) over 20 s, with a breathing rate of 20 breaths/min. Expired gases were sampled continuously and analyzed by an infra-red photoacoustic gas analyzer, for the determination of CO and SV.
2.5. Study Protocols and Timing of Waveform Acquisition
In study 1, measurement with the OSC device was not possible simultaneously to cardiac MRI for obvious reasons. Measurements were performed at a median of 48 h (interquartile range 27–63 h) after infarction, with most patients still at the cardiac care unit (after the infarction), therefore in a resting state and in the supine position. Five separate measurements were performed over a period of 1 h. For statistical analysis, the mean SV value of all five measurements was used [14].
In study 2, assessments of SV and CO were made sequentially with the IGR device, followed immediately by the mobilograph device, both at rest and during exercise. Readings were made sequentially, rather than simultaneously, to prevent any interference from the IGR manoeuvre on mobilograph readings. Following 5 min of seated rest on an upright cycle ergometer, a single IGR manoeuvre was performed, followed by a single reading of brachial BP and recording of brachial pulse waveforms. Following the baseline recordings, subjects commenced cycling at 35 rpm, corresponding to 20 watts. After 4 min of cycling, by which time a steady-state had been achieved, the IGR manoeuvre was repeated and brachial BP and pulse waveforms recorded again.
2.6. Statistics
All of the measurements are presented as mean ± 1 SD. The correlation between variables was calculated using Pearson’s correlation coefficient. Furthermore, data were analyzed using the method presented by Bland and Altman [15]. For the analysis, the statistical software MedCalc 11.5 (MedCalc software, Mariakerke, Belgium) was used.
3. RESULTS
3.1. Study 1
Baseline characteristics of the study population are shown in Table 1. Briefly, mean age was 56.8 years (SD 10.5), 21.2% were women, mean EF 54% (SD 9.3, range 28–76%). Mean SV (MRI) was 76.0 ml (SD 16.3 ml). Mean SV (OSC) was 67.2 ml (SD 12.9 ml). Both SVs were moderately correlated (r = 0.54, p <0.001; Figure 1). Using the method of Bland–Altman, mean difference between both methods was 8.7 ml (1.96 limits of agreement were 36.7 and –19.3 ml), with no systematic bias (Figure 2).
| Age (years) | 56.8 (10.5) |
| Females, n (%) | 21 (21.2) |
| Smoking, n (%) | 56 (56.6) |
| Hypertension, n (%) | 47 (47.5) |
| Diabetes, n (%) | 11 (11.1) |
| Height (cm) | 173.8 (8.4) |
| Weight (kg) | 81.2 (12.3) |
| Body mass index (kg/m2) | 26.8 (3.5) |
| Systolic blood pressure (mmHg) | 122 (21) |
| Diastolic blood pressure (mmHg) | 77 (15) |
| Heart rate (bpm) | 72 (12) |
| Troponin Tmax (pg/ml)* | 6383 (7176) |
| Ejection fraction (MRI) | 54.4 (9.3) |
| Cardiac output (MRI) (l/min) | 5.4 (1.0) |
| Stroke volume (MRI) (ml) | 76.0 (16.3) |
| Stroke volume (OSC) (ml) | 67.2 (12.9) |
In 97 patients with myocardial infarction. MRI, magnetic resonance imaging; OSC, oscillometric method.
Baseline characteristics in study 1
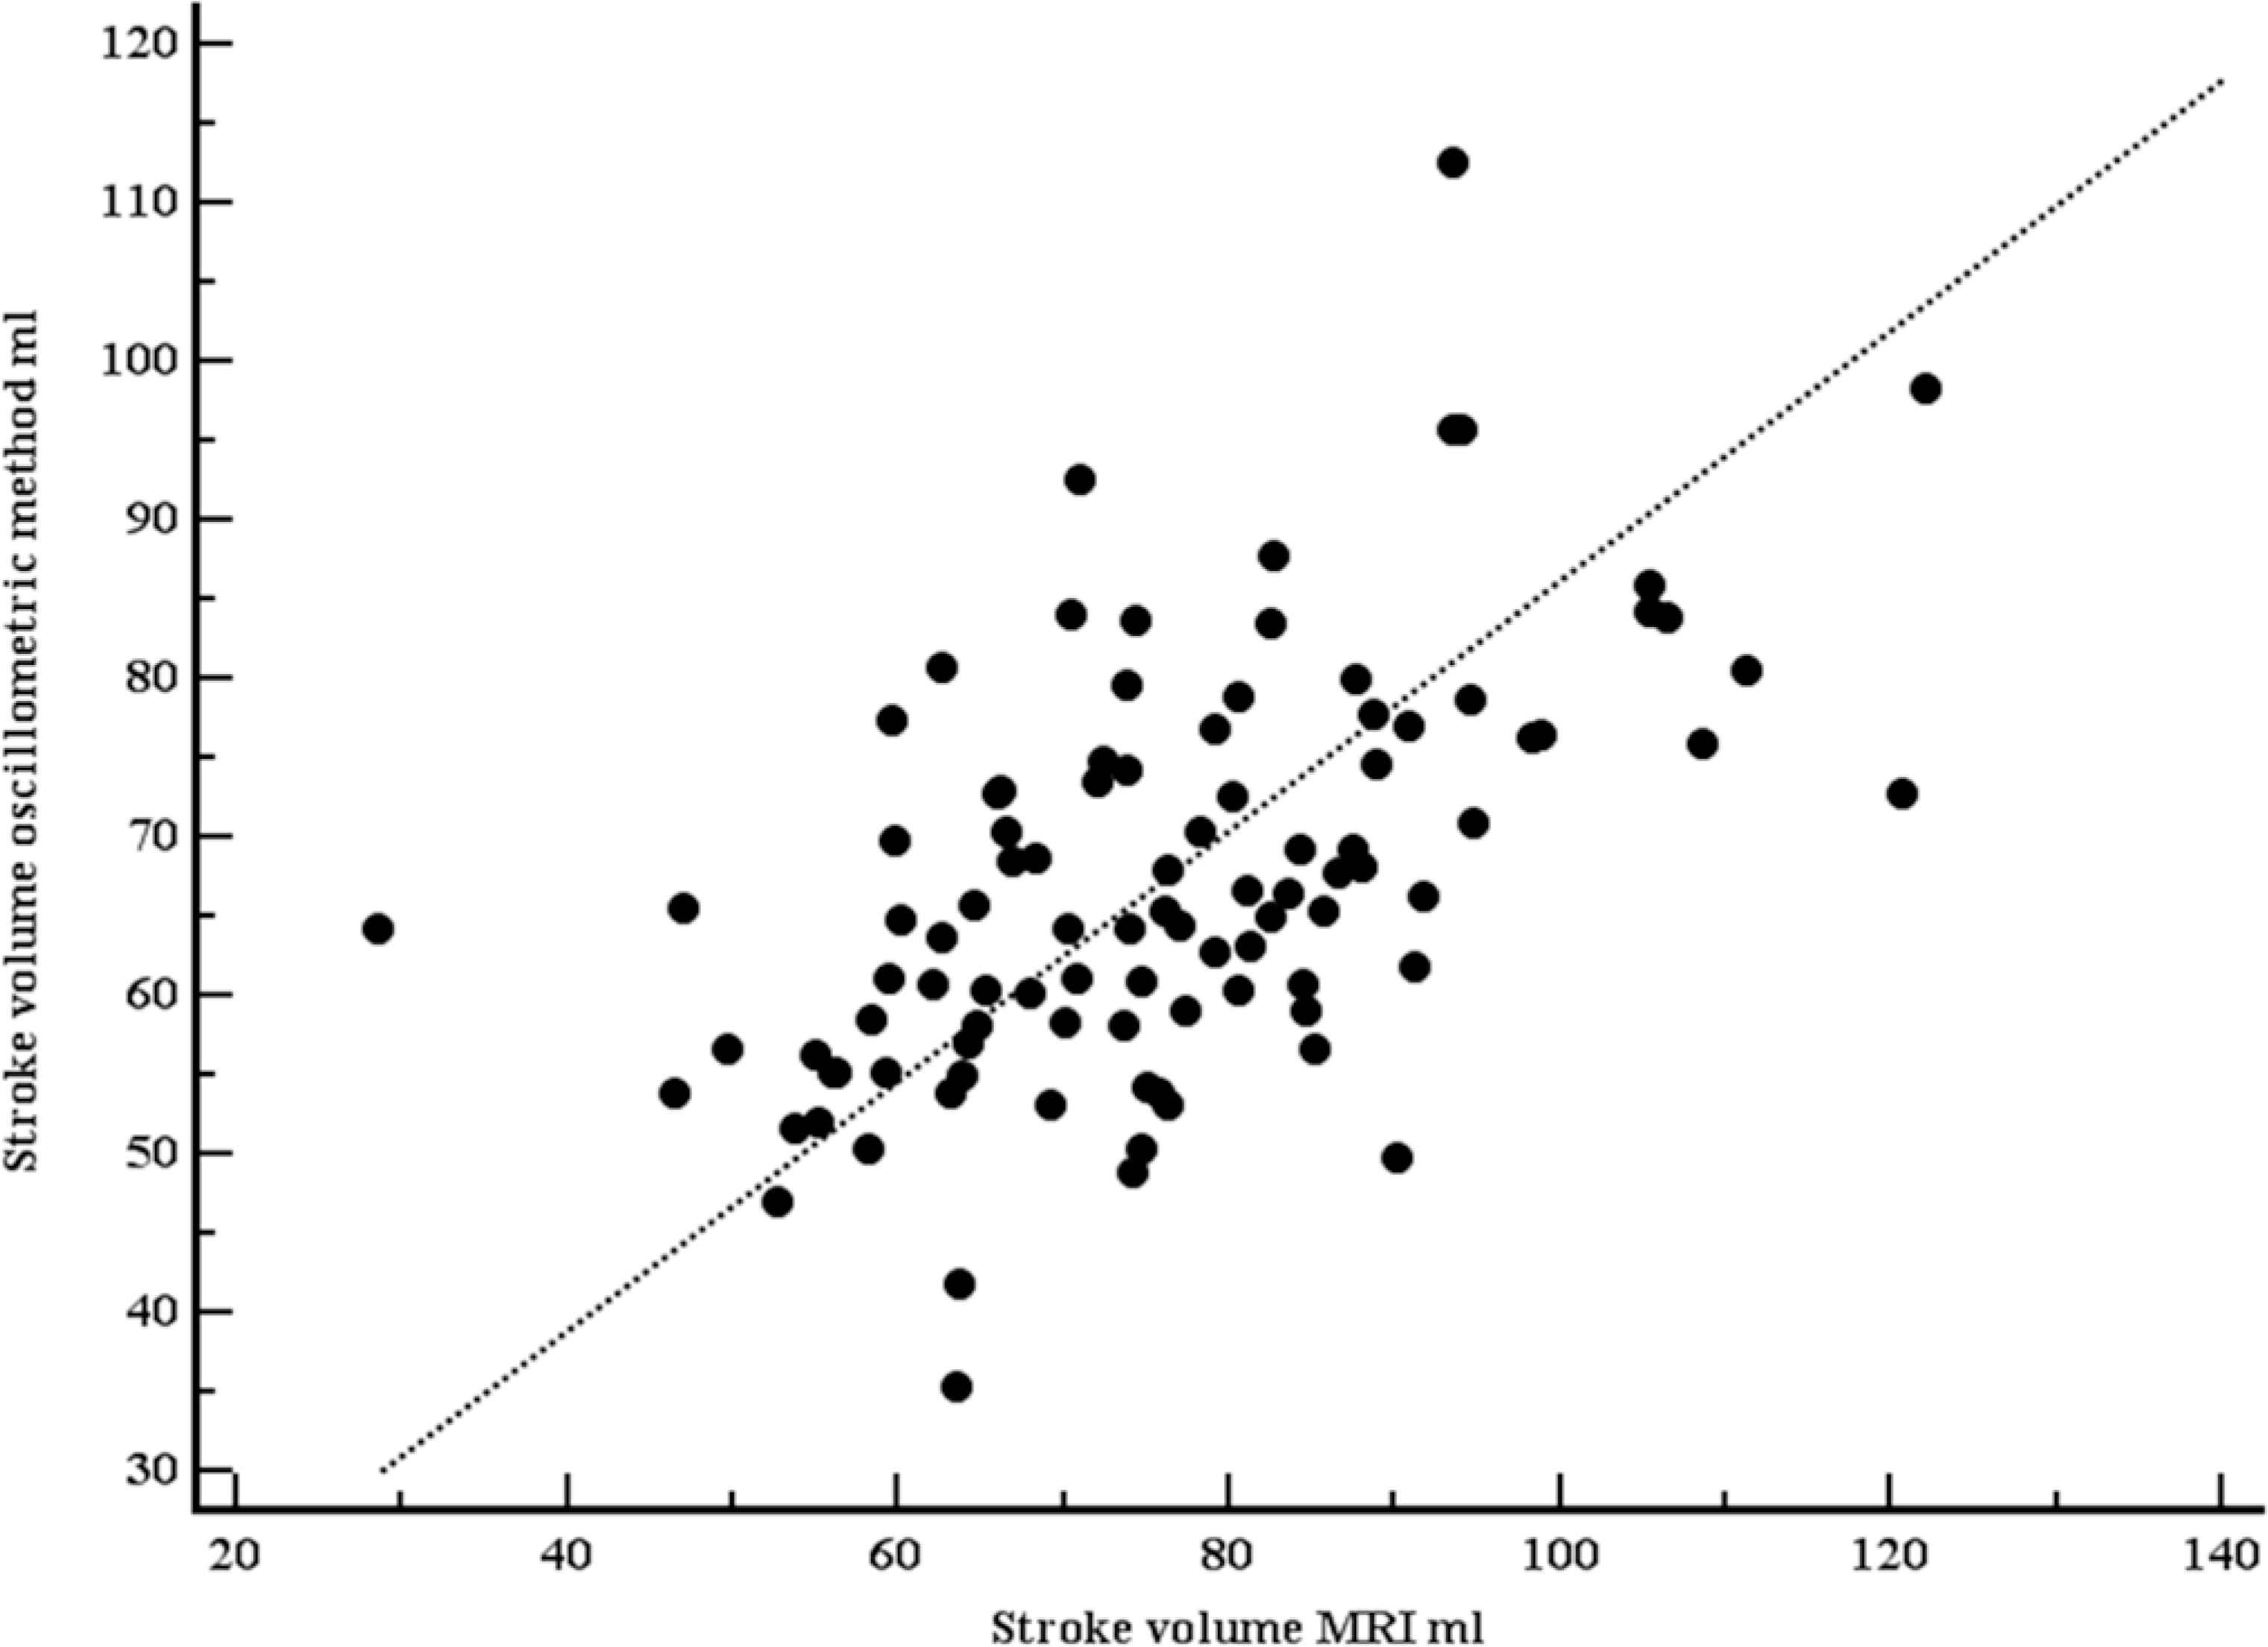
Scatter plot with line of equality comparing stroke volumes, measured with Magnetic Resonance Imaging (MRI), and estimated with the oscillometric device. Both stroke volumes were moderately correlated (r = 0.54, p <0.001).
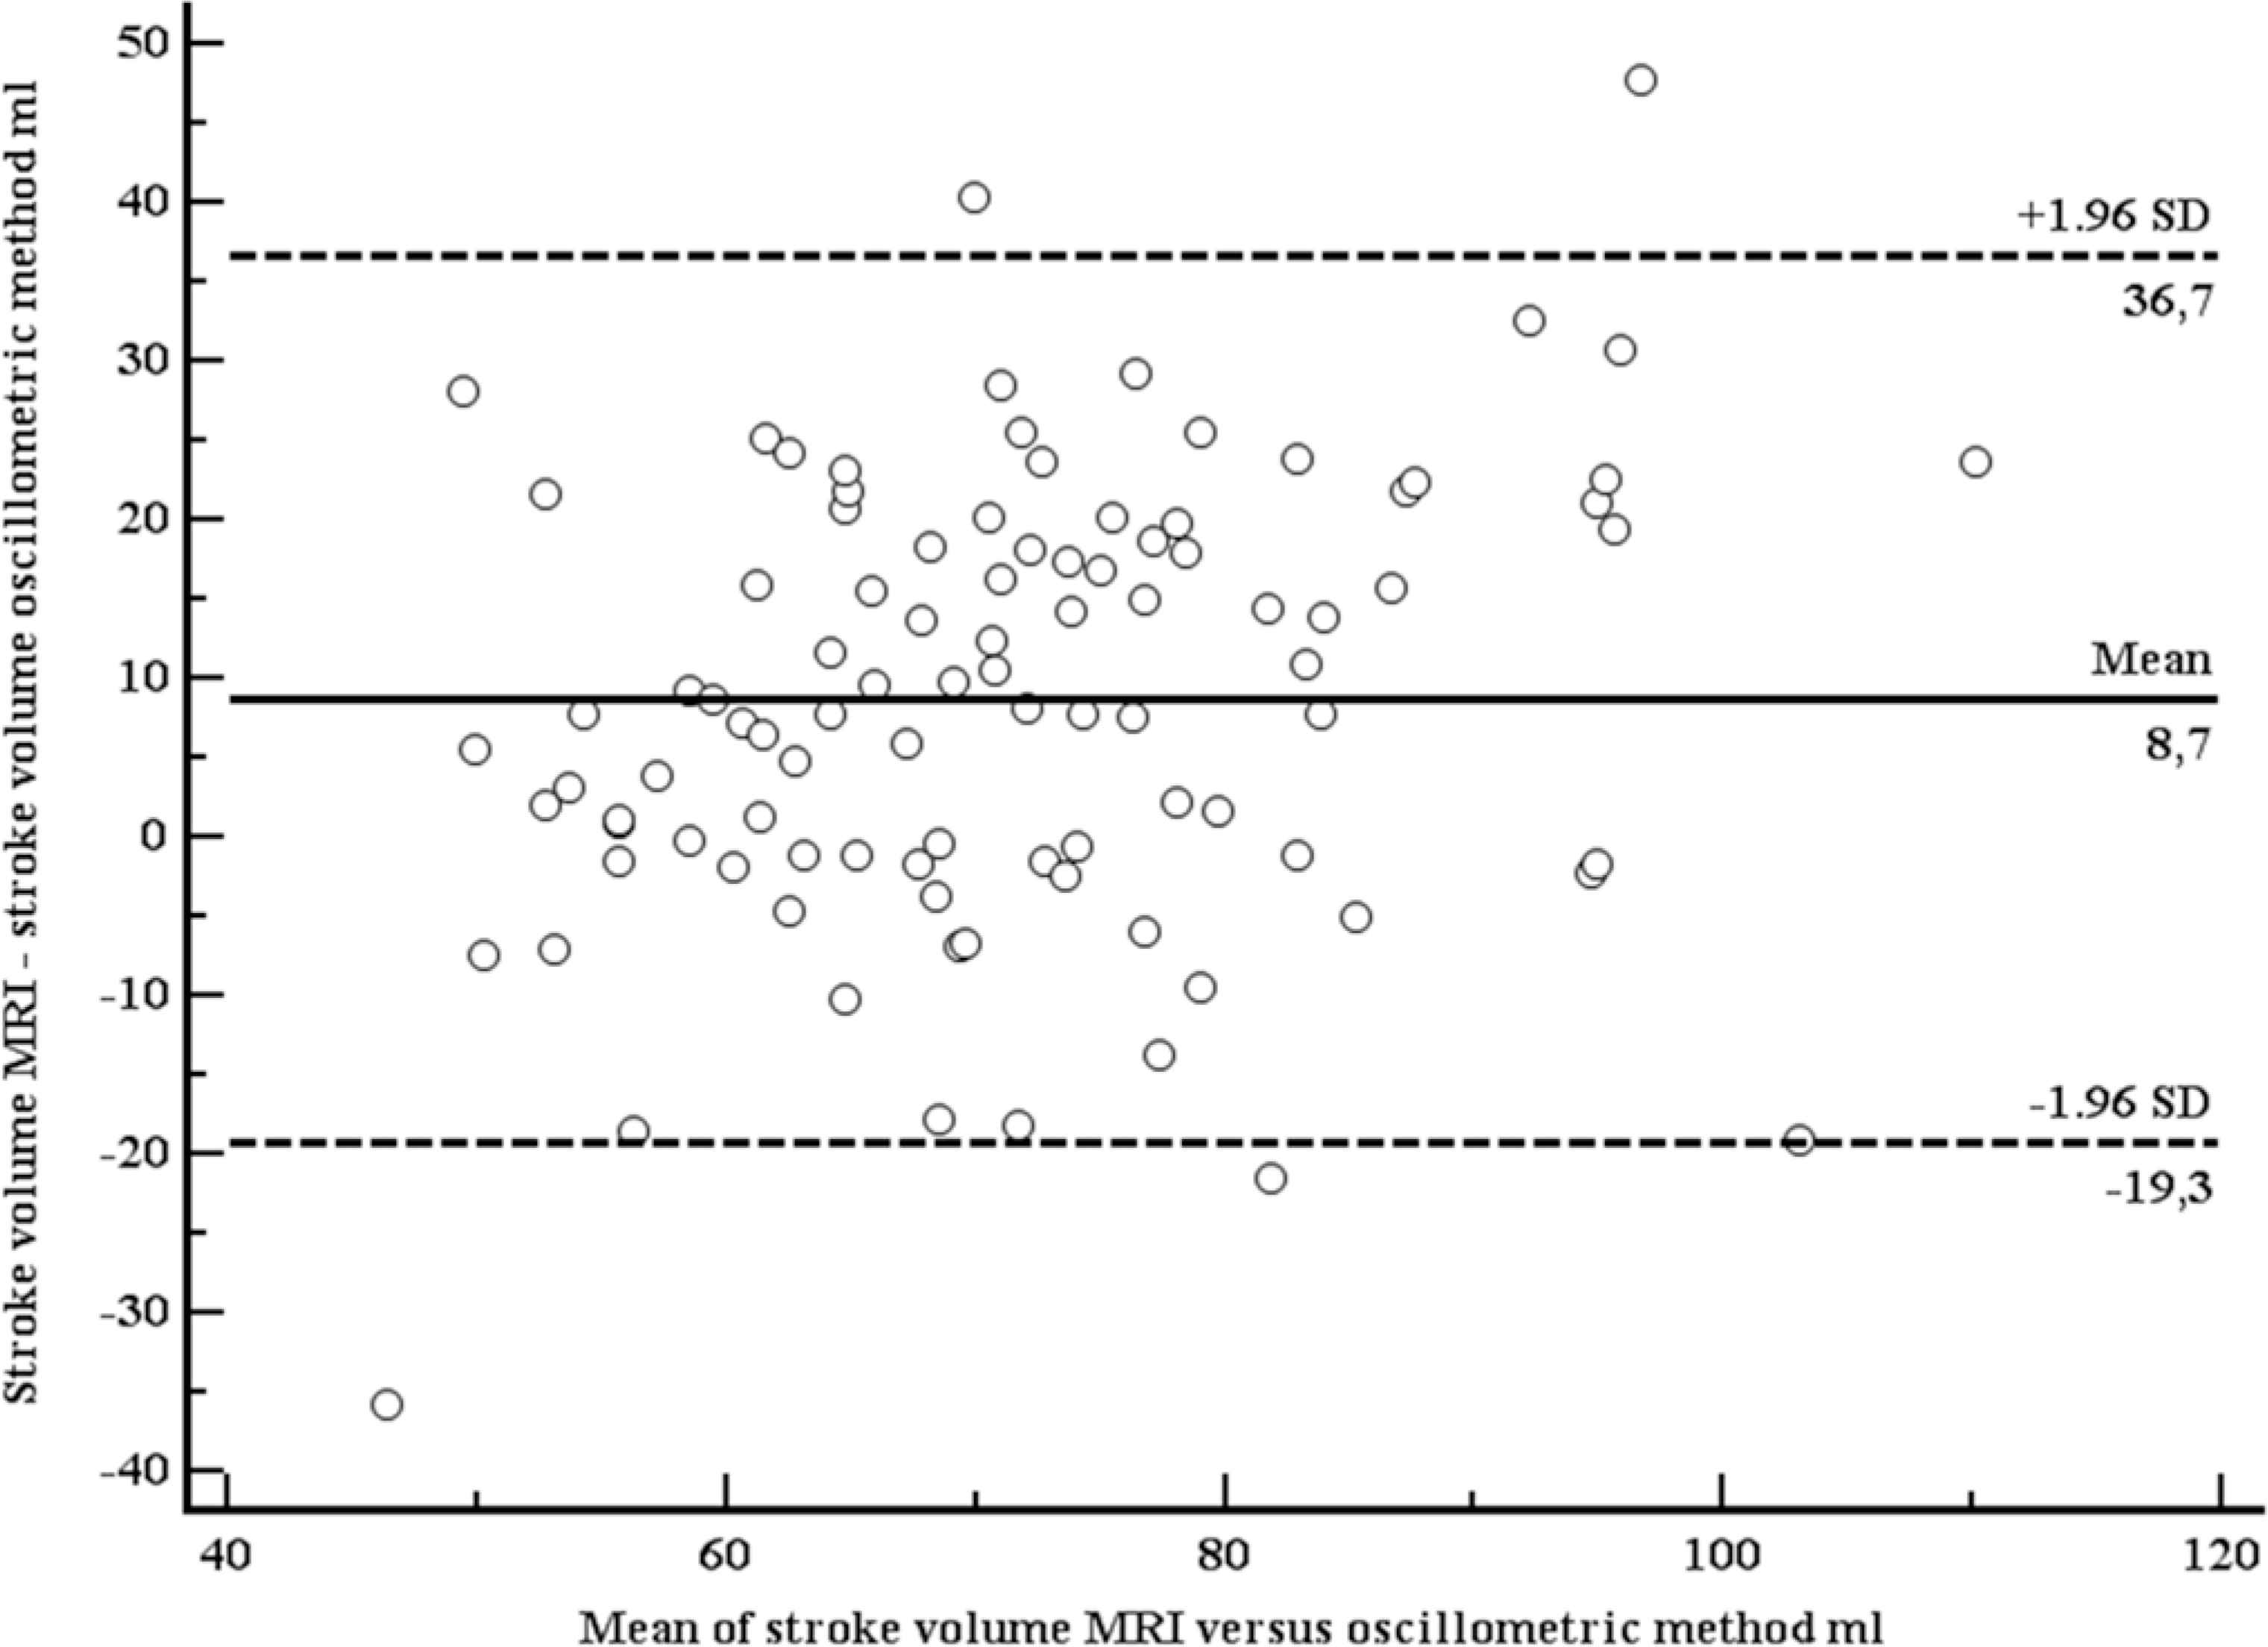
Bland–Altman plot comparing stroke volumes, measured with Magnetic Resonance Imaging (MRI), and estimated with the oscillometric device.
3.2. Study 2
A total of 19 apparently healthy individuals (12 women) were included (Table 2). Mean age was 35.5 years (SD 8.4 years), mean body mass index 24.4 kg/m2 (SD 3.4 kg/m2). At rest, mean SV (IGR) was 65.5 ml (SD 19.9 ml), mean SV (OSC) was 56.9 ml (SD 10.5 ml). Both SVs were moderately correlated (r = 0.63, p = 0.004; Figure 3). Using the method of Bland–Altman, mean difference between both methods was 8.6 ml (1.96 limits of agreement were 39.2 and –22.0 ml), with no systematic bias (Figure 4). At light exercise (35 rpm, 20 watts), no OSC estimate for SV could be provided by the OSC device in five participants. SV increased when measured with IGR (94.8, SD 31.4 ml), but did not increase when measured with OSC (52.1, SD 7.2 ml). Again, both SVs were moderately correlated (r = 0.70, p = 0.0057; Figure 5) using the method of Bland–Altman, SV (OSC) underestimated SV (IGR). Mean difference between both methods was 42.7 ml (1.96 limits of agreement were 95.4 and –10.1 ml), with a systematic bias of a larger amount of underestimation with larger SVs (Figure 6).
| Age (years) | 35.5 (8.4) |
| Females, n (%) | 12 (60) |
| Height (cm) | 172.9 (11.4) |
| Weight (kg) | 73.4 (14.2) |
| Body mass index (kg/m2) | 24.4 (3.4) |
| Systolic blood pressure @ rest (mmHg) | 123 (17) |
| Diastolic blood pressure @ rest (mmHg) | 79 (10) |
| Heart rate @ rest (bpm) | 71 (13) |
| Stroke volume @ rest (IGR) (ml) | 65.5 (19.9) |
| Stroke volume @ rest (OSC) (ml) | 56.9 (10.5) |
| Systolic blood pressure @ 35 rpm (mmHg*) | 125 (12) |
| Diastolic blood pressure @ 35 rpm (mmHg*) | 77 (12) |
| Heart rate @ 35 rpm (bpm*) | 83 (12) |
| Stroke volume @ 35 rpm (IGR) (ml*) | 94.8 (31.4) |
| Stroke volume @ 35 rpm (OSC) (ml*) | 52.1 (7.2) |
In 14 patients with sufficient OSC measurements. IGR, inert gas rebreathing; OSC, oscillometric method.
Baseline characteristics in study 1
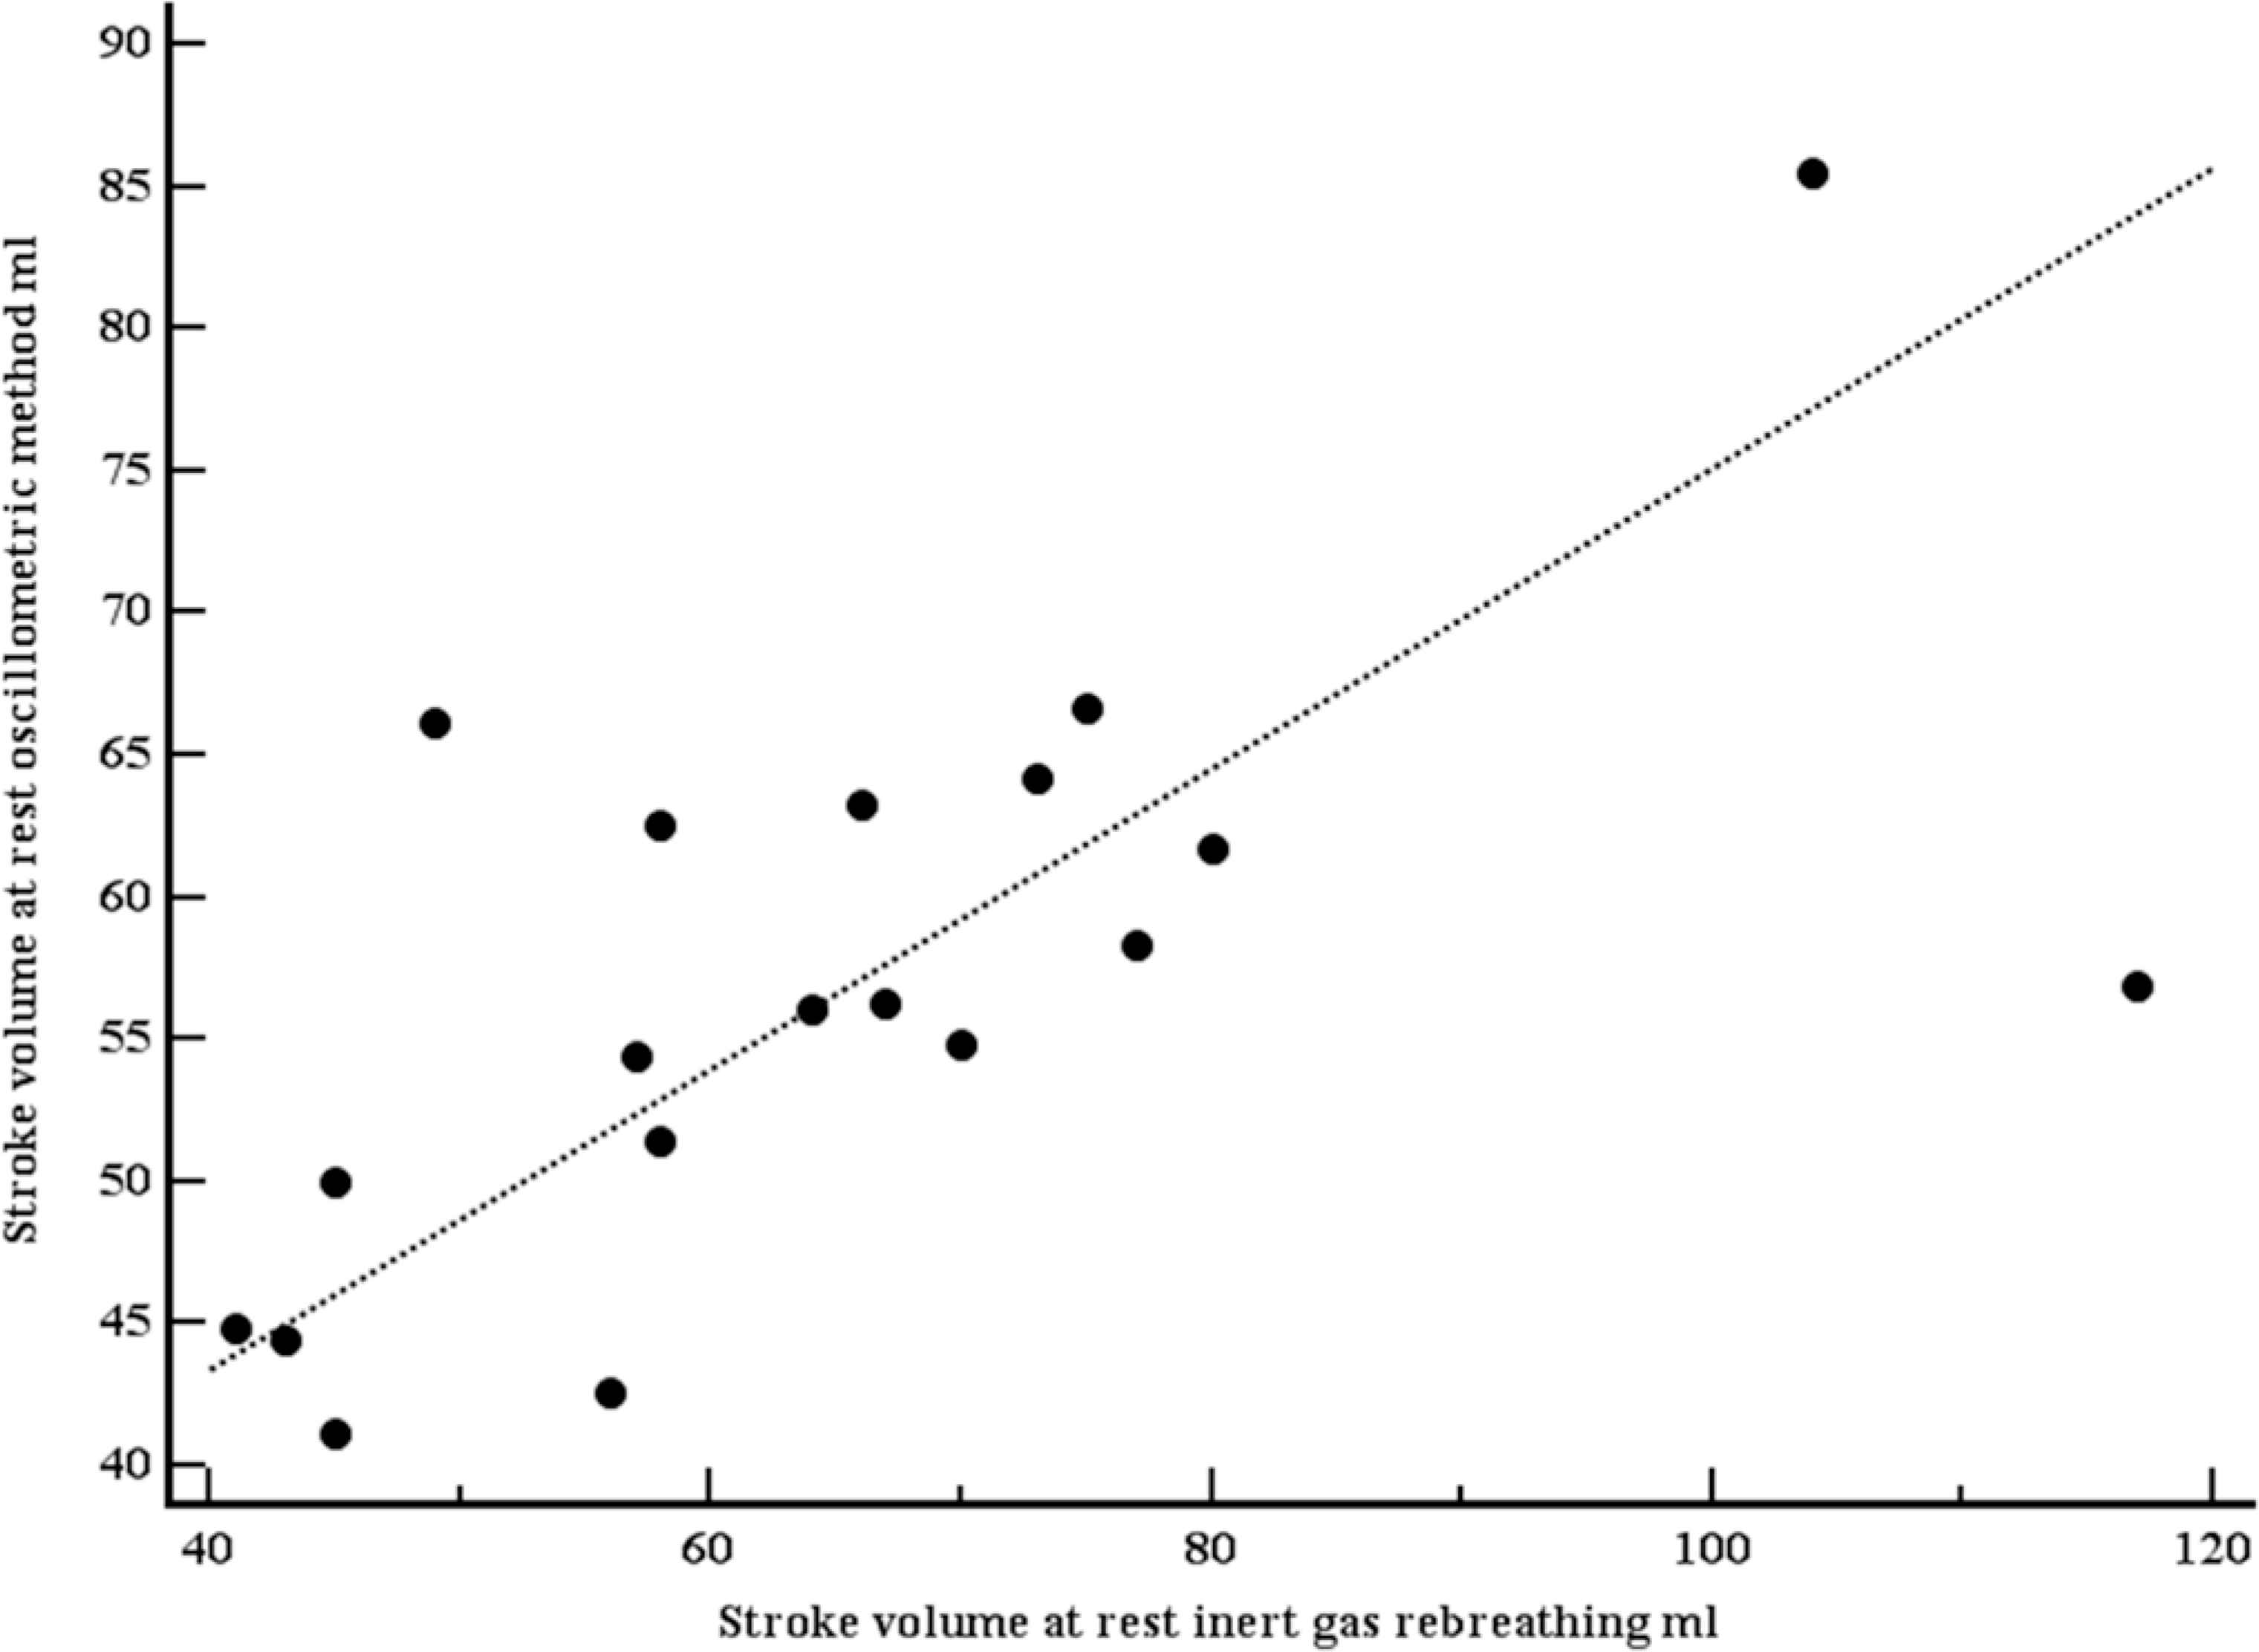
Scatter plot with line of equality comparing stroke volumes, measured with inert gas rebreathing (Innocor), and estimated with the oscillometric device (mobilograph), at rest. Both stroke volumes were moderately correlated (r = 0.63, p = 0.004).
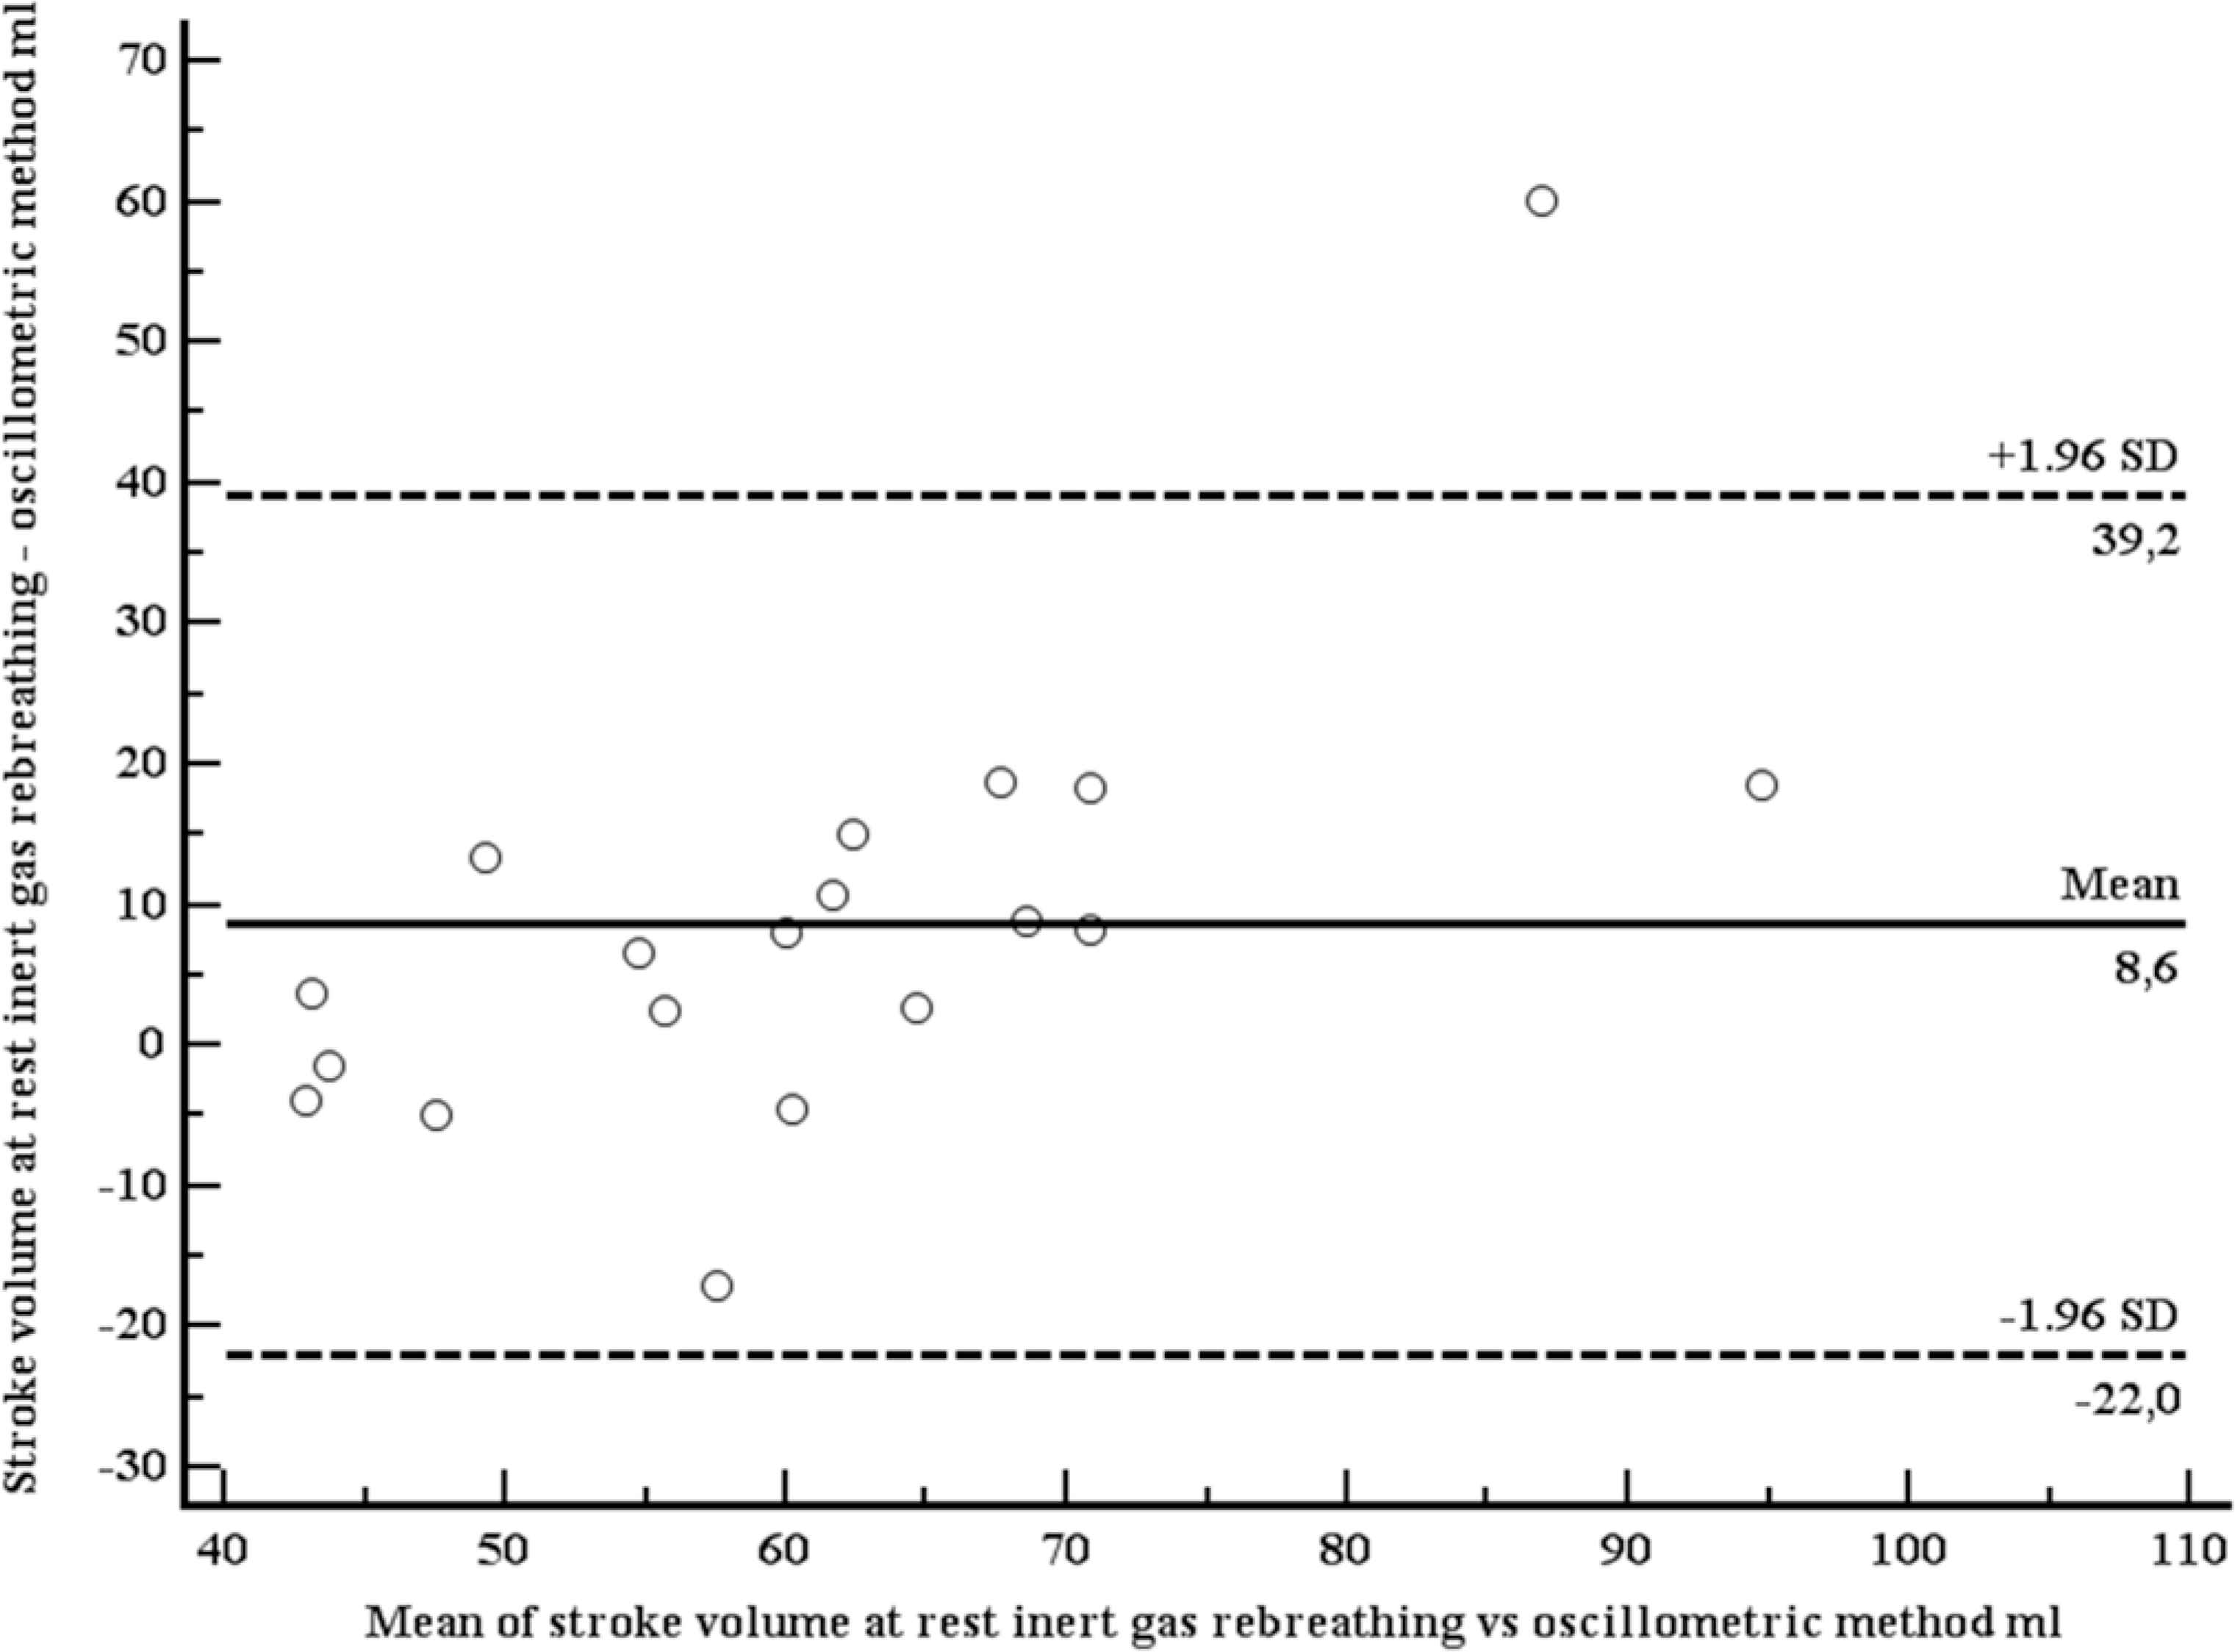
Bland–Altman plot comparing stroke volumes, measured with inert gas rebreathing (Innocor), and estimated with the oscillometric device (mobilograph), at rest.
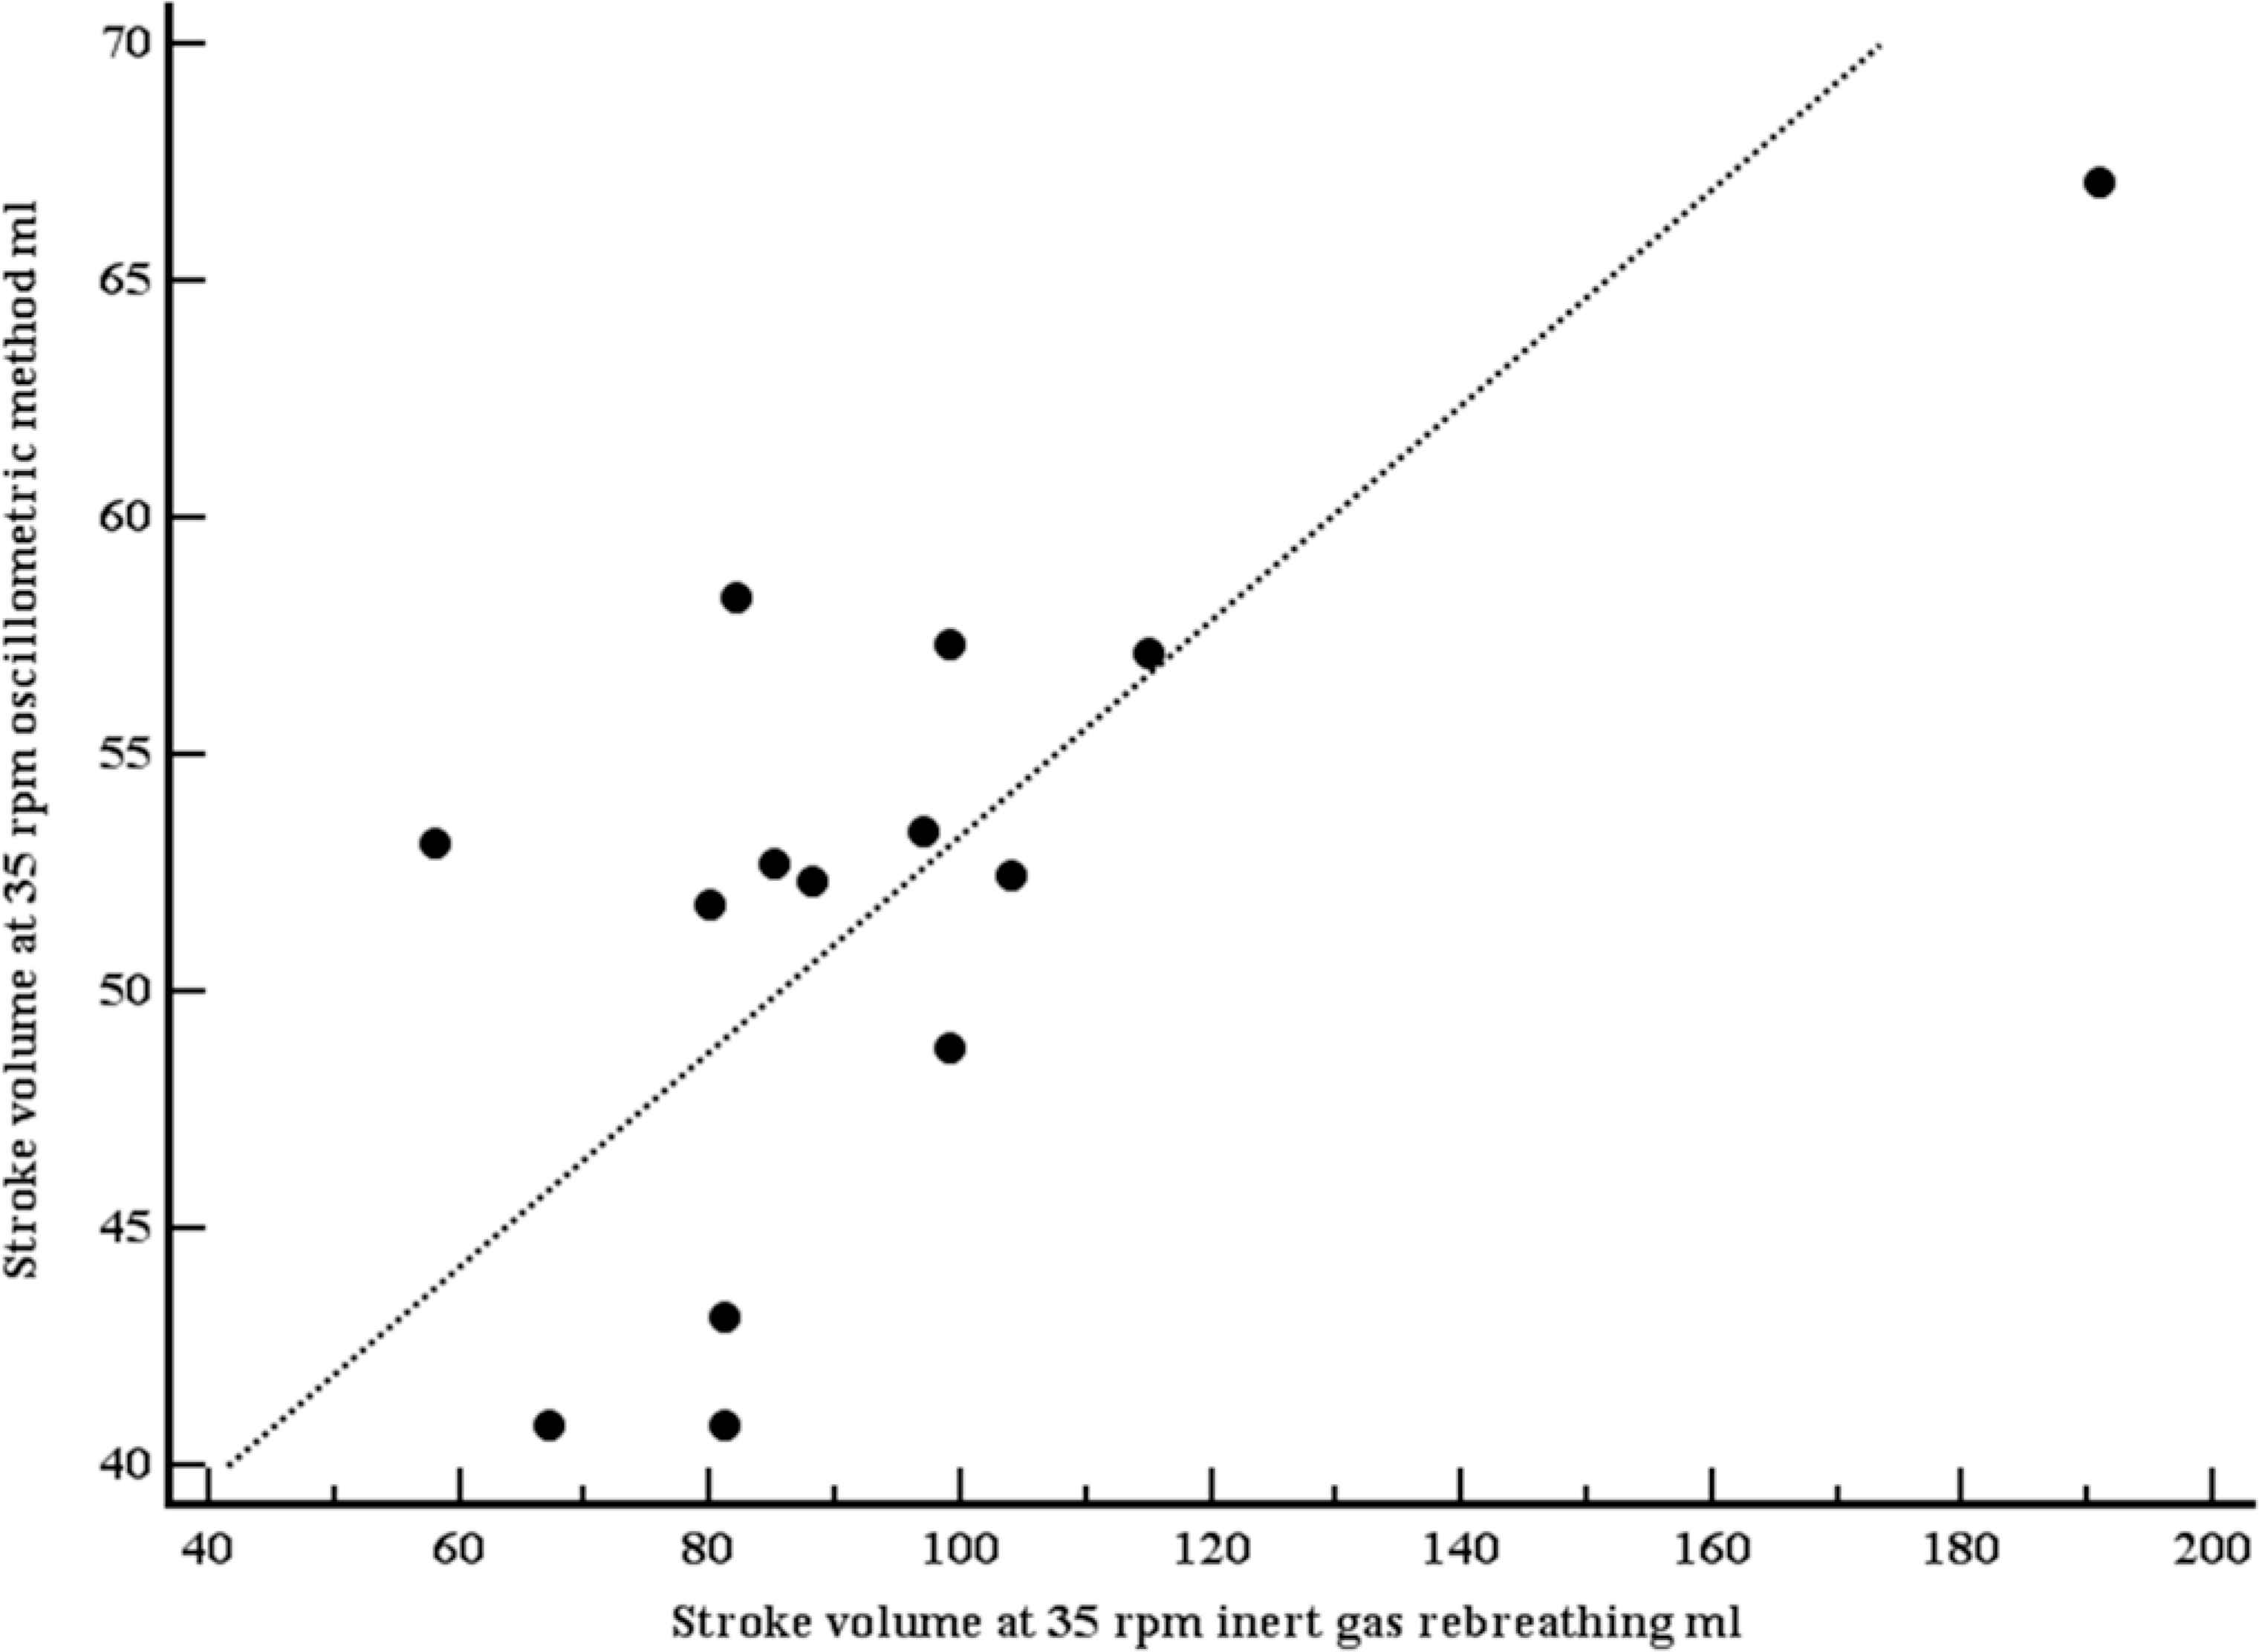
Scatter plot with line of equality comparing stroke volumes, measured with inert gas rebreathing (Innocor), and estimated with the oscillometric device (mobilograph), at light exercise (35 rpm). Both stroke volumes were moderately correlated (r = 0.70, p = 0.0057).
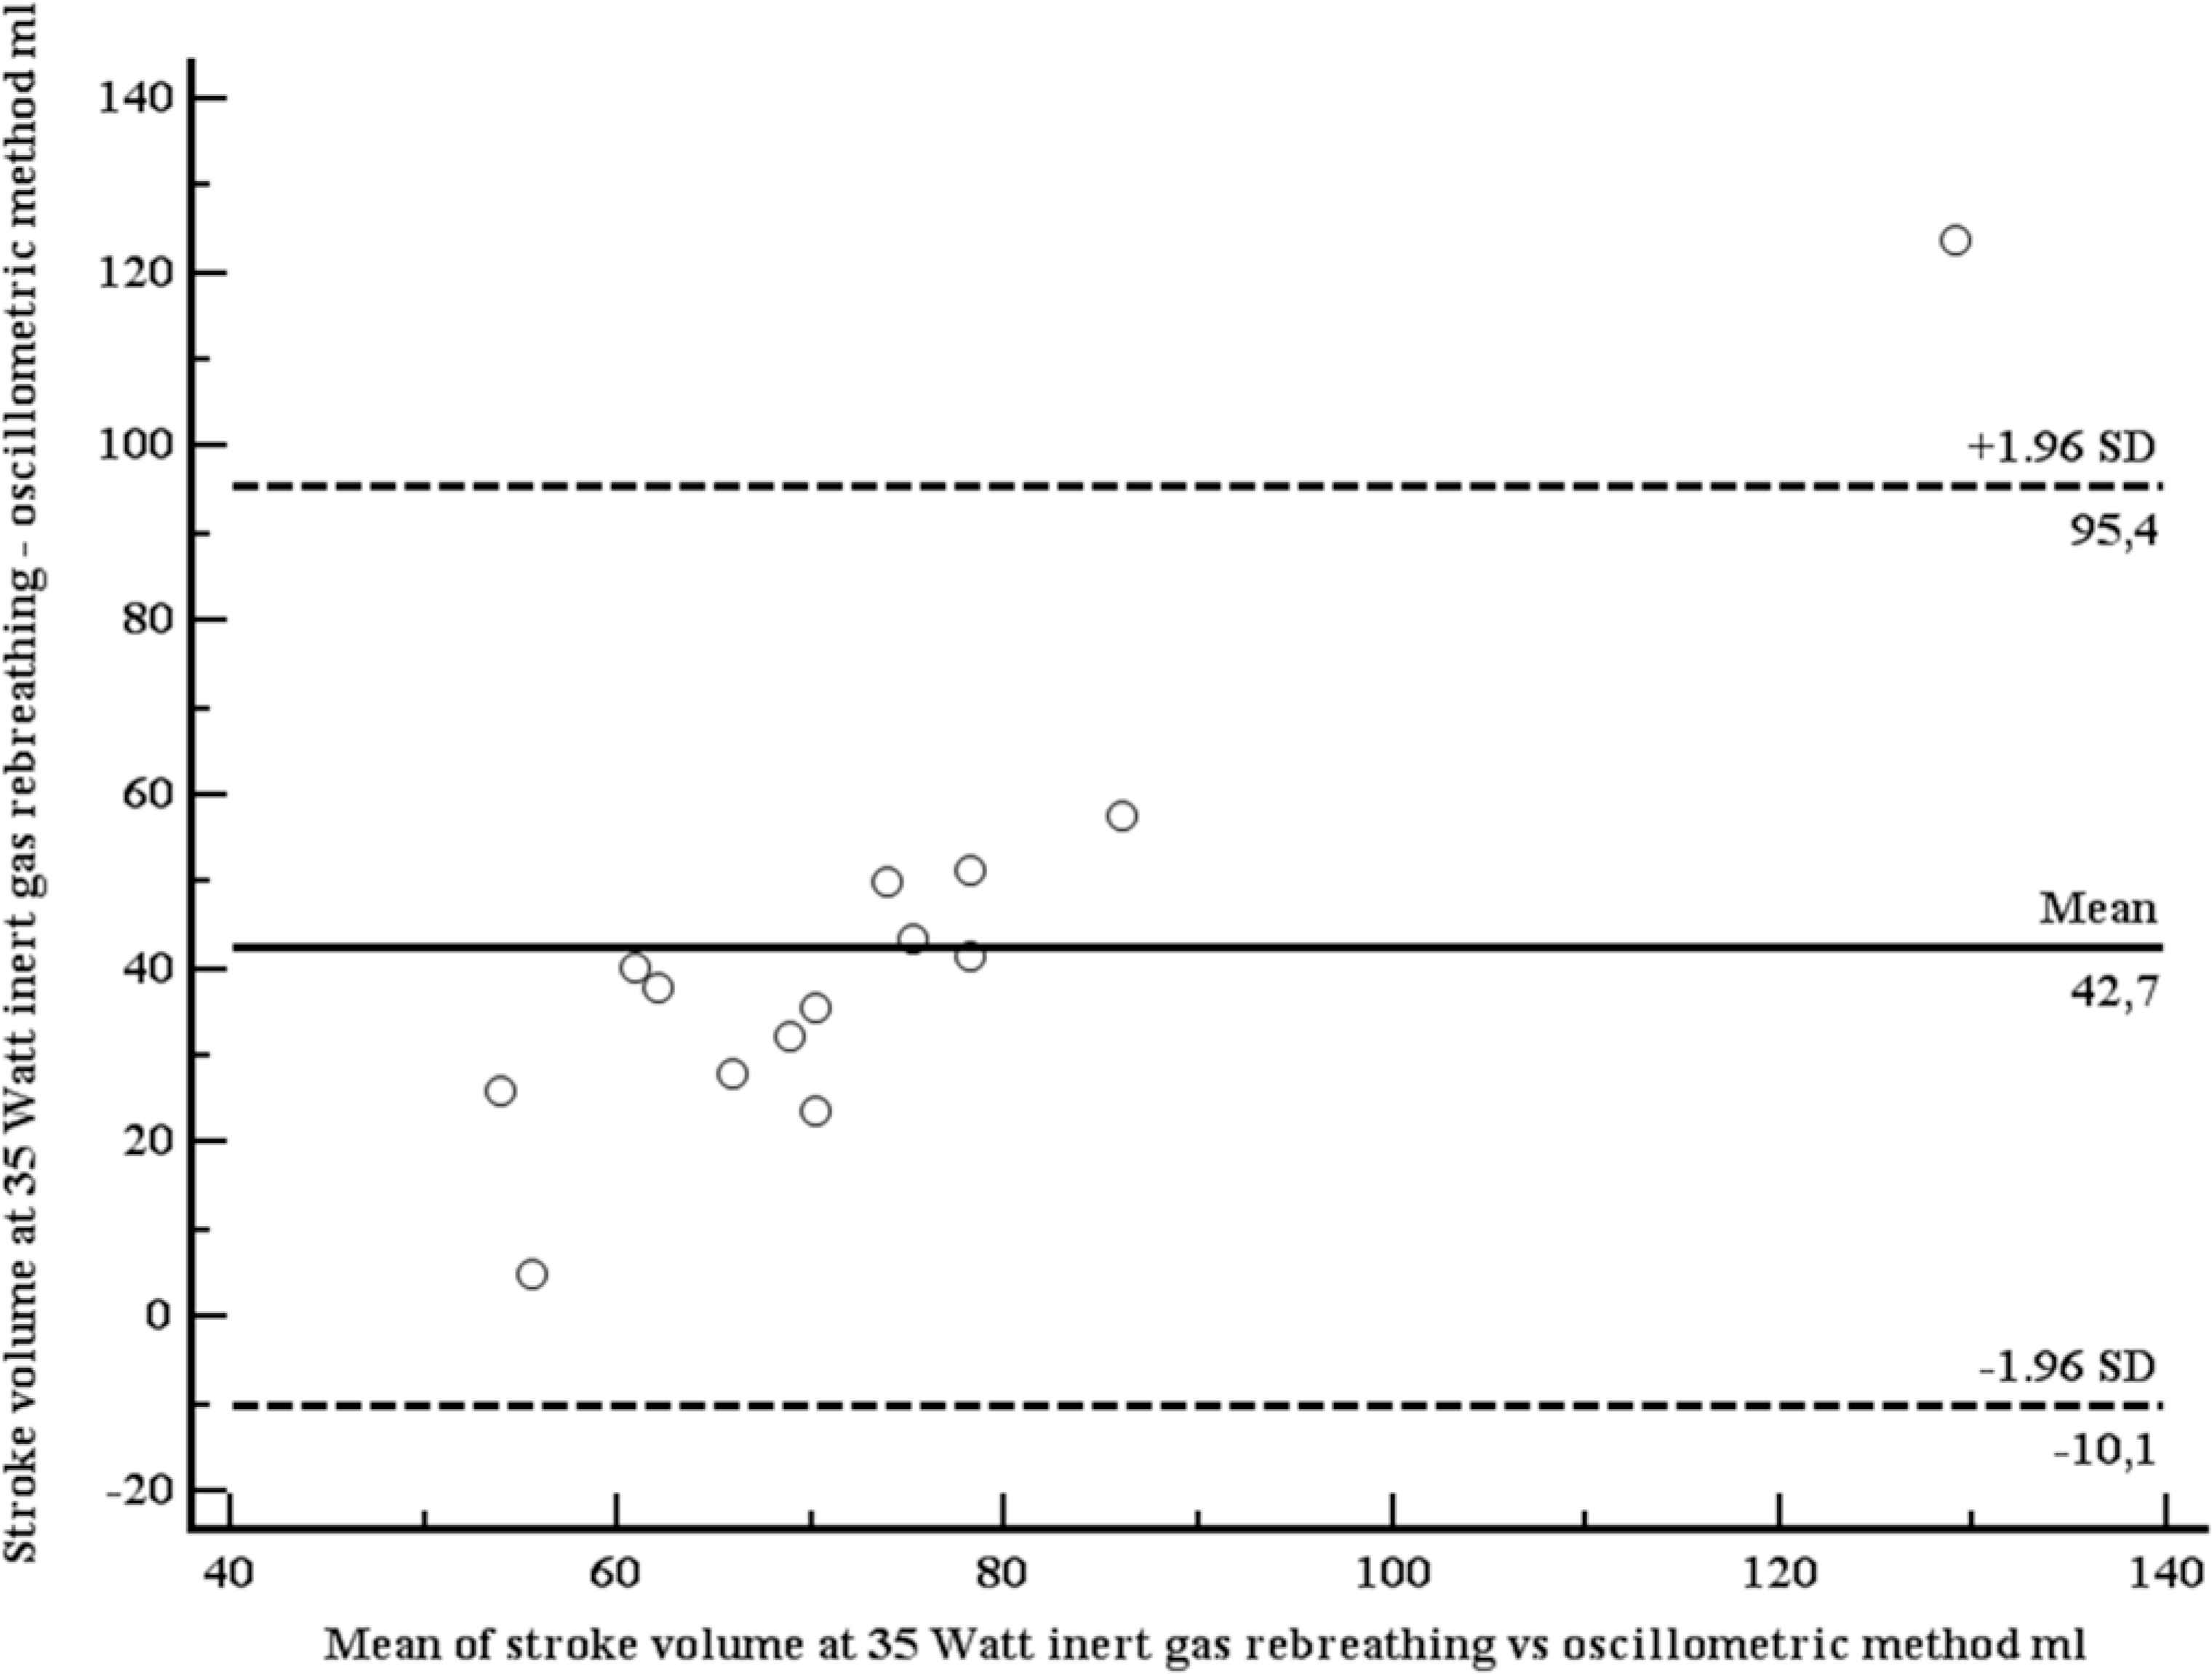
Bland–Altman plot comparing stroke volumes, measured with inert gas rebreathing (Innocor), and estimated with the oscillometric device (mobilograph), at light exercise (35 rpm).
4. DISCUSSION
In our study, we compared a novel method to estimate stroke volume against two established standard techniques, MRI and IGR. The new method is based on brachial pressure waveforms, obtained with a routine brachial cuff, and processed with dedicated mathematical models (ARCSolver algorithms). This implies that the new method – for the first time – can be implemented into routine 24 h brachial BP monitoring, which would open not only a new field of research, but also have the potential to be easily used in everyday clinical care.
In general, invasive and non-invasive methods and devices for continuous measurement of cardiac output (SV × heart rate) nowadays are mainly used in intensive care medicine [8] and research. A recent review article [8] lists – apart from intrapulmonary thermodilution, the gold standard – Doppler methods, bioimpedance, bioreactance, partial rebreathing, and – of particular interest for our work - pulse contour and pulse wave velocity based systems. Most pulse contour-based devices (for instance the PiCCO® system) need invasive calibration, and therefore cannot be used outside critical care medicine. Uncalibrated arterial waveform devices (for instance the FloTrac® device) are based on mathematical models. Their accuracy, as compared with thermodilution, is lower than for the calibrated devices, with reported Pearson correlation coefficients between 0.35 and 0.85 [8]. The correlation coefficients for our novel method (0.54, 0.63, 0.70), as compared with our gold standard methods, are well within these limits.
In a recently published study from Athens [16], CO was measured in 24 patients in shock at the intensive care unit invasively (thermodilution) and non-invasively with the method we describe, i.e. brachial-cuff derived pressure waveforms and dedicated ARCSolver algorithms. The intraclass correlation coefficient between both methods was 0.72, thus very similar to our results. Moreover, CO measurement with the non-invasive method was highly reproducible. In hypertension research, invasive measurement of CO and TPR has been performed for decades [1,17]. For instance, it has been shown that a high CO is an early hemodynamic abnormality in hypertension [1], and young patients with hypertension have increased CO [17] as a key hemodynamic mechanism. More recent non-invasive studies revealed that isolated systolic hypertension in young adults result from an increased SV and/or aortic stiffness, whereas the major hemodynamic abnormality underlying systolic-diastolic hypertension is an increased peripheral vascular resistance [18]. Moreover, mechanisms underlying elevated systolic BP (SBP) in young adults differs according to adiposity, with CO being the key abnormality in normal-weight individuals, and TPR being key in overweight individuals [19]. Other important areas of research, where measurements of CO and TPR are performed, include the hemodynamic responses to antihypertensive drugs [20] and interventions [21].
Although our results, obtained at rest, support the use of our novel OSC method for SV estimation in clinical research, the behaviour of the method at exercise raises some concern, in particular the absence of an increase of SV. Although the behavior of SV (plateau or further increase) at higher exercise levels seems to differ among individuals, an increase at lower exercise levels is common [22]. The different results with our method obviously are related to the difficulty of obtaining high-quality waveforms with exercise, which is also evident from the fact that in five out of 19 participants no estimate of SV at light exercise could be provided by the device. Clearly, further work is needed to refine the algorithm especially during light exercise.
In summary, we present a novel non-invasive method to estimate stroke volume (hence, cardiac output and total peripheral resistance) from brachial waveforms, obtained with a conventional OSC cuff, which can be used during 24-h blood pressure monitoring.
CONFLICTS OF INTEREST
C.C.M and S.W. are inventors (not holder) of a patent partly used in the ARCSolver Algorithms. The other authors do not have any conflicts of interest to declare.
AUTHORS’ CONTRIBUTION
TW, SW, CMM and BM contributed to conceptualization. JEM, BH, CCM, H-JF, GK contributed to data curation. TW and SW contributed to formal analysis. CMM contributed to funding acquisition. JEM, BH, CCM, H-JF and GK contributed to investigation. TW, SW, CMM and BM contributed to methodology. TW, SW, CMM and BM contributed to project administration. TW, SW, CMM, BM and RKB contributed to resources. SW and BH contributed to software. TW, SW, CMM and BM contributed to supervision. SW, CCM, CMM and BM contributed to validation. TW contributed in visualization and writing (original draft). SW, CMM, H-JF, GK, RKB and BH contributed in writing (review and editing).
FUNDING
Part of study 2 (performed in Cambridge) was funded by the
Footnotes
REFERENCES
Cite this article
TY  - JOUR
AU  - Thomas Weber
AU  - Siegfried Wassertheurer
AU  - Jessica Middlemiss
AU  - Carmel Mary McEniery
AU  - Bernhard Hametner
AU  - Christopher Clemens Mayer
AU  - Ronald Karl Binder
AU  - Hans-Josef Feistritzer
AU  - Gert Klug
AU  - Bernhard Metzler
PY  - 2020
DA  - 2020/03/02
TI  - Validation of a Method to Estimate Stroke Volume from Brachial-cuff Derived Pressure Waveforms
JO  - Artery Research
SP  - 42
EP  - 47
VL  - 26
IS  - 1
SN  - 1876-4401
UR  - https://doi.org/10.2991/artres.k.200223.001
DO  - 10.2991/artres.k.200223.001
ID  - Weber2020
ER  -