
P143 VALIDITY OF PULSE WAVE VELOCITY AND AUGMENTATION INDEX MEASUREMENTS IN PATIENTS WITH ATRIAL FIBRILLATION
- DOI
- 10.1016/j.artres.2017.10.155How to use a DOI?
- Abstract
Background: Individualized weighing of the risk-benefit of anticoagulation is recommended in patients with atrial fibrillation (AF) that have low established risk scores or, conversely, are at increased risk for bleeding1. Parameters of arterial stiffness and wave reflection could improve risk stratification, but their use has not been validated in arrhythmia2–3.
Methods: We measured carotid-femoral pulse wave velocity (PWV), central augmentation index (AI) and central pulse pressure (CPP) using the SphygmoCor (AtCor Medical, Sydney, Australia) system in 34 patients (53 to 85 years; 25 males) with AF before and after elective electrical cardioversion. Agreement was assessed using the intraclass correlation coefficient (ICC) and the coefficient of variation, completed with Bland-Altman plots.
Results: Following cardioversion, mean arterial blood pressure (MAP) and heart rate (HR) decreased significantly by 7 mmHg and 18 bpm respectively. PWV decreased from 11.8 m/s to 10.7 m/s, AI increased from 24% to 29%, and CPP rose from 45 mmHg to 50 mmHg. The decrease in PWV was related to the decrease in MAP (beta = 0.57; R2 = 0.33; P < 0.001) whereas changes in AI and CPP were related to the decrease in HR (AI: beta = −0.59; R2 = 0.35; P < 0.001, CPP: beta = −0.52; R2 = 0.26; P = 0.001).
After adjustment for changes in MAP and HR, reliability analysis showed an excellent agreement for PWV (ICC = 0.89; 95%CI: 0.79–0.95) but moderate agreement for AI (ICC = 0.59; 95%CI: 0.17–0.80). Excellent agreement was also found for CPP (ICC = 0.89; 95%CI: 0.78–0.94).
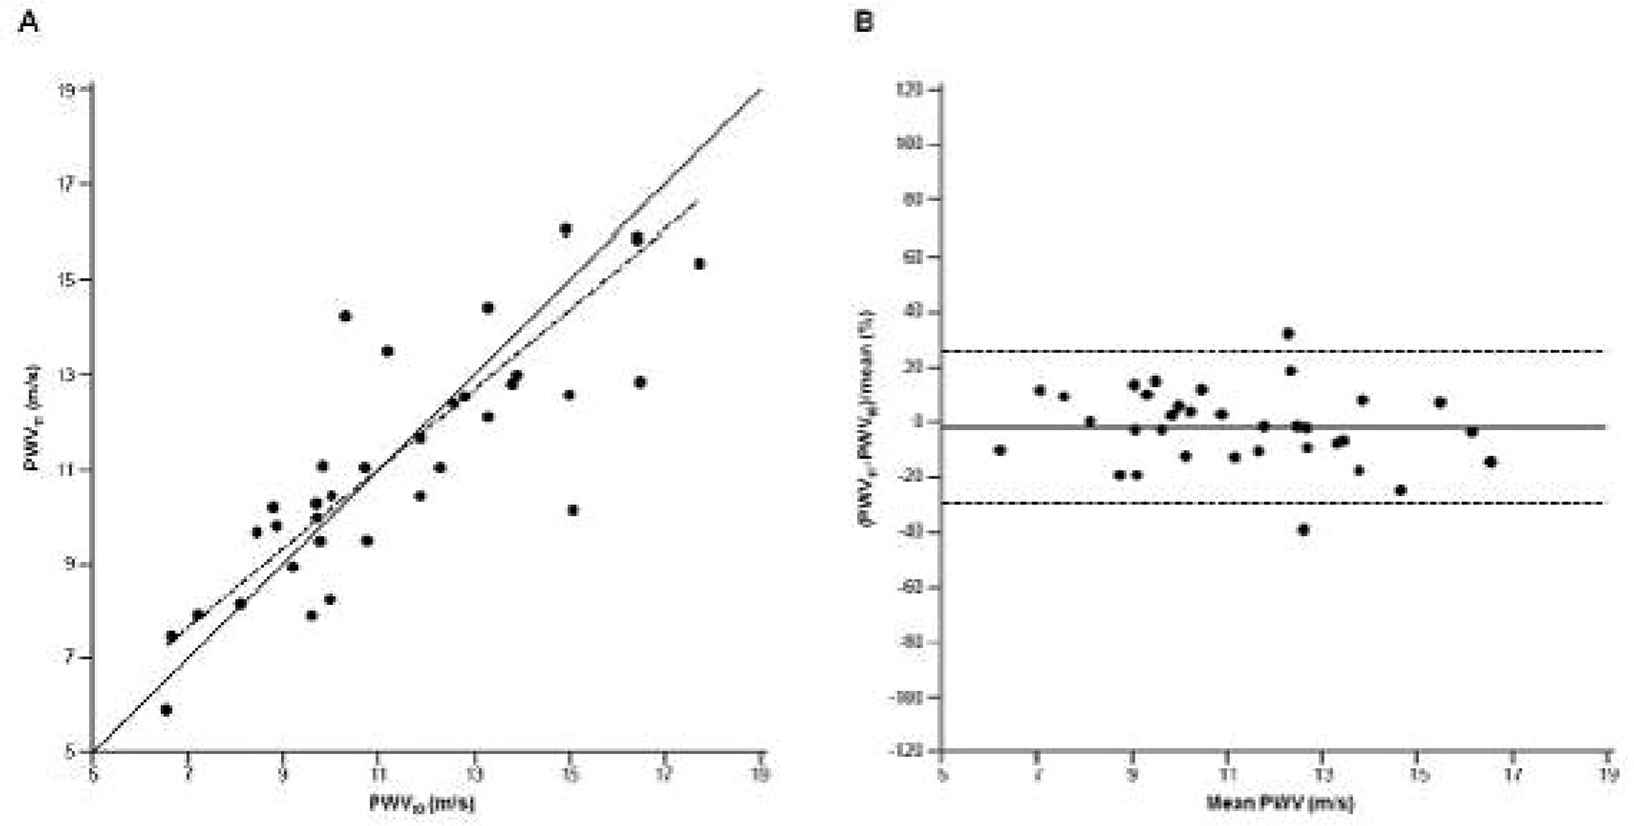 Figure 1.
A. Scatter plot showing PWV before (PWVt0) and after (PWVt1) cardioversion. The solid line Is the Ihie of identity, the broken line the regression line for PWVt1 vs PWt0 (Passini & Bablok regression). B. Bland-Altman plot showing the proportional difference (%) between P∖) between PWV after (PVWt1) and PWV before (PWVt0) cardioversion. The solid line represents the mean value ot PWV and the dotted lines mean ± 2 SD.
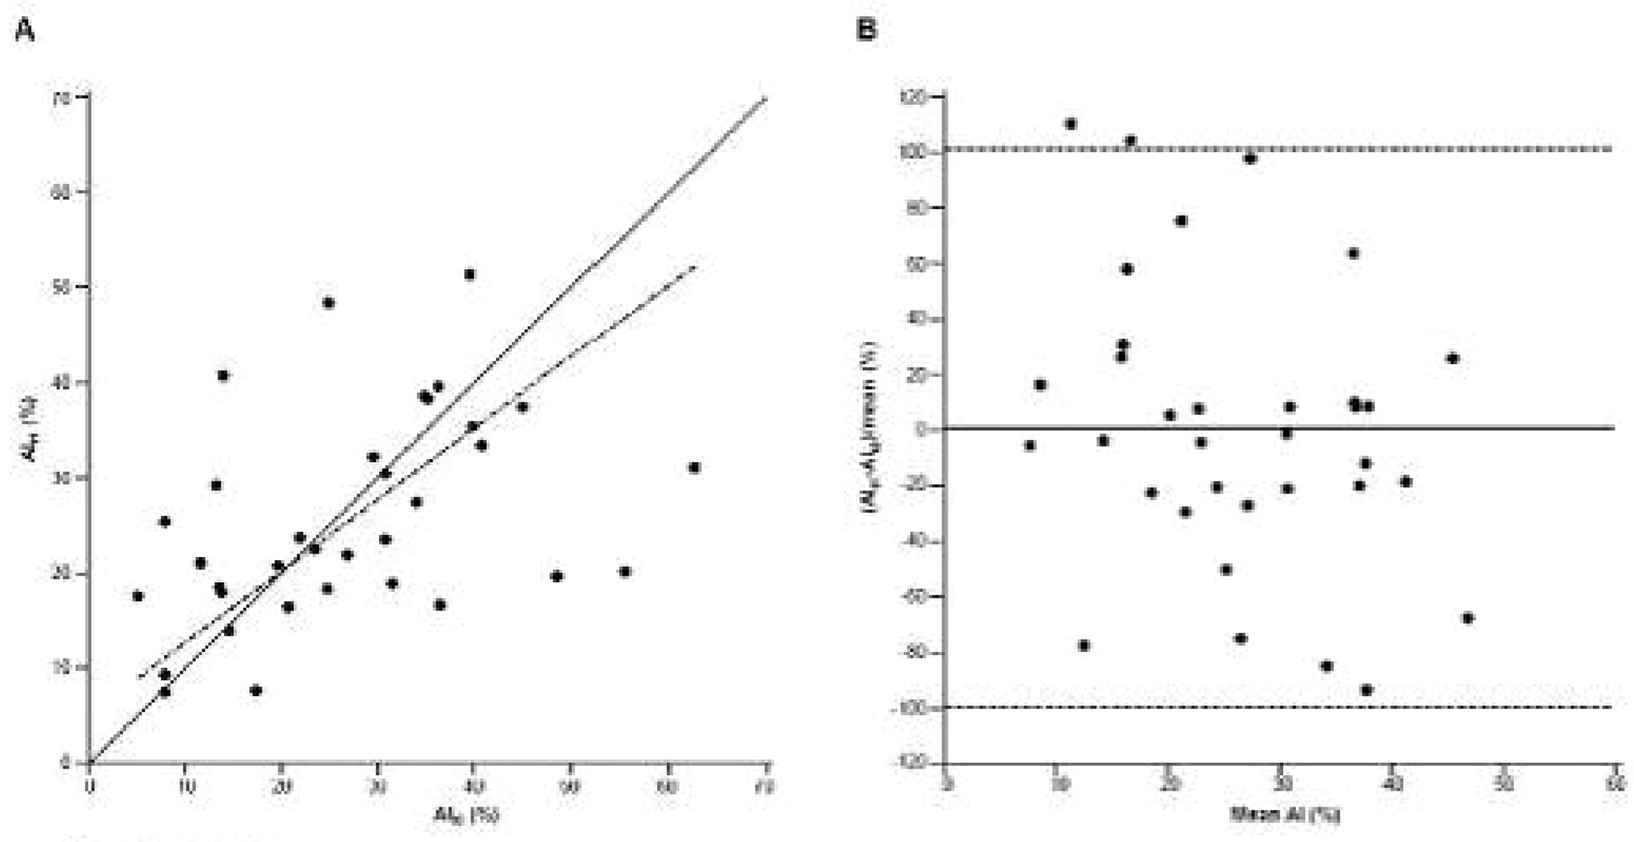 Figure 2.
A. Scatter plot showing Al before (Alt0) and after (Alt1) cardioversion. The solid line is the line of identity, the broken line the regression line for Alt1 vs Alt0 (Passing & Bablok regression). B. Bland-Altman plot showing the proportional difference (%) between Al after (Alt1) and Al before (Alt0) cardioversion. The solid line represents the mean value of Al and the dotted lines mean±2 SD.
Conclusions: Measurement of PWV and CPP is reliable in patients with AF, as they appear unaffected by the presence of arrhythmia.
- Open Access
- This is an open access article distributed under the CC BY-NC license.
Download article (PDF)
View full text (HTML)
Cite this article
TY  - JOUR
AU  - Rogier Caluwe
AU  - An S. De Vriese
AU  - Bruno Van Vlem
AU  - Francis Verbeke
PY  - 2017
DA  - 2017/12/06
TI  - P143 VALIDITY OF PULSE WAVE VELOCITY AND AUGMENTATION INDEX MEASUREMENTS IN PATIENTS WITH ATRIAL FIBRILLATION
JO  - Artery Research
SP  - 96
EP  - 97
VL  - 20
IS  - C
SN  - 1876-4401
UR  - https://doi.org/10.1016/j.artres.2017.10.155
DO  - 10.1016/j.artres.2017.10.155
ID  - Caluwe2017
ER  -