
ARTERY Society guidelines for validation of non-invasive haemodynamic measurement devices: Part 1, arterial pulse wave velocity
- DOI
- 10.1016/j.artres.2010.03.001How to use a DOI?
- Keywords
- Aortic pulse wave velcoity; aorta; arterial stiffness
- Abstract
The last 15 years have seen an explosion of interest in large artery haemodynamics, and arterial stiffness in particular. A number of devices are now available to assess arterial stiffness, and although many are in routine use, they do not necessarily provide identical information. The aim of this statement is to provide guidelines for the process of validating new devices. The focus of the article is aortic pulse wave velocity. We hope that equipment manufacturers, and researchers will both find these guidelines helpful, and that they will allow greater standardization of aortic pulse wave velocity measurements.
- Copyright
- © 2010 Association for Research into Arterial Structure and Physiology. Published by Elsevier B.V. All rights reserved.
- Open Access
- This is an open access article distributed under the CC BY-NC license.
Introduction
Over the last 15 years there has been a renaissance of interest in large artery haemodynamics. This has primarily been driven by the scientific vision of a few investigators, and greatly aided by technological developments in biomedical engineering providing simple non-invasive tools. Recent interest stems from the demonstration that several indices of large artery function, such as aortic pulse wave velocity (aPWV), are important determinants of cardiovascular risk in a variety of patient groups.1 There has also been a more widespread appreciation that brachial artery and aortic (central) blood pressure differ considerably,2 and that central pressure is more closely related to clinical events.3 As such, it is likely that greater clinical emphasis will be given to such measurements over the next 5–10 years.
The dramatic rise in the number of scientific papers concerning large arteries has led to a significant increase in the number of devices available for research and clinical use. Many of these provide similar, but not necessarily interchangeable indices, and few have been independently validated against existing apparatus. Those validation studies that are published vary considerably in design and methodology, and some provide data on repeatability or reproducibility whereas others do not.4–7 Such concerns may be particularly pertinent for the clinician or those involved in large scale population-based science, but are actually important for all those in the field. An analogy may be made with the proliferation of oscillometric sphygmomanometers, and the rapid uptake of such devices before adequate validation. This has now been addressed, in part, by validation guidelines issued by the British and European Hypertension Societies,8,9 and Association for the Advancement of Medical Instrumentation (AAMI).
One of the driving forces in the creation of the ARTERY Society was the promotion of high quality research and education. For these reasons, the Executive Committee recently set up a working group to consider the appropriate methodology for validating devices that assess large artery properties. This is the first document to arise out of that group, and concerns devices that assess pulse wave velocity. A companion paper will consider the validity of non-invasive estimates of central blood pressure. Both focus on use in adult patients, in a routine clinical or research setting.
One of the key difficulties in formulating these guidelines was the lack of a clear ‘gold-standard’. Whereas some may argue that this ought to be invasive measures, this raises a number of difficulties, not least the potential risk to subjects, availability of centres to undertake such procedures and technical issues. Recognizing this, two alternative standards are offered – one invasive and the most commonly used valid non-invasive equivalent. Finally, any validation process will to some extent be arbitrary, and alternative methodologies may be more appropriate for some devices. Nevertheless, we strongly encourage all manufacturers to undertake independent validation of their equipment to demonstrate its accuracy.
Scope
The current protocol concerns pulse wave velocity (PWV) derived from flow velocity, pressure or diameter waveforms recorded at two discrete points in the arterial tree, such as the carotid and femoral arteries. The main focus is on aPWV, because it is the most frequently measured, seems to have the greatest predictive value, and has reference values available10 – hence its choice as the current ‘gold-standard’ measure of aortic stiffness.1,11 Although PWV may be determined between other sites, such as the brachial-ankle, it is important to recognize that these do not provide the same information as aPWV not least because they include different segments of muscular arteries and often concern ‘indirect’ pathways. Similarly, we do not intend to encompass devices that provide estimates of aPWV made from single point measurements – such as the Arteriograph. However, we recognize that investigators may wish to adapt the protocol to allow a comparison between actual carotid-femoral PWV and estimated aPWV.
With regard to the choice of measurement sites for aPWV the most frequently selected are the carotid and femoral arteries – yielding perhaps more accurately named carotid-femoral PWV. We appreciate that this excludes the proximal segment of the aorta, includes a variable length of iliac and femoral arteries, and allows some degree of duality in the pathway. However, this is the most widely measured surrogate of aPWV, and is by far the most likely to be utilized in a clinical setting as a large number of devices based on this technology are now commercially available, such as the SphygmoCor and Complior systems (Fig. 1).12 Nevertheless, true aPWV can be assessed either invasively by simultaneous or sequential recording of pressure/flow waveforms, just above the aortic valve and aortic bifurcation, with indwelling catheters, or, more recently, non-invasively with MRI. Therefore, we provide reference standards for true aPWV and carotid-femoral PWV. However, the main focus of the recommendations will relate to carotid-femoral PWV.
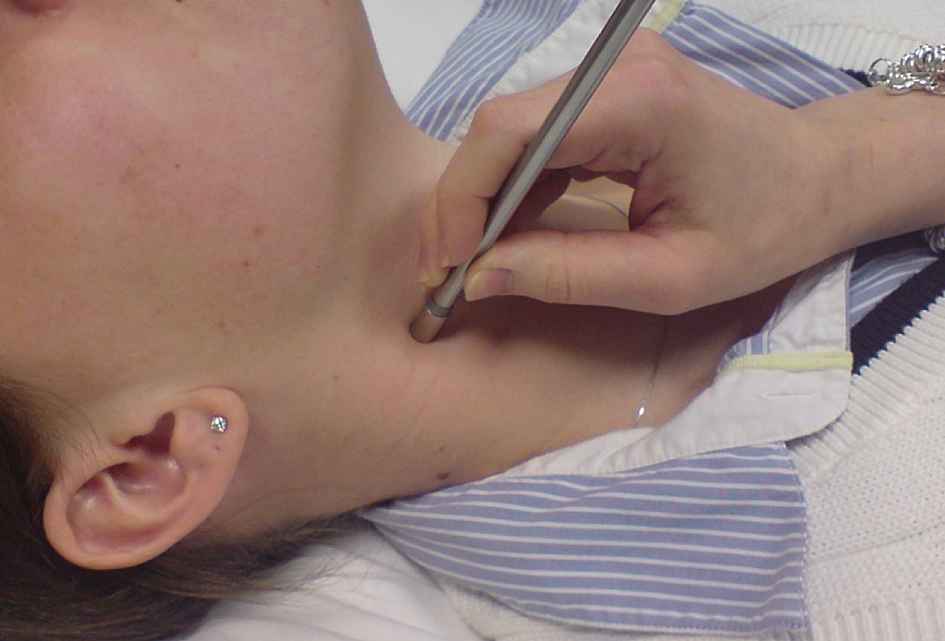
Tonometry at the carotid artery.
Reference standards
The recommended reference standard for true aPWV is simultaneous pressure waveforms recorded invasively with high fidelity pressure sensors from just above the aortic valve and just above the aortic bifurcation (Table 1). An acceptable alternative is sequential recordings referenced to the ECG, but it is important to ensure that there is no significant variation in heart rate or blood pressure during the recordings (i.e. haemodynamic stability), and readings should be made in varying sequence. The suggested sampling rate is 1kHz, with a minimum recording time of 10 cardiac cycles. The transit time should be determined from the waveforms using an intersecting tangent algorithm,13 as this has been shown to be the more accurate and less influenced by changes in wave shape or wave reflection.6 The path length should be determined from radiographic images obtained during the procedure or from the catheters themselves.
True aortic velocity
|
Carotid-femoral velocity
|
Reference standards.
Simultaneous carotid and femoral artery tonometry is the non-invasive reference for studies involving carotid-femoral PWV measurements. Two investigators should be used, with a 1kHz sampling rate, and a minimum recording time of 10 cardiac cycles. Preference is given to recordings from the right carotid and right femoral arteries. The transit time should be determined from the waveforms using the intersecting tangent method.13 The path length should be calculated by subtracting the distance between the carotid artery measurement site and sternal notch (carotid-notch), from the distance between the femoral artery site and the sternal notch (femoral-notch), all measured directly with a tape measure, or callipers:-
The above approach approximates much more closely to the true ‘anatomical’ path length, and thus yields more physiological values of PWV.14–16 More recently, Sugawara et al. have suggested measuring the distance between the carotid and femoral sites directly, and applying a correction factor of 0.8. This appears to fit with actual path length distance, measured from MRI fairly well.14
Recognizing the practical difficulties in simultaneous tonometry, and the lack of standardized readily available algorithms for determining the transit time, we suggest an alternative or ‘secondary standard’. This is the SphygmoCor device, which should be used to determine the carotid-femoral PWV by sequential ECG-referenced recordings of carotid and femoral waveforms. Preference is given to recordings from the right carotid and right femoral arteries. The intersecting tangent algorithm should be applied to the waveforms, over a minimum of 10 cardiac cycles, and the path length determined in an identical manner to that described above. A single recording is deemed acceptable if the SD for the PWV for that sequence is ≤0.5 m/s. The choice of the SphygmoCor device reflects its widespread use, the use of high fidelity tonometer equipment, established processing algorithms and its continued commercial availability. Tonometer-based systems with technical specifications demonstrably equal or superior to the Sphygmocor system may be considered appropriate, although it is the general feeling of this working group that this should be discouraged, because if multiple standards were adopted the inherent variability between standards will only serve to increase the amount by which ‘validated’ devices may differ.
Sample size and selection of subjects
The sample size for any validation procedure should be sufficiently large for a meaningful difference in PWV between devices to be reliably detected and to provide a reasonable range of values, but not too large so as to be impracticable. We estimated, based on the available literature,7,17 that the SD of the difference between measures with two devices should be ∼0.8 m/s. A sample size of 90 subjects would provide a confidence interval of ∼0.08 m/s for the difference between devices. This is based on averaging the results, which differs from the approach taken with validating sphygmomanometers by the BHS and ESH, but reflects the current use of PWV devices – namely to take the average of 2–3 measurements in a subject, rather than a single reading. A further consideration is having a sufficient range of PWV values to detect any tendency for the difference between devices to depend upon the mean value. Since age is the predominant determinant of aPWV we suggest a sample size of at least 90 subjects (but a minimum of 83 complete data sets to allow for an ∼5% drop-out rate) divided roughly equally between the following age bands (a minimum number in any one group of 25):-
- •
< 30 years
- •
30–60 years
- •
>60 years
Based on current evidence gender seems to have little impact upon aPWV. Nevertheless, we suggest a minimum of 40% of subjects from any one gender. Although mean arterial pressure and heart rate may influence aPWV we do not recommend any specific ranges for these variables, and subjects receiving vasoactive medications should not be excluded a priori, since aPWV is often measured in such patients groups. However, subjects should be in sinus rhythm and not be pacemaker-dependent at the time of measurement. Similarly, it would seem reasonable to exclude pregnant women and individuals with a BMI >30, due to problems with accurate path length measurement, and those in whom palpation of the relevant arteries is impossible, or who are known to have a clinically relevant arterial stenosis. A summary of these criteria are presented in Table 2.
Sample size
Age distribution
Exclusion criteria
|
Summary of subject selection criteria.
Practical considerations for carotid-femoral PWV
Adequate training for the individuals making the recordings must be provided. We suggest a period of familiarization with the measurement techniques and a minimum of 20 high quality recordings with the reference and test device before attempting a validation protocol.
A suitable environment should be provided for the procedure, which ensures adequate privacy, and is quiet. Measurements should be made in the supine position and after a minimum period of 15 min supine rest to afford haemodynamic stability. Subjects should refrain from large meals or smoking for the hour prior to being studied, and have taken any vasoactive medication at least 2 h beforehand. All subjects should be made familiar with the devices and test procedure BEFORE any study measurements are made.18 We suggest performing at least one set of measurements before the start of the formal data collection to minimize the ‘surprise reaction’.
Two investigators should be employed for the protocol, restricting themselves to using a single device within a subject, but alternating devices between subjects. They should be kept blinded to the results from the alternate device. This should be achieved by careful placement of the relevant equipment and oversight by a supervisor who is not directly involved in making any of the measurements. Where simultaneous recordings are to be made both investigators should be used to make the measurement (one per site), but they should alternate which site they record from between patients. Again, both should be blinded to the results of the simultaneous readings. PWV, when expressed in m/s, should be recorded to 1 decimal place.
Although the sites for recording the arterial waveforms may be marked following palpation, it is likely that the exact location of the sensors will differ slightly. Thus it is recommended that their position is marked before contact with the skin is lost and the path lengths then measured accurately with callipers or, if unavailable, an inelastic tape measure (the latter may introduce errors in obese subjects). This may (for example in the case of the SphygmoCor system) require an estimated path length to be entered into the software initially to allow a measurement to be made, and subsequent editing of the result.
The reference device should be used as detailed above. If this is the SphygmoCor system then an individual reading is deemed acceptable if the SD of the calculated PWV is ≤0.5 m/s (obtained from the ‘individual PWV’ from paired wave recorded over the 10 s of recording). Where simultaneous recordings are made it is likely that PWV will be calculated off-line and will thus not be available during the test procedure. Therefore, the recommended criterion for an acceptable recording is a SD of ≤0.7 m/s. The test device should be used as specified in the manufacture’s handbook, including what constitutes an acceptable reading. The path length should be measured as directed, but the investigators may wish to also measure the path length as for the reference standard to provide a potential explanation for any large discrepancies in PWV, should they arise. During the procedure 3 attempts to obtain an acceptable individual measurement of PWV may be made. If this is not possible the subject should be withdrawn from the study, but all evaluable data included in the analysis. If this amounts to <2 readings with either single device the subject’s data should be excluded from the analysis, and they should be replaced if the minimum acceptable data set has not been achieved (83 subjects).
Procedure for carotid-femoral PWV
- •
The subject should be introduced to the investigators and familiarized with the environment, procedure, and devices.
- •
Measure height and weight and calculate BMI.
- •
Rest the subject supine for a minimum period of 15 min. During this time the carotid and femoral arteries should be palpated and suitable sites for measurement identified and marked.
- •
Record blood pressure in the non-dominant arm immediately before the procedure (duplicate readings with a validated device). Heart rate should also be noted. 6 sequential recordings should then be made, alternating devices between recordings. Up to 3 attempts may be made to obtain an acceptable recording. The order of device should alternate between subjects (Table 3).
- •
Make duplicate recordings of blood pressure and heart rate (changes during the procedure may help explain any large variation in measurements over the length of the protocol).
- •
End of study.
| Subject 1 | Subject 2 |
|---|---|
| 1. Device 1, observer A | Device 2, observer A |
| 2. Device 2, observer B | Device 1, observer B |
| 3. Device 1, observer A | Device 2, observer A |
| 4. Device 2, observer B | Device 1, observer B |
| 5. Device 1, observer A | Device 2, observer A |
| 6. Device 2, observer B | Device 1, observer B |
Order of measurement for two sequential subjects.
Intra-arterial validation
It is anticipated that this will be performed far less frequently than non-invasive validation. In addition to the potential ethical considerations, intra-arterial measurements present a number of practical and procedural challenges. The basic design of the validation procedure should be as for carotid-femoral validation. However, it is recognized that relatively few young people undergo routine arterial catheterization. Therefore, it seems reasonable to permit deviation from the usual spread of ages and to accept a minimum of 20 subjects in each of the following age bands <50 years, 50–70, and >70 years. Where it is impossible to undertake alternate measurements with the test device and catheter (Table 3), eg a comparison between catheter and MRI, it is acceptable to perform 3 readings with one device and then 3 with the other, but the delay should be as short as practically possible. At a minimum, mean arterial pressure and heart rate should be recorded during each session to provide evidence of the comparability of the test sessions. Although blinding should be maintained, it is clearly impracticable to alternate investigators.
Data analysis
For each subject the average of the 3 readings taken with each device should be calculated, and used in the subsequent analysis. The basic method of analysis should be as described by Bland and Altman (Fig. 2).19 A scatter plot of mean values for each subject from device 1 vs device 2 should be inspected to determine if there are any obvious trends/anomalies in the data. The slope, intercept (with 95% CI), root mean square error and R co-efficient should be given. The difference between values obtained by the two devices should then be plotted against the mean for both devices. This Bland–Altman plot should be inspected to determine if there is any bias in the data i.e. a tendency of the size of the difference to vary with the mean. The R co-efficient should be calculated to check for bias formally. The accuracy of the test device is determined both by the mean difference from the reference and standard deviation (SD) of this difference (Table 4). 95% of readings will lie between +/− 2SD of the mean and the plot should show the mean and +/− 2SD (Fig. 2). If there is obvious bias then regression analysis can be used to determine if there is a simple relationship between readings obtained from the two devices (e.g. device 1 10% higher than device 2) which would allow readings from the test device to be corrected. However, unless justified beforehand, “corrected” values cannot be used for the purposes of validation. The number of subjects who were excluded from the analysis should be stated so that the usability of the device can be judged (Fig. 3).
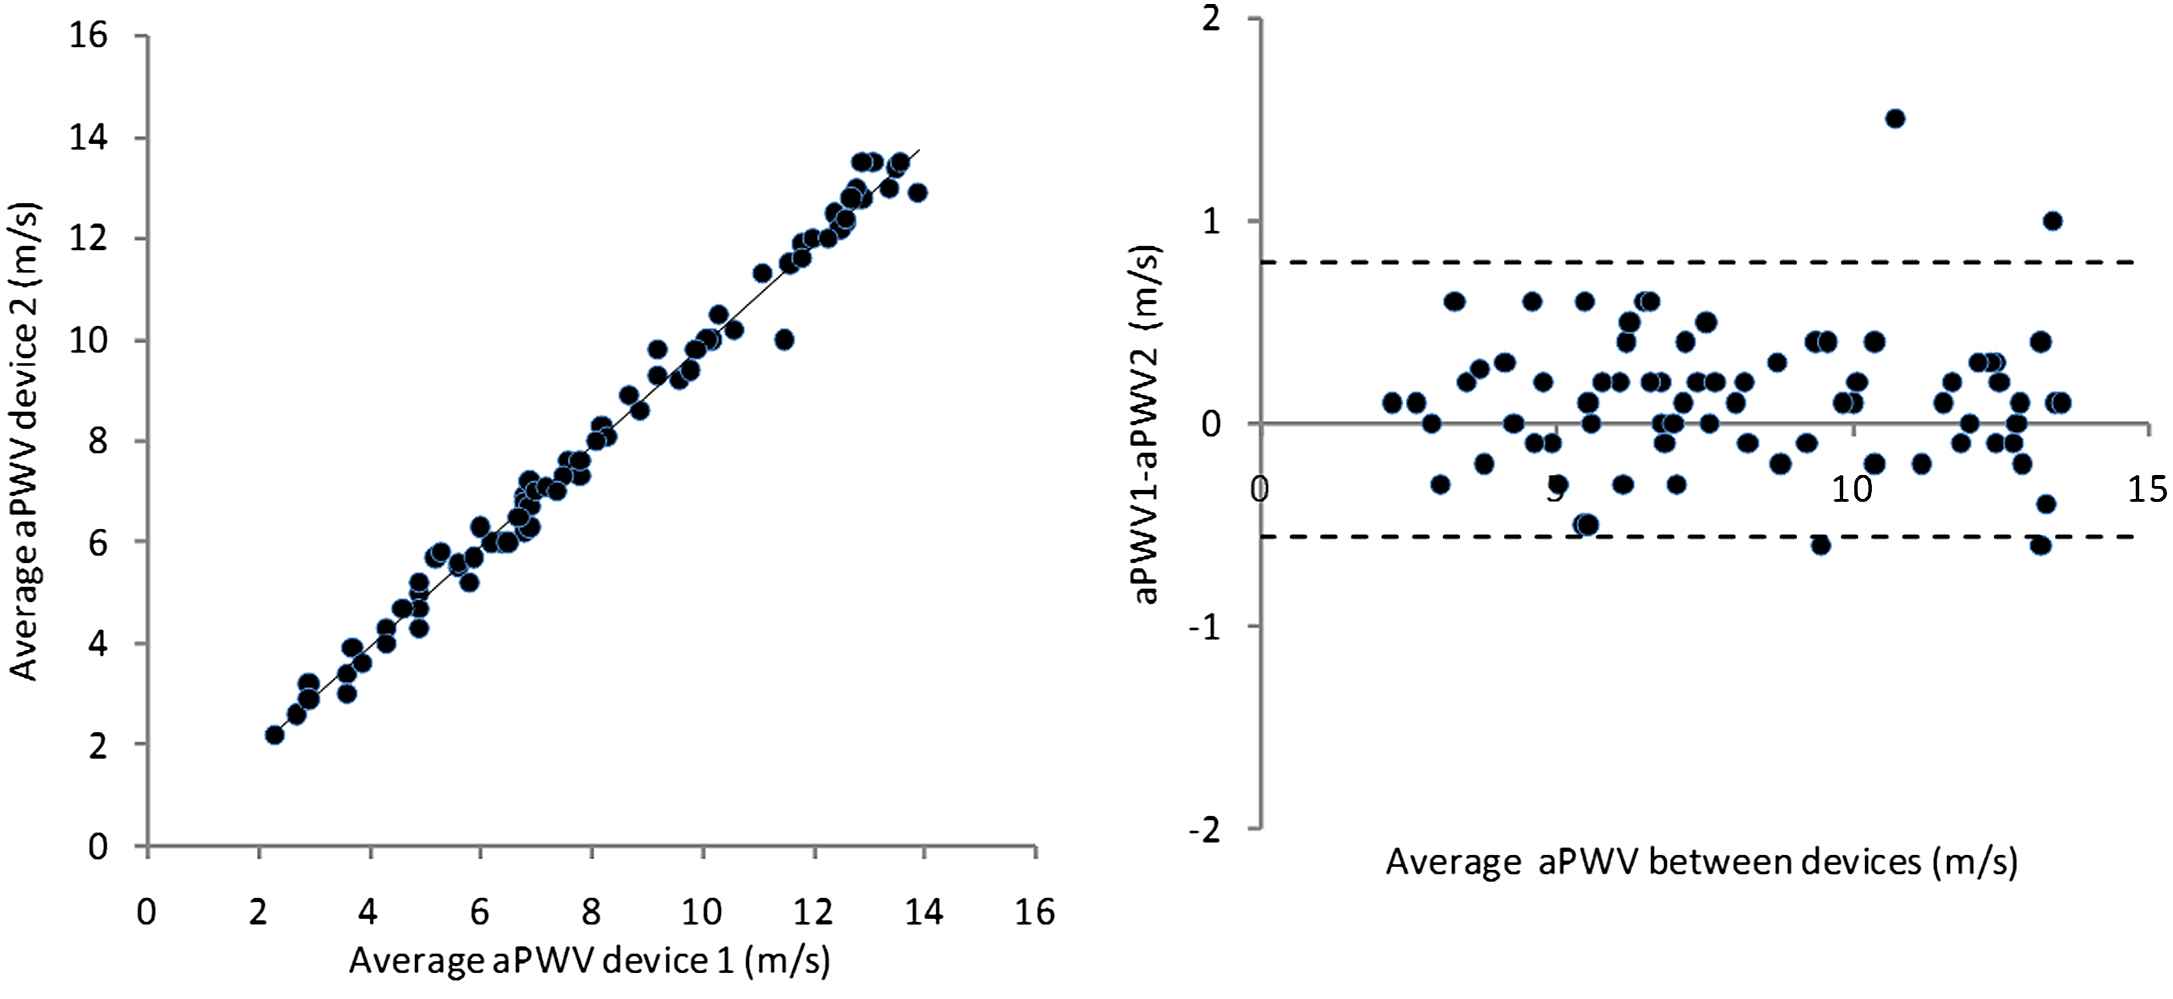
Example of data analysed using the Bland–Altman methodology. The mean difference is 0.1 m/s, and SD of this difference is 0.3 m/s, and there is no evidence of bias. This result would be graded as excellent agreement between devices.
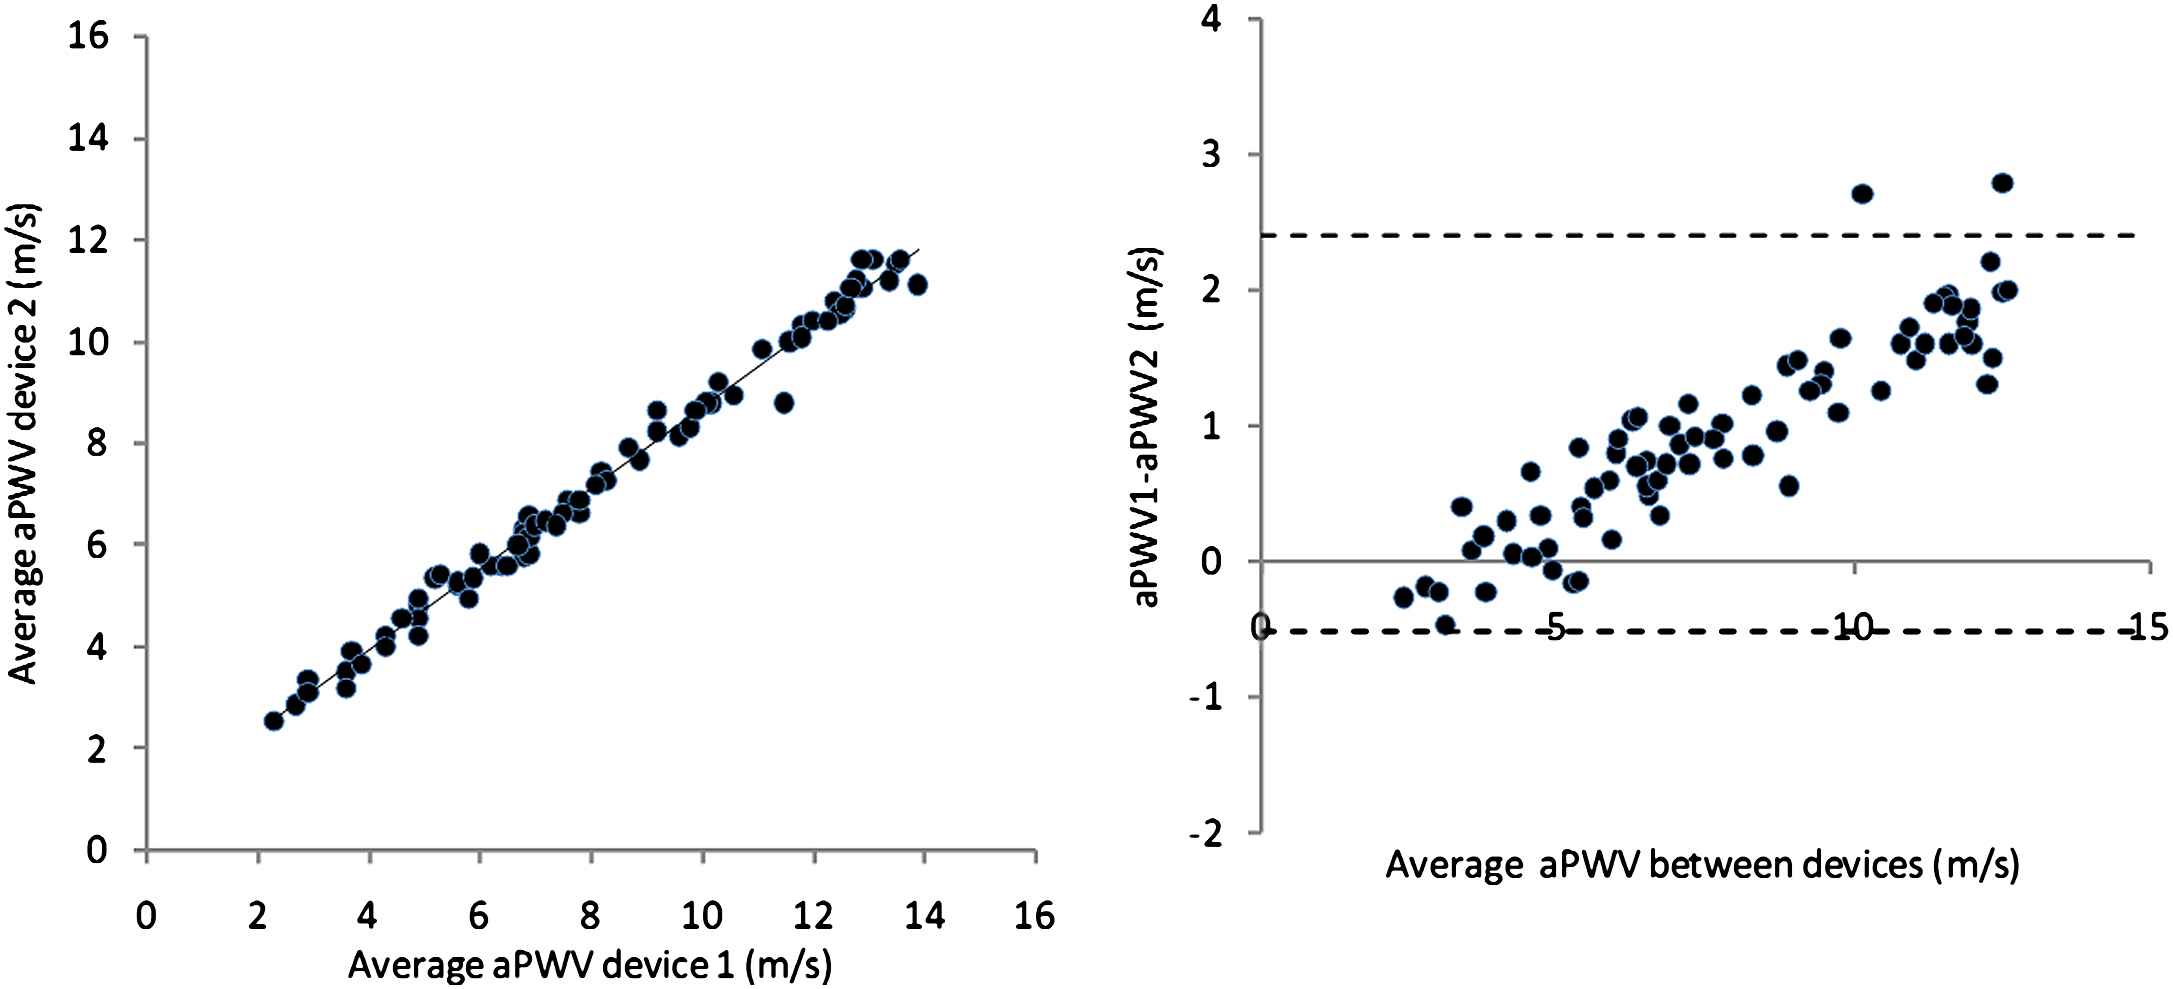
Example of data analysed using the Bland–Altman methodology illustrating bias. The mean difference is 0.9 m/s, and SD of this difference is 0.7 m/s, and there is evidence of marked bias, with a much greater difference at high velocities. This result would be graded as acceptable agreement between devices.
The accuracy of the test device is determined by both the mean difference from the reference standard (reference-test), and the standard deviation of this difference.
|
Accuracy criteria.
Although we have chosen to focus on PWV, rather than transit time, because there will be differences in the precise location of the measurements, we recognize that the devices actually measure transit time. Where there is disagreement between devices, or systematic bias, a secondary analysis based around transit times and path lengths may be helpful in understanding the reasons for the disparity.
Special situations
The basic protocol described above can be readily adapted to assess the reproducibility of a test device by making measurements on two separate occasions. We suggest a minimum separation of 24 h and standardization of the time of day the measurements are made. Longer separation periods may be appropriate in certain circumstances, with a maximum of 1 month to avoid bias due to effect of ageing and variation in other confounding influences. The results should be presented in a similar manner to the general validation procedure. The intra- and inter-observer repeatability of measurements can also be assessed in a similar way.
There is increasing interest in using PWV to phenotype children, yet little is known about the validity of the available devices in children. We would therefore encourage researchers to undertake such non-invasive validation using simultaneous pressure measurements as the standard reference technique, but accept that this may be impossible in small children when Doppler flow velocity waveforms may have to be used. The recommended number of subjects is 40, with an age distribution similar to the population in which it is intended to use the device. Roughly equal numbers of girls and boys should be studied.
Summary
The aim of this document is to provide a standard methodology for validating devices that measure PWV. We have drawn on previous experience with validating oscillometric sphygmomanometers, and the available data concerning PWV validation. As PWV becomes more frequently measured, and the number of commercially available devices increases, it is important that common standards are agreed, so that devices are seen as interchangeable. Without this it will be difficult to extrapolate between studies and reference standards. Although we have focused almost exclusively on aPWV these guidelines can be readily adapted for carotid-radial (brachial) PWV, and for devices that provide surrogate estimates of aPWV. We would strongly encourage all manufactures of new devices to submit them to independent validation before they are released. Finally, these recommendations will be subject to regular review as new technologies and assessments of method equivalents emerge.
Acknowledgements
The
Conflict of interest statement
The ARTERY society has received educational support from: AtCor, pulsepen, TensioClinic, Servier medical, Omron, Viasys, SMART Medical, and ScanMed. IBW has received educational grants from AtCor and Skidmore Medical; PB from AtCor.
References
Cite this article
TY  - JOUR
AU  - Ian B. Wilkinson
AU  - Carmel M. McEniery
AU  - Giuseppe Schillaci
AU  - Pierre Boutouyrie
AU  - Patrick Segers
AU  - Anne Donald
AU  - Philip J. Chowienczyk
AU  - On behalf of the ARTERY Society
PY  - 2010
DA  - 2010/03/31
TI  - ARTERY Society guidelines for validation of non-invasive haemodynamic measurement devices: Part 1, arterial pulse wave velocity
JO  - Artery Research
SP  - 34
EP  - 40
VL  - 4
IS  - 2
SN  - 1876-4401
UR  - https://doi.org/10.1016/j.artres.2010.03.001
DO  - 10.1016/j.artres.2010.03.001
ID  - Wilkinson2010
ER  -