
Use of wave intensity analysis during peripheral revascularisation: Lessons from cases study
- DOI
- 10.1016/j.artres.2013.03.001How to use a DOI?
- Keywords
- Wave intensity; Arterial disease; Stenting; Bypass
- Abstract
Background: Wave propagation in arteries can be characterized by the wave-intensity approach. This has particularly well been studied in healthy ascending aortas, carotid, brachial and coronary arteries. However, wave propagation in diseased and peripheral arteries remains unknown. We performed wave intensity analysis in such conditions during endovascular and surgical procedures and described the changes after revascularisation.
Methods: Velocity and pressure measurements were performed simultaneously along the femoral axis using Combowire® (Volcano Corp) in 4 patients with peripheral vascular disease. Data were acquired before the lesion was treated and repeated just after. Procedures concern one femoral stenosis stenting, one femoral occlusion stenting and two femoro-popliteal bypasses.
Results: Forward wave intensity absorption was related to the severity of the arterial lesion. Stenting or surgical bypass restored forward wave intensity to the same extent. Persistent absorption of forward wave intensity was observed per-operatively in the bypass that showed abnormal decreased peak velocity at the post-procedural duplex examination.
Conclusions: Per-operative combined pressure and velocity measurement can be performed during vascular procedures. The characterization of wave intensity across the arterial axis provides crucial information not only regarding the severity of the arterial lesion but also the adequacy of revascularisation.
- Copyright
- © 2013 Association for Research into Arterial Structure and Physiology. Published by Elsevier B.V. All rights reserved.
- Open Access
- This is an open access article distributed under the CC BY-NC license.
Introduction
Long-term patency of peripheral arterial bypasses remains a key issue for patients with symptomatic peripheral vascular disease. Bypass occlusion after revascularisation is estimated to be up to 30% within 5 years.1 Within the first month, it is attributed mainly to technical errors or inadequate outflow tracts.2 Post-procedural angiography is mainly effective in identifying technical problems.1 Mid-term graft patency can be predicted by measuring peak systolic velocity into the graft using duplex ultrasound during follow-up: a graft with flow velocity lower than 45 cm/s should be considered at risk of occlusion.2,3 However, this technique is not of common use in surgical daily practice.
Wave-intensity analysis (WIA) is a new descriptive approach studying wave propagation and reflection in arteries.4 It integrates velocity with pressure and calculates energy carried by the arterial wave (per unit area and per unit of time). This has particularly been well described in healthy ascending aortas, carotid, brachial and coronary arteries using invasive and non-invasive approaches.5–9 Indeed, acquisition protocols initially used invasive measurements of pressure and flow but more recently, ultrasound-based techniques in conjunction with applanation tonometry9–11 have been used.
In healthy aortas, three major waves have been commonly described at the level of the ascending aorta.8 A first forward-traveling compression wave (FCW) occurring during left ventricular ejection is characterized by simultaneous rise of pressure and flow velocity. A second smaller backward-traveling compression wave (BCW) resulting from wave reflections on distal sites of arterial wall properties mismatch such as discontinuities, bifurcations, peripheral networks or occlusion sites. An increase in total pressure but deceleration of blood flow is observed. A third forward-traveling expansion wave (FEW) results from the decrease of left ventricular contraction at the end of the systole, contributing to deceleration of blood flow. This latter wave is characterized by a reduction of pressure as well as velocity.
Peripheral pathological conditions have shown influence on the central wave-intensity data. In the presence of stiff arteries as described in elderly patients, increased wave reflections with early arrival have been observed, accounting for systolic hypertension.12,13 Infra-renal aortic clamping induces earlier and longer reflected wave.14 It could be responsible for an increase in left ventricular afterload and systolic work. The sole study of wave propagation and reflection conditions in distal arteries has been carried in healthy femoral arteries.15
In our study, we have assessed wave propagation in distal arteries of four patients with symptomatic peripheral artery disease prior and after revascularisation. Taken together, these cases illustrate that the use of wave intensity approach is effective in defining peripheral arterial lesions and confirming the adequacy of revascularisation.
Methods
The study concerns WIA performed on 4 in-hospital patients who underwent endovascular or surgical bypass procedures for symptomatic peripheral vascular disease. In the angioplasty group, we considered one patient with mild femoral stenosis while another had short femoral occlusion. Local anesthesia of the groin with antegrade common femoral artery puncture was performed for these endovascular procedures. In the surgical group, similar data acquisition was performed on two cases of long femoral occlusion treated with an above-knee prosthetic (Propathen®, Gore Medical, Flagstaff, USA) femoro-popliteal bypass. Measurements were performed by common femoral and popliteal puncture. General anesthesia and epidural anesthesia were respectively performed for these patients.
All subjects provided informed consent and the study was approved by the Institutional Ethics committee.
We acquired simultaneous endovascular assessment of pressure and velocity waveforms before and after revascularisation using Combowire® XT9515 (Volcano Corp, Rancho Cordora, USA), a 0.014-inch diameter guide wire equipped with pressure and velocity sensors on its tip. The acquisition frequency was 100 Hz for velocity and 200 Hz for pressure. Measurements were performed over a period of at least 5 cardiac cycles in the common femoral, superficial femoral (if patent), popliteal arteries and also in the surgical bypass when this latter was performed (Fig. 1). Positioning the guide wire has been performed under radioscopic control in order to check its right positioning in the center of the vessel. Mean diastolic diameter of these arterial segments was measured post-operatively with ultrasound images (IE33 xMatrix system, Ultrasound Machine, Philips®, Drachten, The Netherlands). Signals were post-treated within the Matlab programming environment (Matlab®, MathWorks, Natick, USA). As the ECG signal was not recorded simultaneously with pressure and velocity, ensemble averaging was performed by maximizing the cross-correlation coefficient between each waveform using the first 100 ms of rapid rise in pressure (P) and velocity (U) in order to provide simultaneous representative P and U waveforms over a cardiac cycle.9 Signals were smoothed using a 17-points third-order Savitzky–Golay filter.16
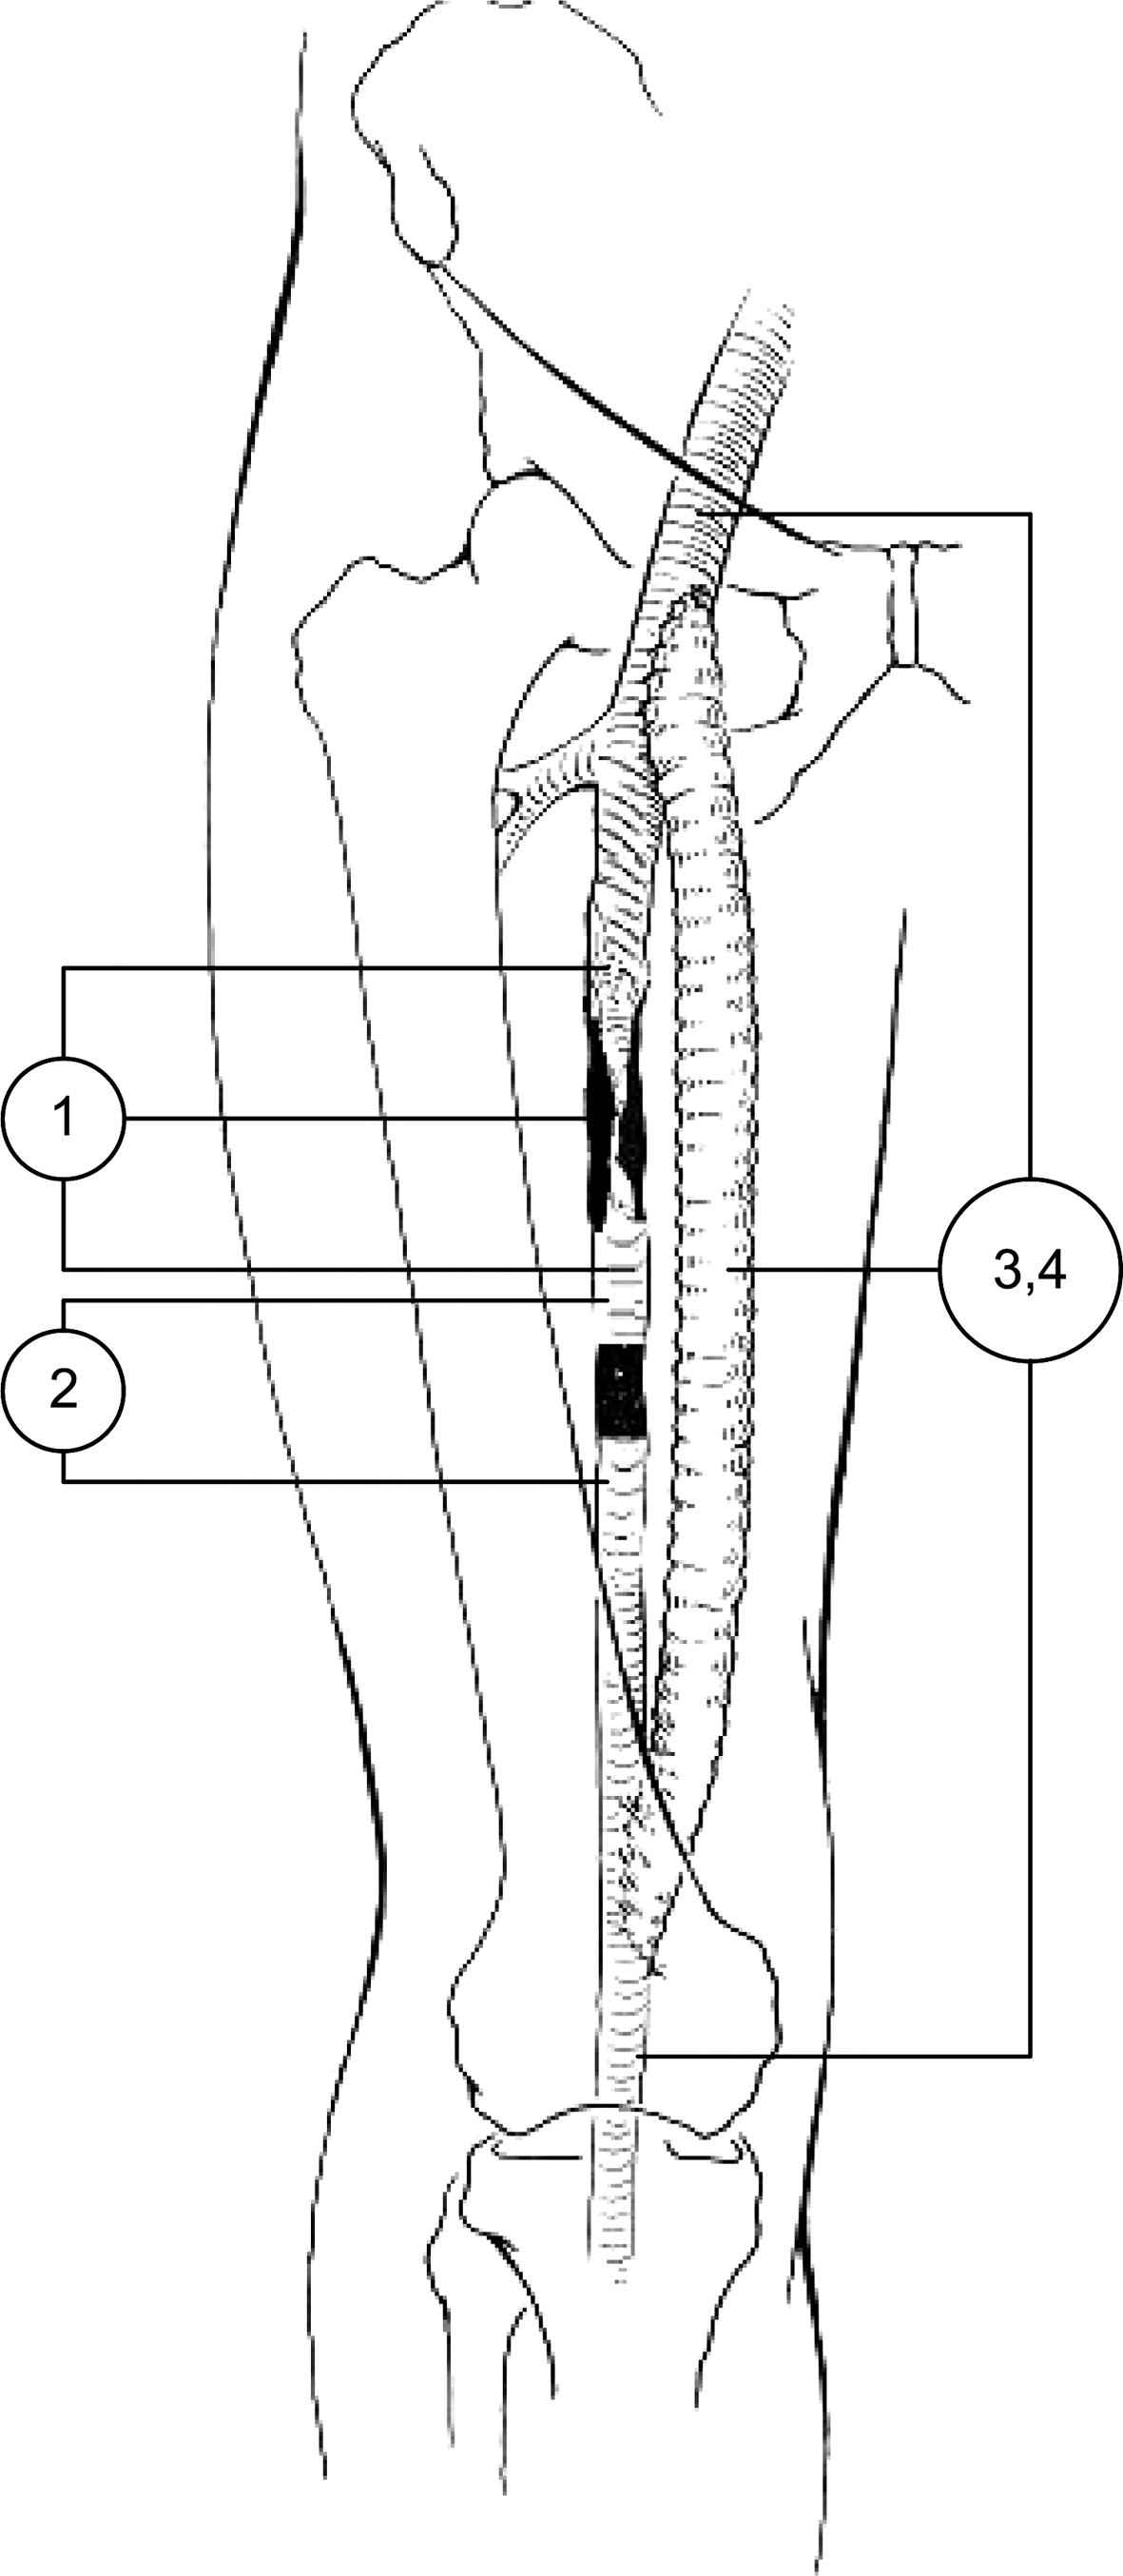
Location of the treated lesions and sites of measurements along the superficial femoral artery and bypass graft for the four cases.
Wave intensity (dI; W/m2/s2) was defined as the absolute energy carried by the wave per unit cross-sectional area of the vessel and normalized by the sampling time (dt).4 Mathematically, this is expressed as:
As the two parameters of pressure and velocity were acquired at different sampling times, a common sampling time of 100 Hz was used to normalize calculation of dI.17 The cumulative intensity (I; W/m2/s) is defined as the amplitude of the integral of the wave intensity over a cardiac cycle.
The forward (dIf) and backward (dIb) propagating waves can be determined from the following equations derived from the method of characteristics4:
Duplex ultrasound analyses were performed at postoperative day 3 in order to record the graft peak systolic velocity, which is considered to be the most specific parameter reflecting mid-term bypass patency.1
Results
Table 1 provides clinical data and main hemodynamic parameters for the following 4 cases.
| Case 1 – Moderate stenosis. Age 70, Rutherford II. | ||||
| Upstream | Inside stenosis/stent | Downstream | ||
| PRE ABI = 0.7 |
Mean P (mmHg) | 95.7 | 92.2 | 92.2 |
| Mean V (cm/s) | 22.6 | 27.3 | 24.5 | |
| c (m/s) | 22.0 | 6.7 | 14 | |
| IFCW (kW/m2/s) | 62.8 | 88.5 | 50.2 | |
| IBCW (kW/m2/s) | −1.36 | −13.3 | −4.36 | |
| POST ABI = 0.9 |
Mean P (mmHg) | 92.5 | 21.7 | 105.0 |
| Mean V (cm/s) | 26.8 | 104.7 | 20.8 | |
| c (m/s) | 13.7 | 20 | 21 | |
| IFCW (kW/m2/s) | 100.0 | 68.8 | 64.7 | |
| IBCW (kW/m2/s) | −5.3 | −4.0 | −4.1 | |
| Case 2 – Short occlusion. Age 71, Rutherford III. | ||||
| Upstream | Downstream | |||
| PRE ABI = 0.65 |
Mean P (mmHg) | 136.9 | 120 | |
| Mean V (cm/s) | 8.2 | 8.8 | ||
| c (m/s) | 43.5 | 14.6 | ||
| IFCW (kW/m2/s) | 20.6 | 7.35 | ||
| IBCW (kW/m2/s) | −0.50 | −0.82 | ||
| POST ABI = 0.8 |
Mean P (mmHg) | 138.1 | 143.3 | |
| Mean V (cm/s) | 27.1 | 19.4 | ||
| c (m/s) | 7.7 | 16 | ||
| IFCW (kW/m2/s) | 47.7 | 33.4 | ||
| IBCW (kW/m2/s) | −9.54 | −1.45 | ||
| Case 3 – Long occlusion. Age 78, Rutherford IV. | ||||
| Com. femoral | Bypass graft | Popliteal | ||
| PRE ABI = 0.4 |
Mean P (mmHg) | 100.4 | / | 50.0 |
| Mean V (cm/s) | 10.8 | / | 8.1 | |
| c (m/s) | 23.0 | / | 12.0 | |
| IFCW (kW/m2/s) | 46.0 | / | 1.29 | |
| IBCW (kW/m2/s) | −3.47 | / | −0.04 | |
| POST ABI = 0.85 |
Mean P (mmHg) | 86.5 | 91.1 | 95.7 |
| Mean V (cm/s) | 10.9 | 9.0 | 9.3 | |
| c (m/s) | 19.0 | 23.0 | 36 | |
| IFCW (kW/m2/s) | 33.8 | 30.2 | 23.8 | |
| IBCW (kW/m2/s) | −2.31 | −1.78 | −0.62 | |
| Case 4 – Long occlusion. Age 87, Rutherford V. | ||||
| Com. femoral | Bypass graft | Popliteal | ||
| PRE ABI = 0.2 |
Mean P (mmHg) | 66.2 | / | 28.1 |
| Mean V (cm/s) | 14.4 | / | 16.5 | |
| c (m/s) | 10.5 | / | 4.2 | |
| IFCW (kW/m2/s) | 39.9 | / | 0.28 | |
| IBCW (kW/m2/s) | −3.08 | / | −9.7e−5 | |
| POST ABI = 0.5 |
Mean P (mmHg) | 78.9 | 56.5 | 49.7 |
| Mean V (cm/s) | 27.8 | 6.5 | 9.0 | |
| c (m/s) | 7.9 | 25.0 | 22.0 | |
| IFCW (kW/m2/s) | 62.9 | 9.1 | 10.0 | |
| IBCW (kW/m2/s) | −4.93 | −0.09 | −0.052 | |
Clinical data (age, Rutherford classification22 and ankle-brachial index-ABI) and hemodynamic indices at the different locations pre and post treatment for the four cases: mean pressure (P) and mean velocity (U) over a cardiac cycle, pulse wave velocity (c), cumulative intensity I of the forward compression wave (FCW) and backward compression wave (BCW).
WIA in the case of a moderate stenosis
The case concerns a short (12 mm long), 65% (diameter based) superficial femoral artery stenosis.
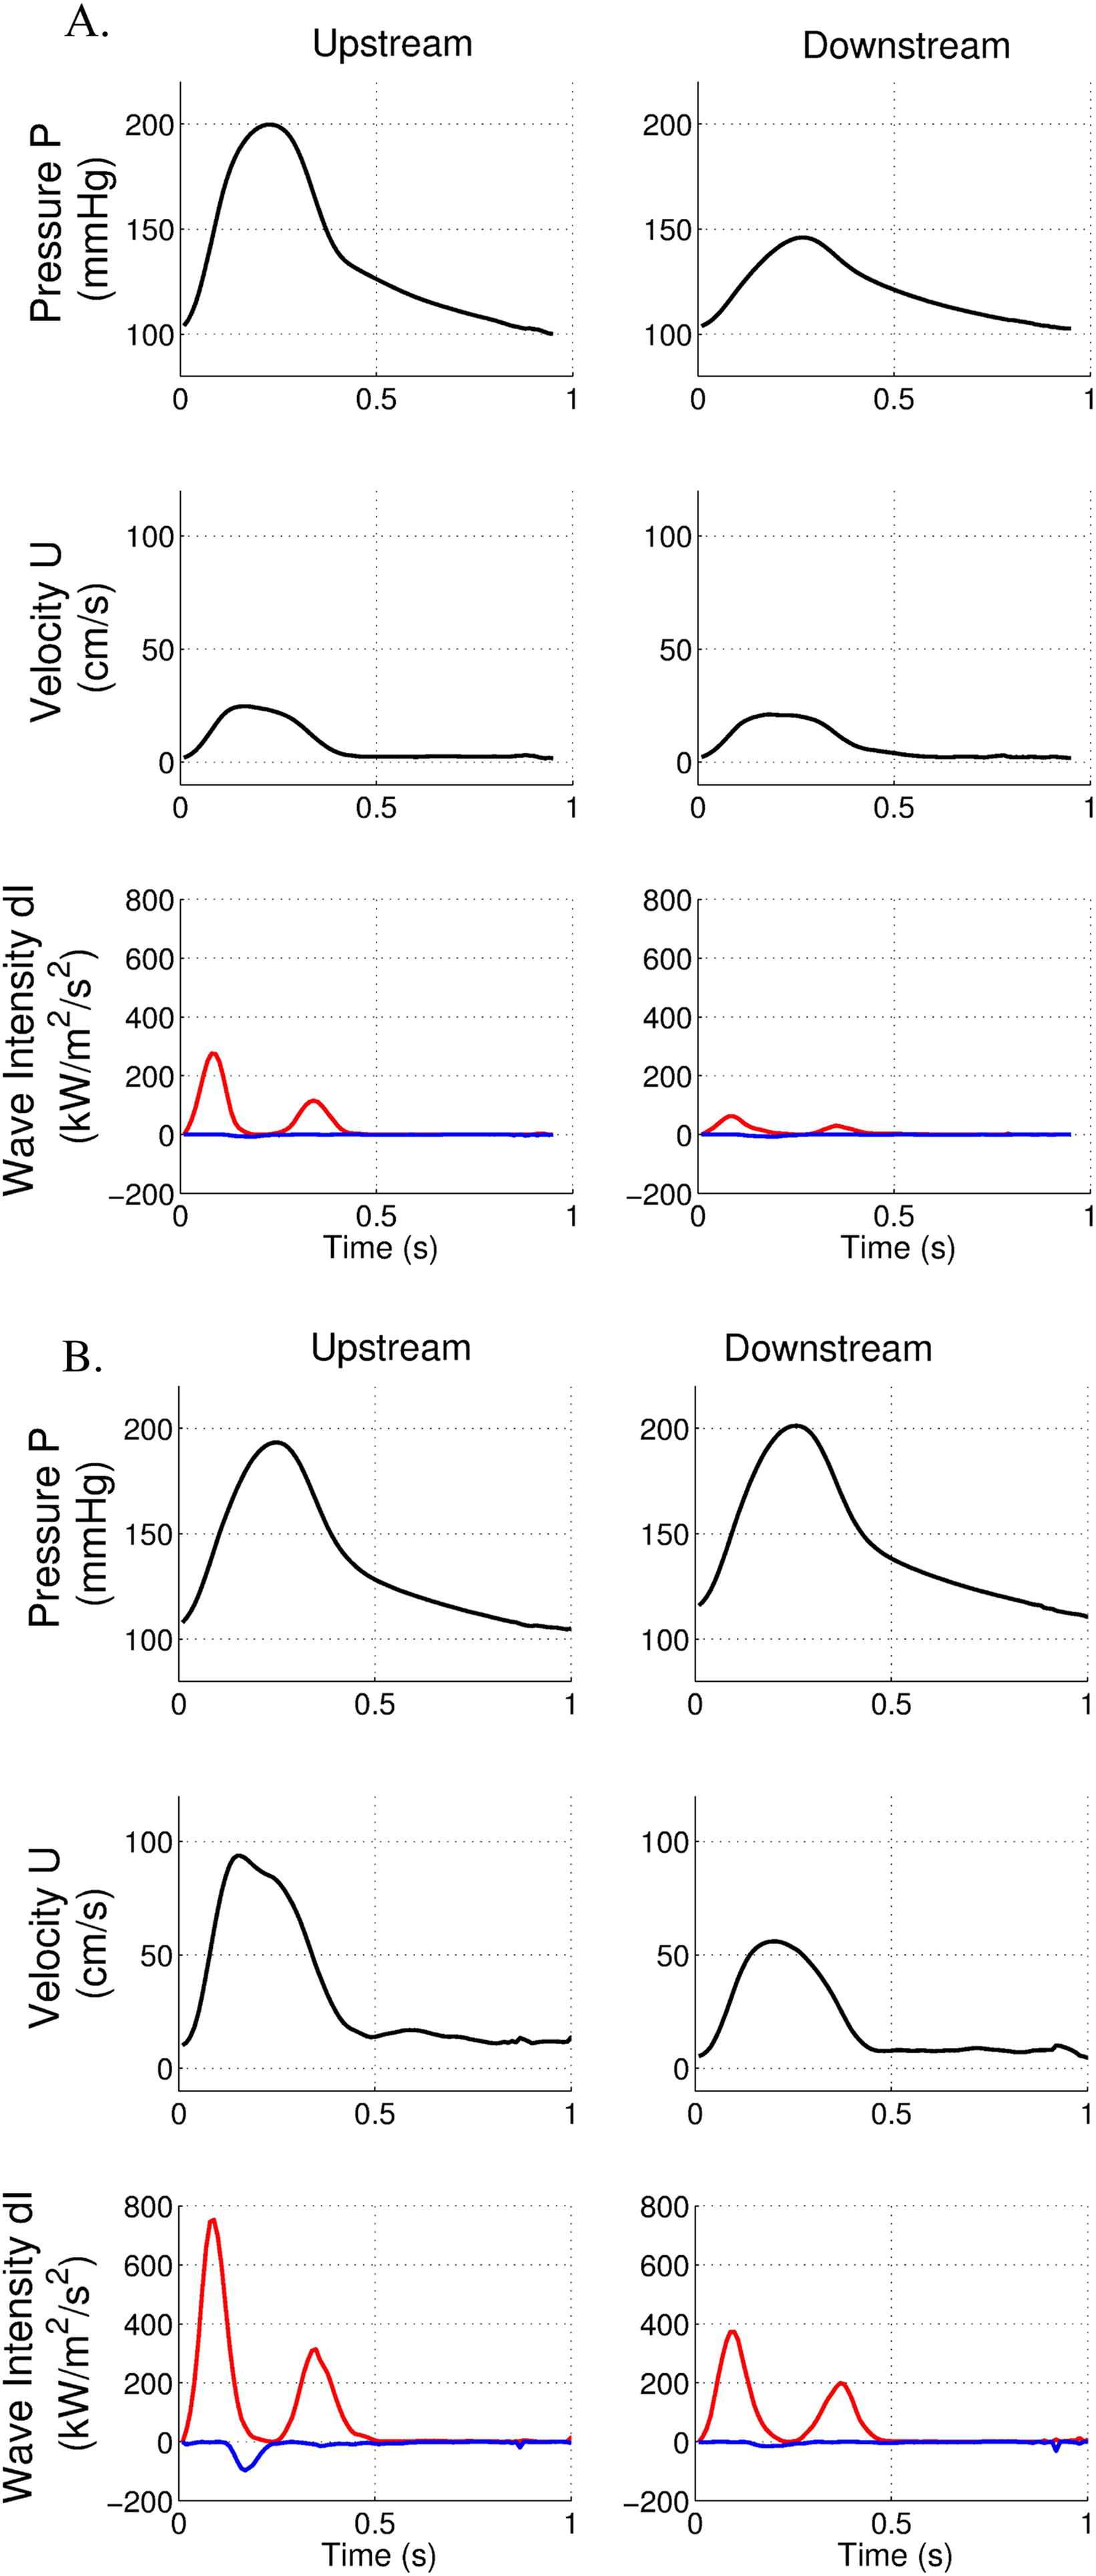
We observed an increase in peak velocity across the lesion (117 cm/s vs 69 cm/s) and a minor decrease in peak pressure below the stenosis (154 mmHg compared to 168 mmHg) (Fig. 2A). FCW cumulative intensity slightly decreased below the stenosis (50.2 kW/m2/s compared to 62.8 kW/m2/s, i.e. decrease of 20%). BCW cumulative intensity was minor in common femoral artery (−1.36 kW/m2/s), (IBCW/IFCW = 2.1%).

Pressure, velocity and wave intensity patterns in the presence of a moderate femoral stenosis before (A) and after stenting (B). Data are acquired above, at the level and below the stenosis. Forward wave intensity is in red, backward wave intensity is in blue.
After angioplasty and stenting, peak pressures were similar above and below the stent (Fig. 2B). FCW cumulative intensity was restored below the stent (64.7 kW/m2/s). BCW cumulative intensity was higher above the stent (−5.3 kW/m2/s).
WIA in the case of an occlusion
In this case, we studied a short (8 mm in length) occlusion of superficial femoral artery. The guide wire has been passed through the lesion, allowing measurements downstream to the lesion. Despite the occlusion, downstream peak pressure was moderately affected (146 mmHg compared to 199 mmHg) (Fig. 3A). Moreover, peak velocity remained unchanged above and below the occlusion. FCW cumulative intensity was reduced below the occlusion (7.35 kW/m2/s compared to 20.6 kW/m2/s, i.e. decrease of 64%). BCW cumulative intensity was low (−0.5 kW/m2/s), (IBCW/IFCW = 2.4%).
Pressure, velocity and wave intensity patterns in the presence of a short femoral occlusion before (A) and after stenting (B). Data are acquired above and below the occlusion. Forward wave intensity is in red, backward wave intensity is in blue.
After stenting, downstream peak pressure was similar to the upstream segment (Fig. 3B). Reperfusion induced an increase in velocity within the femoral artery. However, peak velocity was diminished below the stent (56 cm/s vs 89 cm/s). FCW cumulative intensity was nearly identical above and below the stent (33.4 kW/m2/s compared to 47.7 kW/m2/s above the stent). BCW cumulative intensity above the stent was higher than before stenting (−9.54 kW/m2/s).
WIA in the case of a long occlusion with adequate surgical revascularisation
The patient had a long superficial femoral artery occlusion (20 cm length). A major drop in peak pressure and in peak velocity was observed below the occlusion (Fig. 4A). As expected, FCW cumulative intensity was dramatically reduced below the occlusion (1.29 kW/m2/s compared to 46 kW/m2/s, i.e. decrease of 97%). There was a moderate BCW intensity in the common femoral artery (−3.47 kW/m2/s), (IBCW/IFCW = 7.5%)
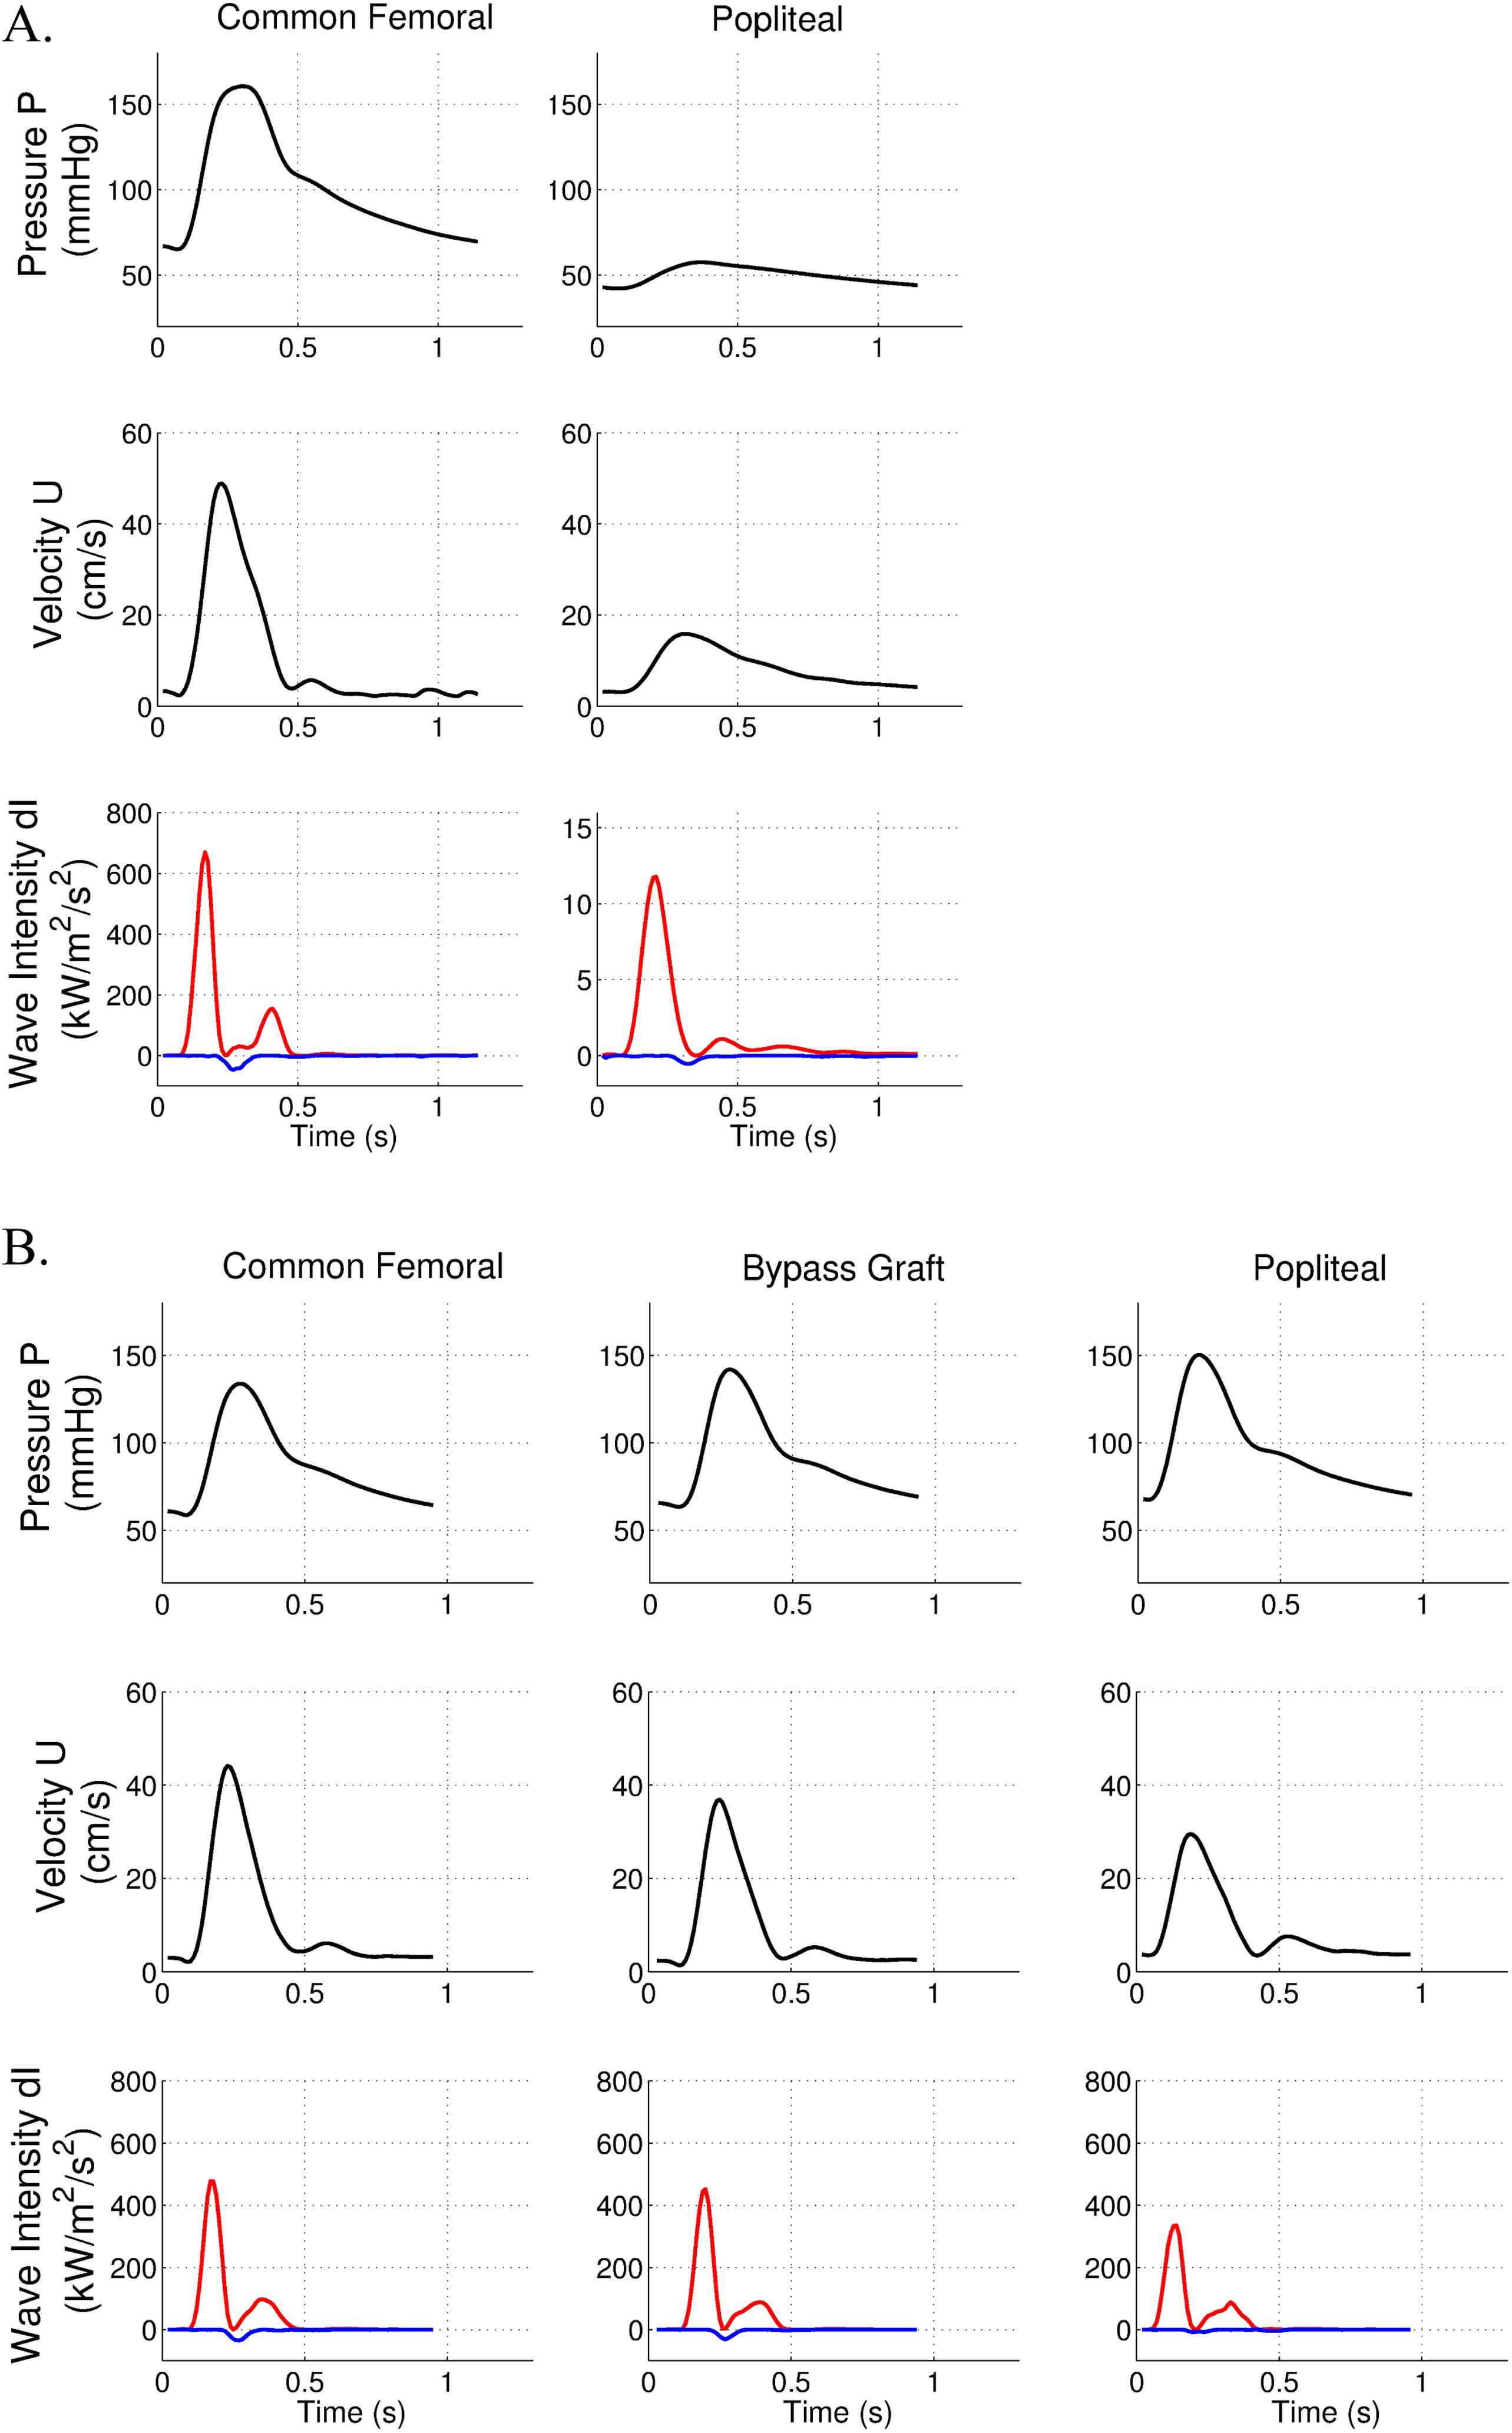
Pressure, velocity and wave intensity patterns in the presence of a long femoral occlusion and adequate revascularisation. Forward wave intensity is in red, backward wave intensity is in blue. A. Data are acquired before surgery in the common femoral and popliteal arteries. B. Data are acquired after the surgical bypass in the common femoral, bypass and popliteal arteries.
After femoro-popliteal bypass, no decrease in peak pressure was observed while the peak velocity data showed a slight drop in the popliteal artery (Fig. 4B). Interestingly, FCW cumulative intensity was of similar amplitude along this arterial axis (common femoral: 33.8 kW/m2/s, bypass graft: 30.2 kW/m2/s, popliteal: 23.8 kW/m2/s). These data demonstrate the absence of energy loss in the bypass graft. BCW cumulative intensity was not affected by surgical revascularisation.
The quality of revascularisation was assessed by routine postoperative duplex ultrasound. This confirmed bypass patency, with a peak systolic velocity measurement of 93 cm/s in the bypass, suggesting adequate revascularisation.
WIA in the case of a long occlusion with postoperative persistent intensity absorption
This case is another long superficial femoral occlusion (30 cm length). As in the previous case, the hemodynamic data showed major drops in peak pressure and peak velocity below the occlusion (Fig. 5A). Similarly, FCW cumulative intensity was strongly decreased after the occlusion (0.28 kW/m2/s compared to 39.9 kW/m2/s, i.e. decrease of 99%). BCW cumulative intensity was moderate (−3.08 kW/m2/s) in the common femoral artery (IBCW/IFCW = 7.7%).
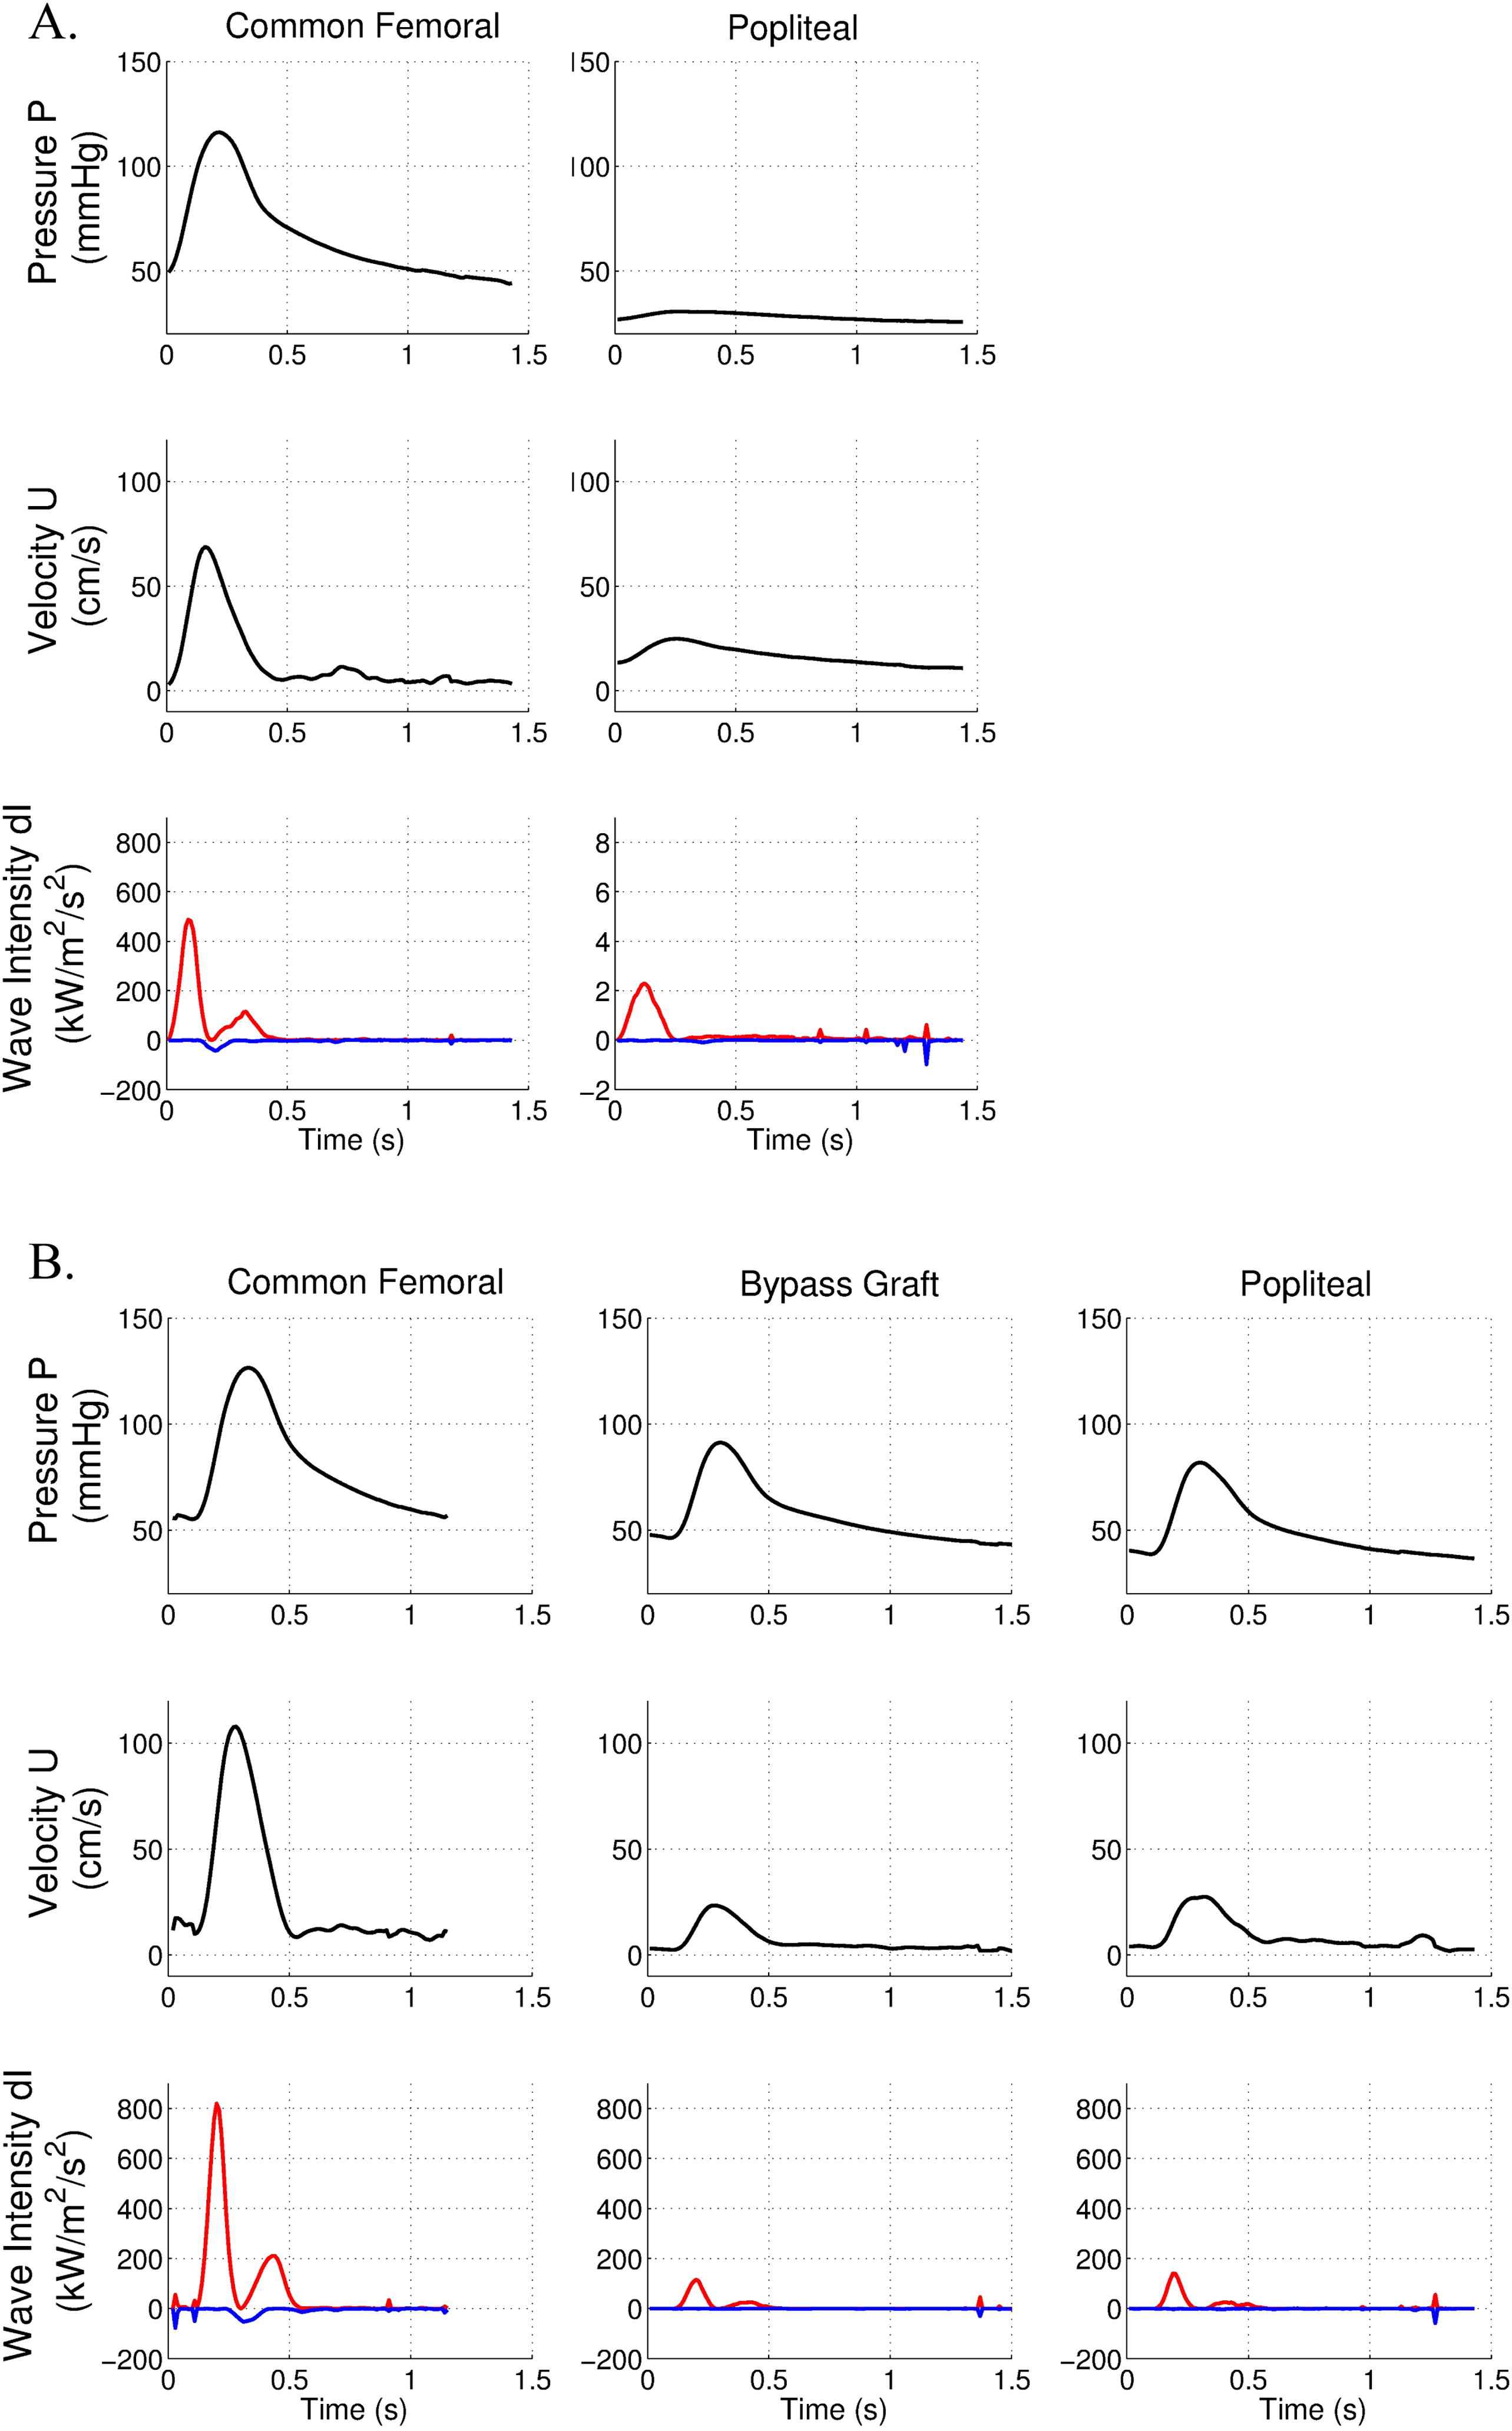
Pressure, velocity and wave intensity patterns in the presence of a long femoral occlusion and inadequate revascularisation. Forward wave intensity is in red, backward wave intensity is in blue. A. Data are acquired before surgery in the common femoral and popliteal arteries. B. Data are acquired after the surgical bypass in the common femoral, bypass and popliteal arteries.
After performing above-knee femoro-popliteal bypass, we observed a significant persistent drop in peak velocity but a mild drop in peak pressure along the femoral axis (Fig. 5B). FCW cumulative intensity was significantly reduced in the popliteal artery (10.0 kW/m2/s compared to 62.9 kW/m2/s in the common femoral artery). This major wave-intensity absorption in the bypass graft was suggestive of an inadequate revascularisation.
This was confirmed by low peak systolic value of 41 cm/s measured by duplex ultrasound within the bypass. Reflected waves remained similar after surgery.
The angiographic results of both bypasses looked satisfactory (Fig. 6).
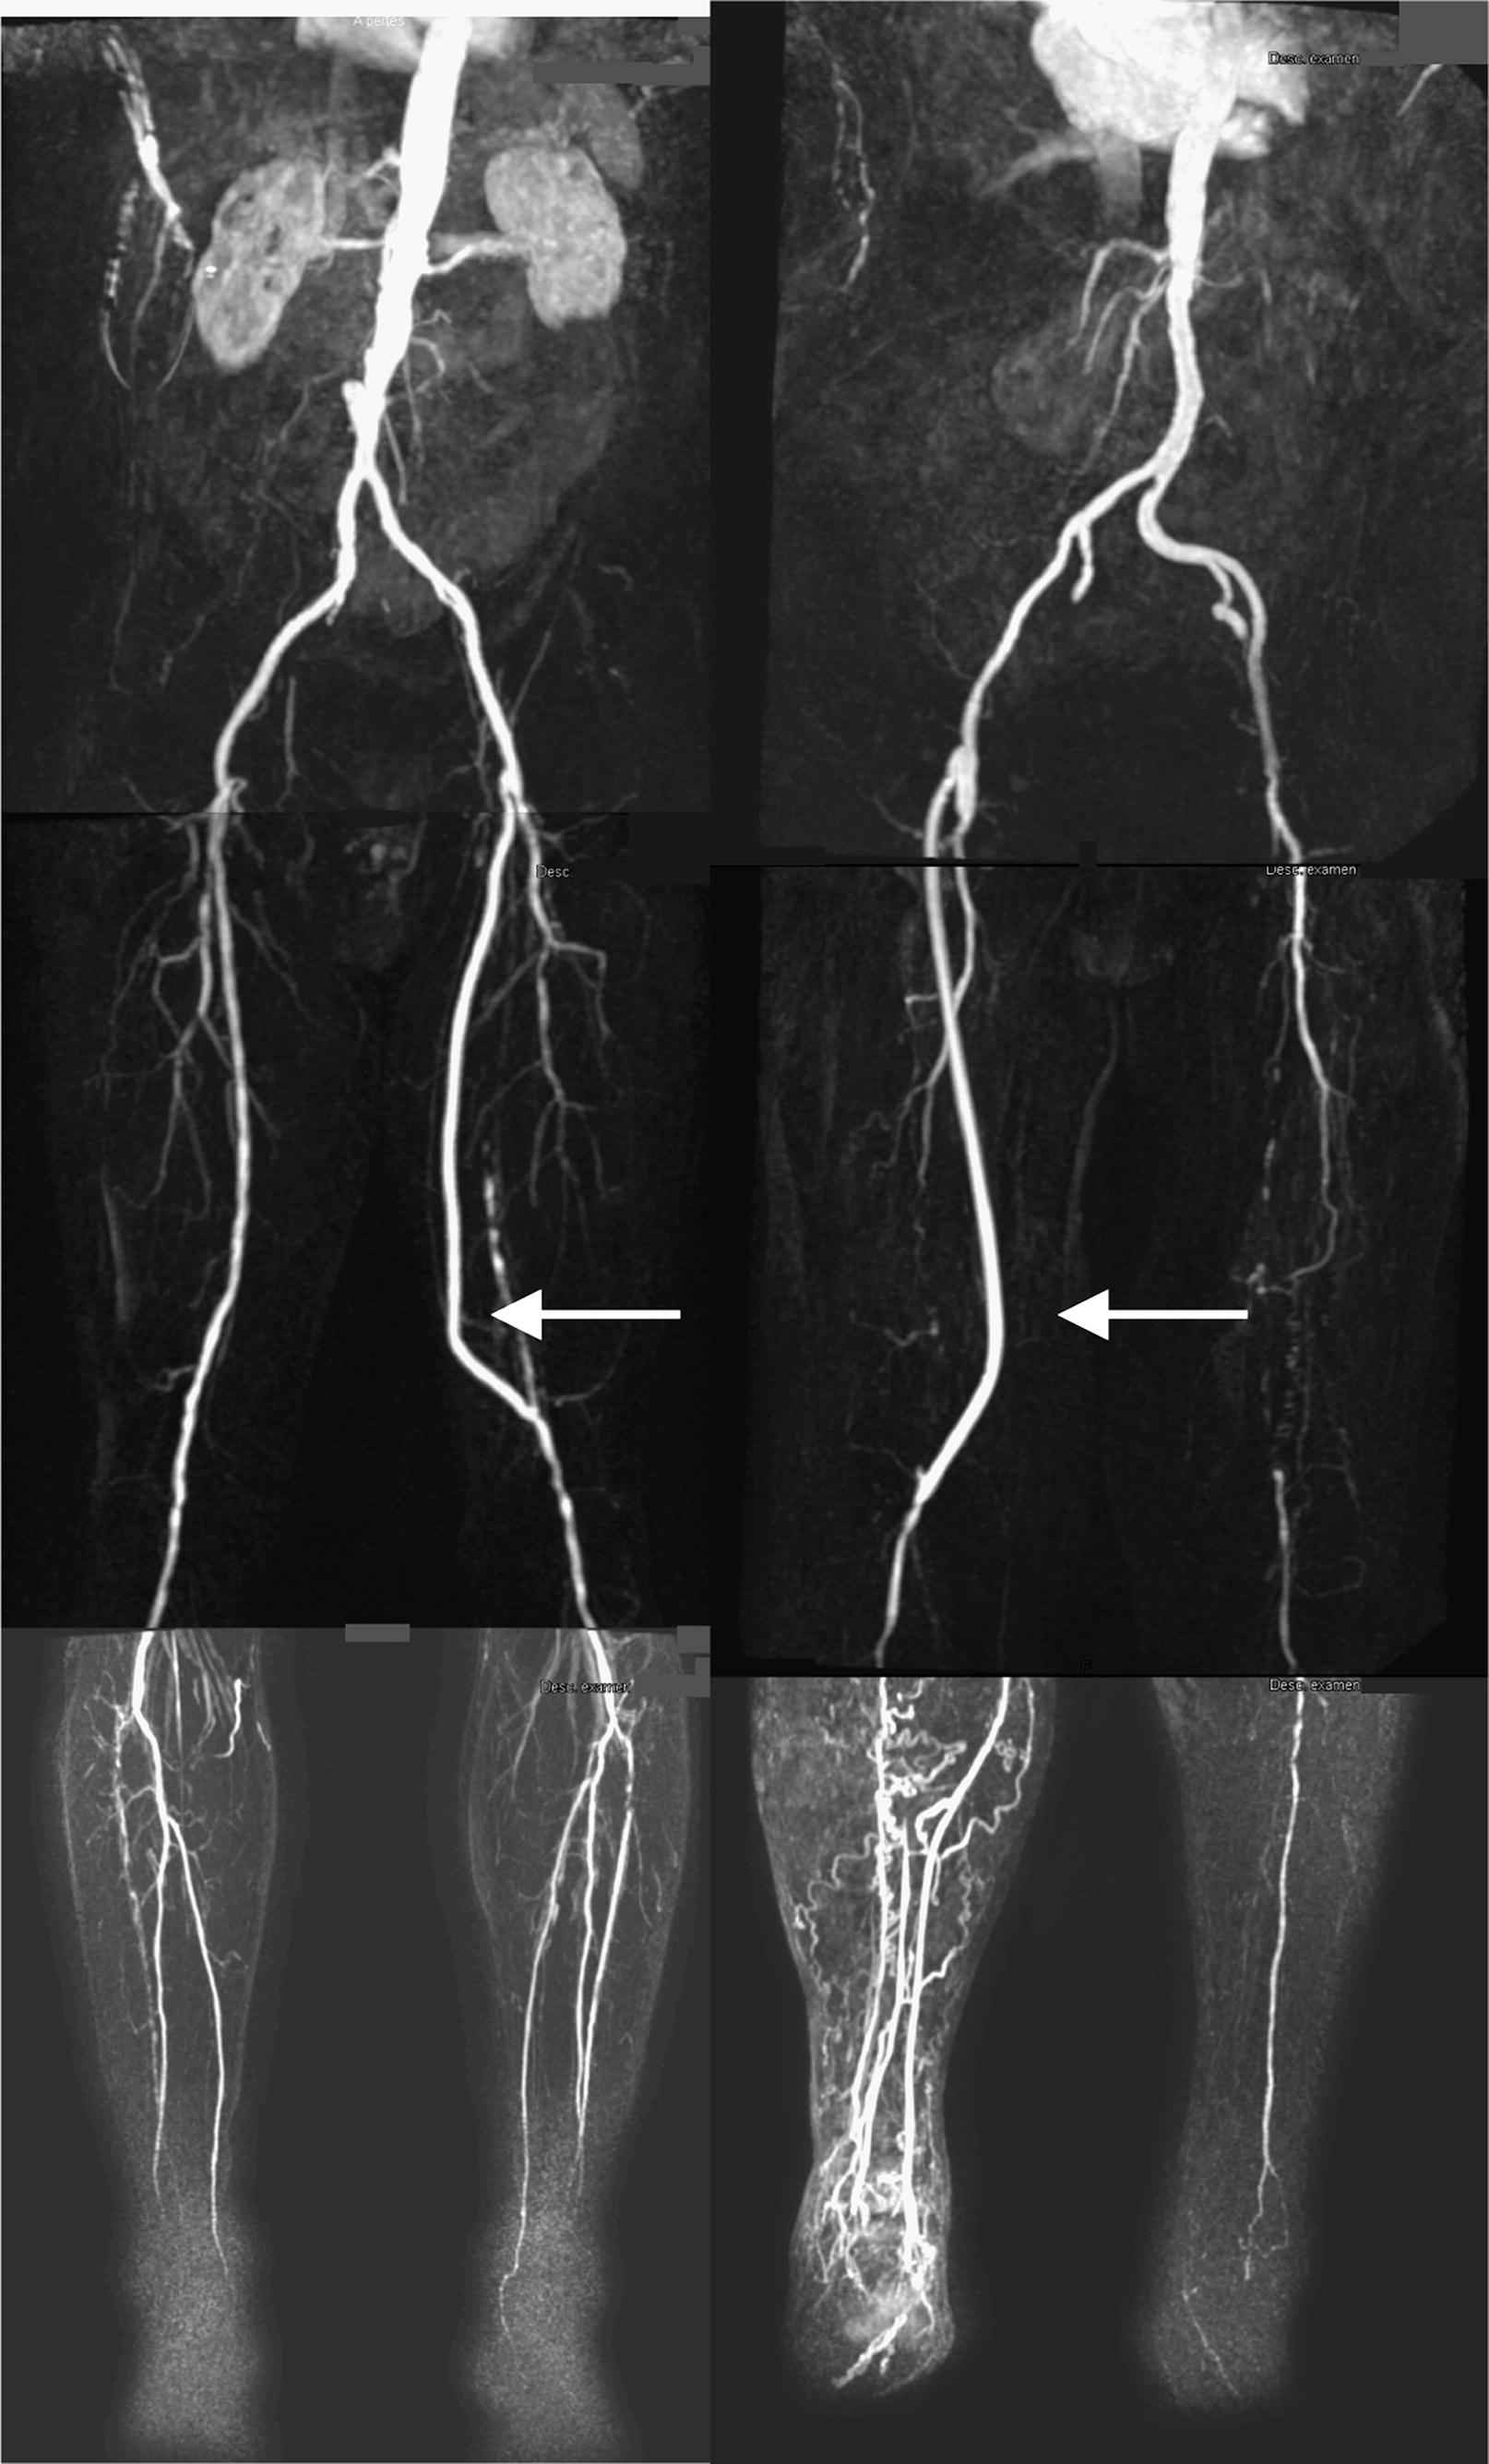
Postoperative angio-MRI of femoro-popliteal bypasses. Left panel refers to the patient with adequate revascularisation. Right panel refers to the patient with persistent intensity absorption. Arrows indicate the bypass.
Discussion
Our study demonstrates the feasibility and usefulness of per-procedural wave analysis in peripheral vascular disease.
Performing wave-intensity analysis in pathological lower limb vessels requires adaptive recording techniques. Indeed, pressure wave measurement by applanation tonometry is not suited for deep and calcified arterial segments due to their lack of elasticity. This has been clearly demonstrated in our previous work regarding pulse wave velocity analysis in pathological arteries.18 To our knowledge, such simultaneous (pressure and velocity) invasive hemodynamic assessment in pathological peripheral arteries has not been performed before. The use of a very thin guide wire with mounted sensors requires perfect positioning of this guide at the center of the vessel, in order to provide right pressure and mainly right flow sensing. Although using a radioscopic control to check the right positioning of the sensor, blood stream may induce slight movement of the wire and non-optimal measurement mainly for the flow rate.
We have shown here through 4 clinical cases that this technique can help clinicians to better define the hemodynamic consequence of vascular lesions. Absorption of forward waves through a lesion was more important in case of long occlusive disease (97% and 99%) compared to short occlusion (64%) and stenosis (20%). Backward compression waves were higher in case of extensive femoral disease (IBCW/IFCW = 7.5% and 7.7%) compared to local disease (IBCW/IFCW = 2.1% and 2.4%). We think that in case of extensive disease, as the main femoral axis is completely occluded, the forward waves will be totally reflected. For local diseases, as blood can still flow downwards, the forward waves will be only partially reflected. We also showed that adequate stenting or surgical bypass restored forward wave intensity to the same extent. We observed that the reflected wave intensity might be important in case of stenting. Stents, while being more rigid than the arterial wall, induce local wall elasticity mismatch that generate these reflections. In the case of surgical bypasses, backward waves intensities were not higher than before surgery, indicating that, in the clinical cases studied, the bypass grafts lead blood flow without much arterial wall properties mismatch and not so many reflections.
An important finding of this study is that persistent absorption of forward wave intensity observed per-operatively in the bypass corresponded to low postoperative velocity data. Indeed in our second bypass case, a low peak systolic velocity in the bypass was measured at duplex ultrasound, indicating a risk of occlusion.2 Post-procedural angiography showed normal anatomical reconstruction but this has only permitted to rule out technical problems. This discrepancy highlights the importance of considering morphological results in conjunction with hemodynamic data within the bypass. Per-operative duplex ultrasound has been demonstrated to be the best indicator for assessing technical adequacy of the surgical bypass.1 However, its routine use is uncommon because it is not user-friendly during surgery. We suggest simultaneous pressure and velocity measurement by per-operative intravascular wire method to assess the adequacy of surgical reconstruction. This technique can be easily and quickly performed in practice. It could be considered analogous to the ‘fractional flow reserve’ method used by interventional cardiologists to assess coronary stenosis and the results of percutaneous revascularisation.19–21 The WIA, while integrating both data of pressure and velocity, appears to be a relevant method to assess per-procedural adequacy of revascularisation.
Our hypothesis for the bad hemodynamic results in the second bypass case is that the distal network was very poor compared to the first bypass case, resulting in an inadequate outflow tract (Fig. 6). Blood flow into the bypass is therefore exposed to a highly resistive network, reducing blood flow velocity with stable pressure values.
In conclusion, WIA technique, while integrating both data of velocity and pressure, should be considered by practitioners to assess adequate peripheral reconstructive surgery.
Conflict of interest
None.
Acknowledgments
VL is MD. PhD Student of IREC and CB is MD post-doctoral fellow of IREC. MW is research fellow of the Fonds National de la Recherche Scientifique (F.N.R.S, Belgium).
This work was supported by grants from
References
Cite this article
TY  - JOUR
AU  - Valérie Lacroix
AU  - Marie Willemet
AU  - Emilie Marchandise
AU  - Christophe Beauloye
AU  - Robert Verhelst
PY  - 2013
DA  - 2013/04/02
TI  - Use of wave intensity analysis during peripheral revascularisation: Lessons from cases study
JO  - Artery Research
SP  - 93
EP  - 102
VL  - 7
IS  - 2
SN  - 1876-4401
UR  - https://doi.org/10.1016/j.artres.2013.03.001
DO  - 10.1016/j.artres.2013.03.001
ID  - Lacroix2013
ER  -