
Bilateral difference of superficial and deep femoral artery haemodynamic and anatomical parameters
- DOI
- 10.1016/j.artres.2013.09.001How to use a DOI?
- Keywords
- Femoral arteries; Pulsatile blood flow; Bilateral difference; Haemodynamics; Ultrasound Doppler
- Abstract
Clinically revealed, non-uniform distribution of peripheral vascular diseases throughout the arterial tree suggests that haemodynamic forces can modulate the endothelial dysfunction. In the present study the bilateral differences of deep (DFA) and superficial (SFA) femoral artery blood velocity waveform parameters were examined in relation to artery ramification patterns and subject anthropometry. Young, sedentary women (n = 25; age 21.2 ± 3.6 years) were enrolled. Anthropometric data as well as systemic cardiovascular parameters (arterial pressure, heart rate and cardiac output) and Doppler velocity spectrum of SFA and DFA were instantly registered in rest conditions. The study revealed a slight and mutually independent anatomical and morphometric asymmetries of femoral arteries in paired legs which were fluctuation type (do not display any directional tendency). Also bilateral asymmetry of artery haemodynamic parameters was related neither to subjects’ anthropometric nor artery anatomical parameters. The magnitude of haemodynamic asymmetry is larger for retrograde linear velocity, retrograde shear rate and oscillatory index – parameters which reflect peripheral resistance of microcirculatory bed and thus has a rather functional origin. Possibly, the observed unilateral changes of femoral artery haemodynamic parameters of young healthy and sedentary women could be considered as a sign of potential genesis of artery structure pathological changes in older age.
- Copyright
- © 2013 Association for Research into Arterial Structure and Physiology. Published by Elsevier B.V. All rights reserved.
- Open Access
- This is an open access article distributed under the CC BY-NC license.
Introduction
A recently apparent fact is the crucial role of endothelium in the control of vascular functions. Clinically revealed, non-uniform distribution of peripheral vascular diseases throughout the arterial tree1–3 suggests that localised factors, such as haemodynamic forces, can modulate the endothelial function. Contemporary studies suggest that atherosclerosis occurs mainly in artery regions that experience disturbances in blood flow such as: low flow, flow separation, flow reversals and turbulence4,5 and the most prone site for atherogenesis is the bifurcation of common femoral artery.6,7 A number of previous studies have shown significant impact of the arterial geometry on local arterial haemodynamics.8,9
Over several decades, extensive studies regarding the morphometry and anatomy of the femoral arteries in paired legs were carried out using cadaver dissection, magnetic resonance imaging (MRI) and computer angiography (CT-angio) techniques.10–13 However in prediction and further prevention of atherogenesis, in addition to investigation of morphometric parameters, the assessment of endothelial function is crucially important.
One of the most common and widely used vascular examinations still remains to be the ultrasound Doppler. Despite the fact that Doppler blood flow measurement in the lower extremities has become a routine procedure in the past years, little is known about existing bilateral differences of blood flow velocity waveform in the femoral arteries and its association with factors such as the geometry of the arterial tree, daily physical activity level and the anthropometric parameters.
In the present study we examined bilateral differences of deep (DFA) and superficial (SFA) femoral artery blood velocity waveform parameters (artery haemodynamic parameters) in relation to artery ramification patterns and subject anthropometry in resting conditions.
We hypothesised that the geometry of the arterial tree would account for the observed asymmetry of artery haemodynamic parameters in paired legs.
Methods
Subjects
A group comprising twenty five women in age 21.2 ± 3.6 years was enrolled in the study. All subjects were informed about forthcoming procedures and gave written informed consent. Prior to experiment the subjects compiled the questionnaire in which physical activity level and personal health history were assessed. The women enrolled in study were young healthy non-smokers with a sedentary life style (students performing moderate physical activity 5–7 h per week, most of the day time spent in seated posture). All measurement procedures were performed during the follicular phase (days 5–14) of their menstrual cycle, (oral contraception was allowed). All testing was completed in an air-conditioned laboratory at a temperature of 24–26 °C in one day. Twelve hours prior to experiment subjects were refrained from exercise, alcohol and caffeine. Study protocol was approved by the Review Board at the University of Latvia and conformed to the EU standards according to the Declaration of Helsinki.
Anthropometric measurements
The anthropometric measurements were taken by the same investigator to ensure reliability. Weight and height measurements were performed, and BMI was calculated. Skin-fold data were obtained using a digital skin-fold calliper Plicometer (Gima, Italy) and recorded to the nearest 0.2 mm. The circumferences of the limbs were measured using a non-elastic tape measure (cm) (Hokanson Inc. USA) and followed the Anthropometric Indicators Measurement Guide.14 Quadriceps muscle mass was estimated using anthropometric muscle volume measurement reported previously.15,16
Ultrasound examination and monitoring of systemic haemodynamic parameters
All measurements were performed during rest conditions on subjects in a dorsal recumbent position with slightly extended (30°) and comfortably supported legs. Beat-to-beat changes in systolic (Psys), diastolic (Pdia) and mean arterial blood pressure (Pmean), cardiac output (CO) and heart rate (HR) were measured from the left middle finger using finger photoplethysmography system Finometer (MIDI, FMS, Netherlands). In addition to ensure higher reliability of measurements, brachial arterial pressure and heart rate were acquired by an electronic sphygmomanometer UA-787(A&D Inc., Japan) from the right upper arm at a 3 min repetition rate. The ultrasound examination procedures were performed sequentially on left and right legs in order to acquire imaging data of the superficial femoral (SFA) and deep femoral (DFA) arteries. Prior to Doppler measurements, branching and geometry of femoral arteries were assessed in B-mode. A high-resolution portable Doppler ultrasound system Titan(Sonosite, USA) equipped with a linear array transducer L38 operating at imaging frequencies of 5–10 MHz and DVI frame grabber (DVI2USB Epiphan Systems, Canada, at 25 fps, resolution 640 × 480 pixels) was utilised in this study. A series of transverse and longitudinal images of the arteries were acquired by scanning a triangle distally from the iliac artery, approximately 4 cm above inguinal ligament. All video data were recorded to AVI file for further offline analyses. After collecting the data regarding geometry of the femoral arteries the Doppler velocity measurements were performed.
Blood flow velocity was recorded from the proximal straight portion of the superficial and deep femoral arteries at the insonation angle of 60° with a sample volume encompassing the entire lumen. During recording the B-mode and Doppler mode were switched intermittently, resulting in a frame sequence containing a short series of B-mode vessel diameters and Doppler velocity waveforms.17 In such a manner 3–4 min long recording fragments were obtained twice from each leg and each artery, with at least 15 min time interval between recordings.
Further analyses (artery wall-tracking and waveform edge-detection) of ultrasound video sequence (AVI file) were performed using a Matlab (MathWorks Inc.) based custom developed dedicated analyses software, Artery_Ultrasound, developed by our group.17
Examination of artery morphometric and haemodynamic parameters
All the data acquired in this study has been assigned to codenames and treated by an investigator who has not been involved in other experiment procedures.
Off-line data analyses were performed in three major stages: in the first, B-mode ultrasound image sequences were processed in order to estimate the branching of the femoral triangle, in the second detailed analyses of the Doppler velocity waveform and diameter changes were performed, and the final stage provided processing of systemic haemodynamic variables joining them in a beat-to-beat manner to the systemic haemodynamic variables acquired by Finometer Midi. Four qualitative artery morphometric parameters were assessed during offline analyses: 1) Type of origin of DFA regarding ramification direction – five principal directions proposed,18 Table 1, 2) Origin of the lateral circumflex artery (LCA) and 3) Medial circumflex artery (MCA) – origin either DFA or CFA accordingly, 4) The distance to the origin of the lateral or medial circumflex femoral artery from the origin of DFA accordingly.19
| Parameters | Cases on the left side | Cases on the right side |
|---|---|---|
| Aspect of DFA origin | ||
Posterolateral |
58.33% | 37.5% |
Posterior |
29.16% | 58.33% |
Lateral |
8.33% | 4.16% |
Posteromedial  |
4.16% | 0% |
| Direct LCA origin | ||
From DFA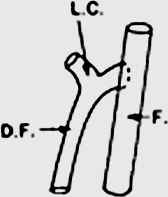 |
95.83% | 91.66% |
From CFA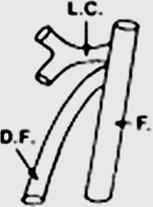 |
4.16% | 8.33% |
| Direct MCA origin | ||
From DFA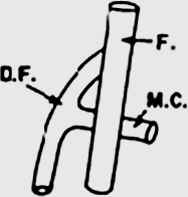 |
91.66% | 95.83% |
From CFA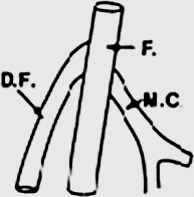 |
8.33% | 4.16% |
| DFA length | ||
| 0–10 mm | 41.67% | 41.67% |
| 11–20 mm | 41.67% | 45.83% |
| 21–30 mm | 16.67% | 12.5% |
Ultrasonography acquired anatomical characteristics of femoral arteries in paired legs (n = 25). Table illustrates aspect of deep femoral artery (DFA); classification of18, distance of origin of Medial or lateral circumflex from origin of DFA represents straight segment of DFA.
Bilateral comparison of femoral artery ramification patterns.
An automated computation of the artery haemodynamic parameters (Doppler velocity waveform indices)20 and baseline diameter (average diameter over period of measurement time in rest conditions) have been performed. The resolution for diameter measurements has been considered 0.17 mm, which was selected based on reproducibility of within-subject measurements in our laboratory- which is slightly higher than reported by others.21 The following haemodynamic parameters were selected and included in further analyses:
- 1)
Average mean velocity (VMean) – by averaging the entire Doppler spectrum.
- 2)
Time averaged antegrade velocity (VAnt) by averaging the antegrade part of Doppler spectrum.
- 3)
Time averaged retrograde velocity (VRet) by averaging the retrograde part of Doppler spectrum.
- 4)
Peak systolic antegrade blood velocity (VMax) computed as the highest velocity measured in the Doppler spectrum of a cardiac cycle;
- 5)
Peak retrograde velocity (VMin) – computed as the lowest velocity value in the Doppler spectrum of a cardiac cycle;
- 6)
Mean volumetric blood flow (Q) – calculated from the product of the arterial cross-sectional area, obtained from artery diameter (D) and VMean using the following equation: Q = 1/4 × Π × D2 × VMean × 60;
- 7)
Time average shear rate
- 8)
Antegrade shear rate
- 9)
Retrograde shear rate
- 10)
Oscillatory shear index (OSI) was computed as described by23 from shear rates according to equation :
- 11)
Systolic acceleration time (TACC) – computed as the time from the start of flow to the forward flow peak;
- 12)
Systolic deceleration time (TDEC) – computed as the time from the forward flow peak to the reverse flow peak.
Statistics
Statistical analyses have been performed on SigmaPlot (Systat Software. Inc., USA) and Matlab (Mathwork. Inc., USA) software. Thirty data points (corresponded to 30 heart beats) from each subject were randomly selected from 2 to 4 min data fragments containing artery waveform and systemic haemodynamic data for further statistical analyses. Within-subject comparisons of bilateral difference of artery diameter, waveform parameters and systemic haemodynamic variables were assessed by repeated measurement analysis of variance (RM ANOVA) with a post-hoc Tukey test comparing four data sets (two legs, two repetitions). In addition, the effect of size difference between artery waveform parameters in paired legs was examined using Cohen’s d test. A significant effect has been considered at d ≥ 1.2.24 The degree of parameter asymmetry between legs was assessed using paired leg parameter ratios,-bilateral asymmetry ratios. The leg with higher parameter values were denoted as a denominator, thus giving parameter lower value/parameter higher value. Calculated in this manner, the bilateral asymmetry ratio lies between zero (absolute asymmetry) and unity with maximum symmetry when paired parameters are exactly equal.25 The determination of possible association between asymmetry of ramification pattern and asymmetry of artery haemodynamic parameters were made using general linear model analyses (GLM). Associations between degree of asymmetry and subject anthropometric parameters were evaluated as Pearson’s correlation coefficients (r). Data are provided as means ± SEM or percentages. The p value at <0.05 was considered statistically significant.
Results
Subjects anthropometry
Anthropometric measures of subjects left and right legs did not differ (accuracy ± 1 mm) therefore only single leg measures have been selected for further volume and muscle mass calculations. The mean values of study group were following: height 1.68 ± 0.06 m, (range 1.53–1.78 m); weight 56.75 ± 5.6 kg (range 48–67 kg); BMI 20 ± 1.61 kg/m2 (range 17–23 kg/m2); thigh volume 7.18 ± 1.98 L, (range 2.6–10.5 L); calf volume 2.29 ± 0.45 L, (range 1.2–3.2 L); calculated m.quadriceps mass 2.54 ± 0.61 kg, (range 1.15–3.58 kg).
Artery ramification patterns
Statistical analyses revealed significant laterality of femoral artery ramification patterns in paired legs. Thus in one third of all cases (33.3% cases) we observed asymmetric DFA origin. On the right side in the majority of cases (58% cases) the deep femoral artery originated at the posteriolateral aspect of the common femoral artery but on the left side at posterior aspect (58% cases), while other aspects were found less frequently, as seen in Table 1.
We found no noticeable differences in the origin of the lateral circumflex artery (LCA) and medial circumflex artery (MCA) on both sides- that is, the difference between left and right sides were only in 12.5% cases. One fifth (20.5%) of all examined women showed bilateral difference of the deep femoral artery segment length (distance from the origin of the deep femoral artery to the first branching). However there was not any relation between subject anthropometric parameters and artery ramification patterns.
Artery diameter
The femoral arteries diameters of (SFA and DFA) were different on the right and left sides. In 70% of cases bilateral differences of DFA baseline diameter were observed and 72% in SFA baseline diameter. The larger SFA diameter on the right side was observed in 65% of woman and the larger DFA diameter on the left side in 54%.
There were no notable relations between artery diameter and subject anthropometric parameters, except subject weight and right SFA diameter (r = 0.45; p = 0.02). A group comprising young women demonstrated similar asymmetry degrees for both arteries (DFA:0.95 ± 0.06; SFA:0.92 ± 0.07). However the SFA artery showed a slight tendency to be less asymmetric.
Systemic haemodynamic parameters
In the entire sonographic examination protocol (four trials) all systemic cardiovascular parameters showed high stability (paired t-test; P < 0.001). However for some parameters there was a slight intersubject variability. The average values representing the subject group were as follow: systolic arterial blood pressure (Psys) 118.35 ± 7.15 mmHg, range 101.35–125.69 mmHg; diastolic arterial pressure (Pdia) 67.50 ± 6.19 mmHg, range 60.77–75.96 mmHg; mean arterial pressure (PM) 87.31 ± 6.76 mmHg, range 76.58–100.97 mmHg; heart rate (HR) 70.66 ± 11.00 bpm, range 60.05–90.83 bpm, cardiac output (CO) 4.89 ± 0.98 L/min, range 3.15–6.46 L/min and total peripheral resistance (TPR) 1100.04 ± 248.78 dyn, (range 882.45–1480 dyn).
Artery haemodynamic parameters
In general, arterial haemodynamic parameters varied between the subjects and between the paired legs within an individual. Analyses (RM ANOVA) revealed that in 95% subjects at least one haemodynamic parameter differed within paired legs. Considering that arterial pressure, heart rate and cardiac output were equal, there was a convincing difference (p < 0.05) between the arterial haemodynamic parameters recorded from arteries on contralateral sites, and there were no differences of parameters obtained ipsilateraly. Individual values of arterial haemodynamic parameters in paired legs for both SFA and DFA are depicted in Fig. 1, whereas computed magnitudes of bilateral differences differ across parameters, as illustrated in Table 2.
| Haemodynamic parameters | SFA artery | DFA artery | ||
|---|---|---|---|---|
| % Asym. | Bilat. ratio. | % Asym. | Bilat. ratio. | |
| Linear velocity VMean (cm/sec) | 69% | (0.80 ± 0.13) | 66% | (0.81 ± 0.12) |
| Antegrade linear velocity VAnt (cm/sec) | 71% | (0.86 ± 0.10) | 71% | (0.82 ± 0.11) |
| Retrograde linear velocity VRet (cm/sec)* | 65% | (0.80 ± 0.12) | 40% | (0.64 ± 0.24) |
| Acceleration time TACC (sec) | 73% | (0.90 ± 0.08) | 46% | (0.85 ± 0.13) |
| Deceleration time TDEC (sec) | 50% | (0.92 ± 0.08) | 16% | (0.94 ± 0.05) |
| Mean shear rate |
65% | (0.79 ± 0.13) | 75% | (0.80 ± 0.12) |
| Antegrade shear rate |
57% | (0.83 ± 0.10) | 50% | (0.81 ± 0.11) |
| Retrograde shear rate |
77% | (0.76 ± 0.13) | 66% | (0.62 ± 0.27) |
| Blood flow Q (ml/min) | 65% | (0.81 ± 0.12) | 63% | (0.77 ± 0.16) |
| Peak linear velocity VMax (cm/sec) | 54% | (0.88 ± 0.07) | 75% | (0.89 ± 0.08) |
| Minimal linear velocity VMin (cm/sec) | 58% | (0.84 ± 0.10) | 54% | (0.73 ± 0.20) |
| Oscillatory index OSI* | 31% | (0.79 ± 0.09) | 67% | (0.61 ± 0.24) |
Percent of cases showing statically significant bilateral difference of femoral artery (SFA and DFA) haemodynamic parameters (% asym.) and mean value of degree of asymmetry (bilat. ratio). As the bilat. ratio tends towards unity (1), symmetry on both sides increases. The group (n = 25) mean parameter values ± std are depicted in table. The statistically significant (P < 0.05) difference between bilat. ratios of different femoral arteries (SFA and DFA) are denoted by asterisks.
Assessment of femoral artery haemodynamic parameters asymmetry degree.
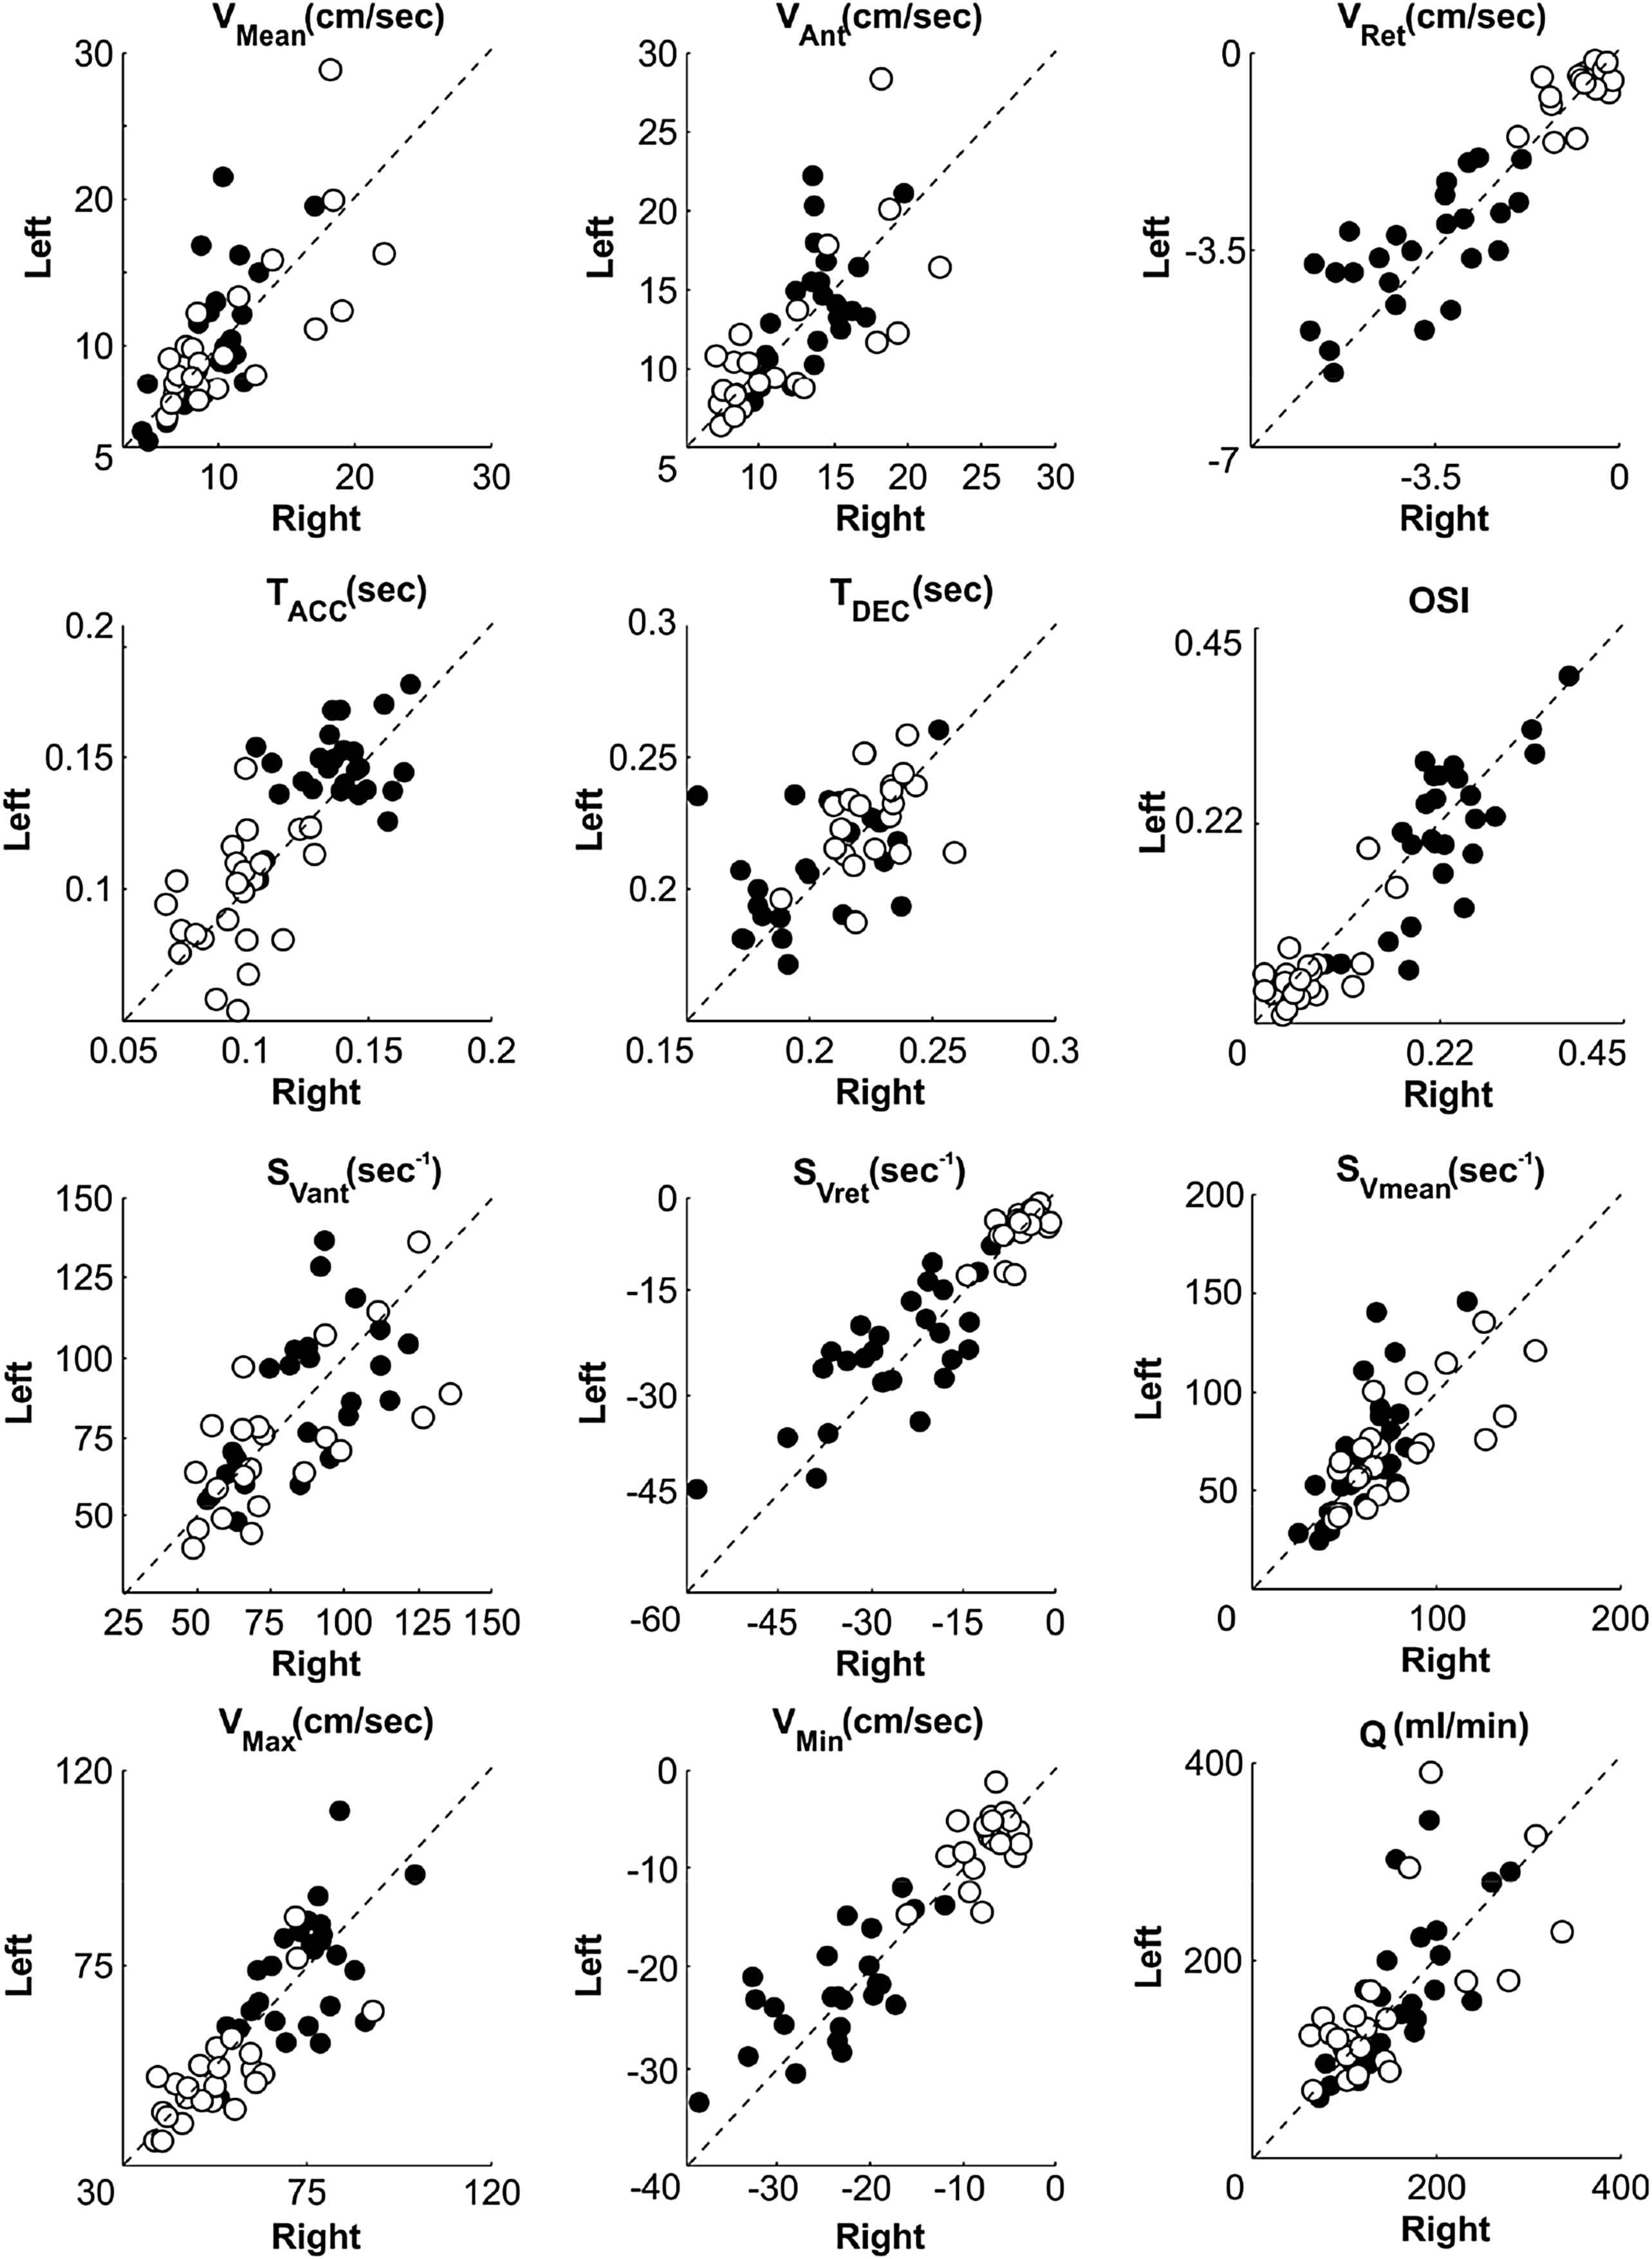
Scatter graph illustrates subjects (n = 25) individual mean values of haemodynamic parameters (see Table 2) obtained from superficial (black circle) and deep (white circle) femoral arteries on both sides. Dotted line indicates entire bilateral symmetry, deviation from line- increasing degree of asymmetry.
Correlation and GLM analyses did not confirm statistically significant relations or interactions between femoral artery asymmetry as a factor or any anatomical differences (factor 2) in paired legs.
Moreover we did not observe any significant correlation between the magnitude of bilateral ratios for artery haemodynamic parameters (either SFA or DFA), and artery diameter, except in an inconsiderable correlation (r = 0.4; p = 0.04) in few cases when the haemodynamic parameters were directly calculated from diameter data, such as blood flow (product of linear velocity and crossectional area).
Discussion
To date there are a relatively small number of studies regarding bilateral asymmetry of the large conduit arteries.26–28 The present study revealed a slight, hence statistically significant, haemodynamic, anatomical and morphometric asymmetry of femoral arteries in paired legs of young and healthy women with a sedentary life style (students). To the best of our knowledge, this is the first study utilising an ultrasonography method for bilateral assessment of femoral artery anatomy (ramification) and its possible impact on asymmetry of artery haemodynamic and morphometric parameters.
While comparing the anatomical differences of arteries, the most significant asymmetry was observed in the types of origin of deep femoral artery, as can be seen in Table 1. The results are consistent with the findings obtained in previous studies exploiting cadaver dissection techniques.18,19,29 According to our study the most common site of origin of the deep femoral artery was from the posterolateral aspect of the common femoral artery and the distance from origin of the deep femoral artery to the first perforating artery (straight segment) was in the range of 11–30 mm, showing slight bilateral asymmetry.
Despite many variations of LCA and MCA branching patterns30 which are described in literature, in the present study branching patterns were grouped in two most frequently observed types: 1) LCA and MCA origin from DFA; and 2) LCA and MCA origin from CFA. Relatively small asymmetry was observed in the origin of lateral circumflex artery and medial circumflex artery – most women have these arteries originated from DFA, as also reported else where.10,11,19,31,32 Contrary results have been obtained in the study on a population of Turkish people employing CT Angiography (n = 300) – women demonstrated more cases of LCA and MCA originated from CFA.33
Observation regarding female artery diameter data implies that the detected bilateral difference was significant even in the case when the selected discrimination criterion (value) was relatively low (3% difference; which corresponds to approx. 0.17 mm) in comparison to SFA diameter changes during routine FMD test; which is approximately 3–7% from basal level.34,35
However, experiments performed in the Thijssen laboratory, have much lower variation and potentially higher discrimination criterion (1.5%),21,36 which is closer to the variability used in our study. Conversely, in the studies assessing asymmetry of vertebral arteries performed by Mysior et al. the discrimination criterion was set to 25%, which corresponds to 0.5 mm37 and taking into account such tolerance, healthy subjects couldn’t exhibit differences in diameters on both body sides. Similar to ours, recent studies confirm the relationship between femoral artery (SFA and DFA) diameters and body mass(weight),38 but no relationship with the thigh volume and muscle mass.39 We can hypothesize that the weak or absent correlation between variations of different artery morphometric parameters suggest that the observed anatomical and morphometric asymmetries are fluctuation type (rather than directional) – they do not display any directional tendency but is a type of developmental instability.40,41
Another important issue addressed in the present study was registering basal values of artery haemodynamic parameters (Ultrasound Doppler velocity waveform indices). Interestingly the registration of Doppler waveform parameters in lower legs is yet to become a routine procedure, however there still are a limited number of papers describing quantification of artery haemodynamics utilising Doppler waveform analyses.20 And very often the reported values differ from author to author. This question is particularly important as novel indices in the near future might have wide clinical implications. Therefore we prioritised obtaining unbiased SFA and DFA artery haemodynamic parameters which would characterise young healthy, sedentary women.
The basal values of femoral artery haemodynamic parameters obtained presently are consistent with those reported in previous studies. Thus, shear rate values of SFA obtained from healthy young volunteers (males and females) by high-resolution magnetic resonance phase contrast blood velocity measurement techniques were similar to ours.23 This finding is in agreement with Newcomer SC et al.,22 Thijssen DH et al.34 However SFA basal mean shear rate reported by Wu et al.23 utilising MRI was much larger, while in the study of Thijssen DH et al.35 was slightly lower. Superficial femoral artery oscillatory index basal values were similar in our study and study of Bell J et al.42 and Wu et al.23
Basal shear rates and oscillatory indexes obtained in our study are consistent with those reported by other authors.43 The possible explanation of minor discrepancies between basal values reported in different studies would be related to the subject group and utilised methodology. Comparing the basal values of haemodynamic parameters in different femoral arteries (DFA and SFA) (see Table 3); they differ, reflecting distinctive properties of vascular beds and peripheral resistances. The degree of bilateral difference (bilateral ratio) of femoral artery flow related parameters identified in the present study was similar to that obtained by Mayrovitz during segmentary thigh blood flow measurement, and (such difference) has been defined as the asymmetry of healthy subjects.25
| Haemodynamic parameters | SFA artery (mean ± std) | DFA artery (mean ± std) | Significance level |
|---|---|---|---|
| Linear velocity VMean (cm/sec) | 9.60 ± 3.88 | 10.67 ± 5.02 | p = 0.508 |
| Antograde linear velocity VAnt (cm/sec) | 13.33 ± 3.46 | 11.29 ± 4.83 | p = 0.001 |
| Retrograde linear velocity VRet (cm/sec) | −3.82 ± 1.37 | −0.67 ± 0.46 | p = 0.001 |
| Acceleration time TACC (sec) | 0.14 ± 0.02 | 0.10 ± 0.02 | p = 0.001 |
| Deceleration time TDEC (sec) | 0.21 ± 0.02 | 0.23 ± 0.02 | p = 0.001 |
| Mean shear rate |
63.93 ± 27.44 | 79.74 ± 36.88 | p = 0.036 |
| Antegrade shear rate |
89.46 ± 25.72 | 83.21 ± 34.66 | p = 0.080 |
| Retrograde shear rate |
−25.10 ± 10.41 | −4.91 ± 3.22 | p = 0.001 |
| Blood flow Q (ml/min) | 162.06 ± 64.30 | 148.35 ± 77.79 | p = 0.224 |
| Peak linear velocity VMax (cm/sec) | 74.02 ± 12.52 | 52.23 ± 12.38 | p = 0.001 |
| Minimal linear velocity VMin (cm/sec) | −23.37 ± 6.70 | −7.39 ± 3.07 | p = 0.001 |
| Oscillatory index OSI | 0.22 ± 0.08 | 0.06 ± 0.04 | p = 0.001 |
Mean values of haemodynamic parameters for superficial (SFA) and deep femoral (DFA) arteries. Data pooled together from both sides. The sedentary young women group (n = 25; 2 sides) mean value ± standard deviation are reported in table. p value refers to a Man–Whitney Rank sum test, significant p values are indicated with bold.
Comparison of SFA and DFA haemodynamic parameters.
An important finding is that bilateral asymmetry of artery haemodynamic parameters is related neither to subjects’ anthropometric nor artery anatomical parameters and the magnitude of this asymmetry is larger for retrograde linear velocity, retrograde shear rate and oscillatory index. As reported in the literature these parameters reflect peripheral resistance of microcirculatory bed.44 This can be especially marked for DFA, which supply quadriceps muscles and bilateral differences of haemodynamic parameters could be related to functional differences of this muscles.
There is evidence that the microcirculatory vascular bed (density of capillaries, vascular tone of precapillary sphincters, and haemodynamic vascular resistance) in skeletal muscles reflects local morpho- function properties of muscle, which conversely depends on exercising (every day activity) of the muscle, and may not be uniform on paired legs. This assumption is supported by the Study of Lanshammar et al confirming bilateral asymmetry of muscle force and muscle composition in young non-athletic woman.45
Contrary to our hypothesis, which postulates that geometry of the arterial tree would account for the observed asymmetry of artery haemodynamic parameters, the significant shear difference in femoral arteries of paired legs indirectly suggests that the observed asymmetry is of rather functional nature. This conclusion is supported by the finding that a lowered basal shear rate indicates to adaptation to exercise and the increased arterial diameter,46 whereas increased basal shear rate points to adaptation to sedentary life style and reduced diameter.47 Also it has been shown that physical activity related factors can enhance alterations of mean shear rate, such as vascular resistance of thigh and calf,48 elevated blood pressure in the leg vasculature during seated posture (our subjects were sedentary), and changes of artery curvature.22,49 That is why a slightly lower (and different) daily activity of one leg and a slightly higher of the other may cause a small, hence statistically significant, asymmetry, which appears negligible in comparison to the bilateral difference of peripheral artery disease patients. We can merely speculate that the presently observed unilateral changes of femoral artery haemodynamic parameters of young healthy and sedentary women could be considered as an origin of potential genesis of artery structure pathological changes later in older age.
Conclusions
Most of the young and healthy women (roughly 80%) leading a sedentary life style exhibited small anatomical (the direction and type of the ramification, morphometric artery diameters) and haemodynamic (blood flow velocity related parameters) bilateral asymmetry of femoral arteries in paired legs.
Limitations of the study
Despite the careful planning of experimental design and the accurate implementation of all procedures, there are still several limitations that may potentially interfere with present findings and therefore results should be interpreted with precaution.
Arterial structure has been detected via sonography; however additional imaging methods (such as CT or MRI) might be used as a reference. Although it is known that a high-resolution ultrasound system used by an experienced specialist can provide results with comparatively high precision concerning the structure and geometry of a large artery,50 presently most (peripheral artery disease) PAD diagnosis are made using ultrasound Doppler.
This study comprised a relatively small sample size (25 women), which may not fully reflect characteristics of general population. However, use of within a subject comparison design with a large individual sample size (30 beats) and full randomisation may yield to significant results. The powers of the applied statistical tests were verified and always were in the range to consider statistics significant.
Subject anthropometric parameters (muscle mass) were obtained by callipers and a measuring tape and not by more reliable methods such as CT, MRI or DEXA. However there were numerous studies showing that anthropometric methods are valid and their results are closely correlated to CT and MRI.51,52 Moreover correlation analyses performed in the present study require only relative values of muscle volume and mass, thus errors of absolute values can be neglected.
Ultrasound Doppler imaging method instead of others more prone to operator mistakes has been utilised for measurement of basal values of artery haemodynamic parameters (Doppler waveform derived indices). Special attention has been paid for this issue as it is crucially important for reliable bilateral comparison of femoral artery haemodynamic parameters. To avoid inter observer variability, sonographic scanning on both sides were performed by the same experienced sonographer (Z.M.). Prior to this study our group estimated (CV%) variability coefficients (including: intra observer, ultrasound device, automated analyses software) which were similar or even lower to those reported by Green at al, and Hussain et al. with a slight differences for different femoral arteries and different haemodynamic parameters (for SFA 3%–8%; for DFA 6–12%, depending on measured parameters). The whole experiment design was intended to avoid different confounding factors which might compromise results.
The daily activity level has been obtained by questionnaires, which is a rather subjective method in comparison to techniques such as personal activity monitors. We feel that the women have answered questions truthfully, and even if the data had been slightly different from reality, full time student daily activity level shouldn’t differ notably and are considerably lower than those of the trained athletes.
Disclosures
None.
Acknowledgements
The authors thank Karina Volceka for support in anthropometric measurements, this research has been financially supported by two EU ESF projects: “
References
Cite this article
TY  - JOUR
AU  - Zbignevs Marcinkevics
AU  - Zane Lukstina
AU  - Uldis Rubins
AU  - Andris Grabovskis
AU  - Juris-Imants Aivars
PY  - 2013
DA  - 2013/10/03
TI  - Bilateral difference of superficial and deep femoral artery haemodynamic and anatomical parameters
JO  - Artery Research
SP  - 201
EP  - 210
VL  - 7
IS  - 3-4
SN  - 1876-4401
UR  - https://doi.org/10.1016/j.artres.2013.09.001
DO  - 10.1016/j.artres.2013.09.001
ID  - Marcinkevics2013
ER  -