
Comparing the effect of moderate intensity exercise on arterial stiffness in resistance trained athletes, endurance trained athletes and sedentary controls: A cross-sectional observational study
Joint first authors.
- DOI
- 10.1016/j.artres.2013.08.002How to use a DOI?
- Keywords
- Central pulse wave velocity; Peripheral pulse wave velocity; Short term exercise
- Abstract
Background: Arterial stiffness is an independent risk factor for cardiovascular disease. There has been no previous research comparing the acute changes to arterial stiffness following aerobic exercise in different groups of athletes. The aim of this study was to compare the acute effect of aerobic exercise on arterial stiffness in resistance-trained (RT) athletes, endurance-trained (ET) athletes and sedentary controls.
Methods: Central and peripheral pulse wave velocity (PWV) were measured before and at 3, 15 and 30 min intervals post-exercise in RT athletes (n = 18), ET athletes (n = 19) and sedentary controls (n = 15). PWV was measured using Doppler flow velocimeters and derived from the ‘foot-to-foot’ transit times. Blood pressure and heart rate recordings preceded all PWV measurements.
Results: Resting PWV did not differ significantly between groups. In the endurance and control group, central PWV increased at 3 min post-exercise (from 7.7 ± 2.2 to 10.6 ± 4.2 m/s; P = 0.02 and from 7.4 ± 2.2 to 9.1 ± 3.1 m/s; P = 0.01 respectively), followed by a decline to baseline within 15 min of exercise cessation. Central PWV fell at 30 min post-exercise (P = 0.08) in the resistance group, although this was a non-significant reduction. Peripheral PWV did not change significantly from respective baseline values in any group.
Conclusion: The ET and control group exhibited differences in their central arterial response to exercise compared to the RT group, although peripheral arterial response was similar between the groups. Higher intensity and/or prolonged exercise is likely to be required for more pronounced differences.
- Copyright
- © 2013 Association for Research into Arterial Structure and Physiology. Published by Elsevier B.V. All rights reserved.
- Open Access
- This is an open access article distributed under the CC BY-NC license.
Introduction
Increased arterial stiffness is associated with isolated systolic hypertension, left ventricular hypertrophy and impaired coronary perfusion.1 In the last decade increased arterial stiffness has become widely recognised as an independent risk factor for cardiovascular disease2,3 above and beyond the traditional cardiovascular risk factors1 as well as being associated with all-cause mortality.4
It is well-established that long-term regular aerobic exercise training can reduce arterial stiffness as studies have demonstrated that endurance-trained individuals have lower arterial stiffness at rest when compared to age-matched sedentary5–7 and resistance-trained individuals.8,9 Cameron et al. reported that changes to arterial stiffness can occur even after as little as 1 week of aerobic exercise training.10
However, research into the acute effects of just a single bout of exercise remains limited. Kingwell et al. tested sedentary subjects and found central and peripheral arterial stiffness were reduced 30 min after half an hour of moderate intensity exercise.11 Naka et al. used a maximal aerobic exercise test and concluded that central arterial stiffness increased at 3 min post-exercise in sedentary subjects.12 Heffernan et al. measured arterial stiffness after maximal aerobic exercise in resistance trained and sedentary individuals and found peripheral arterial stiffness to be reduced 20 min post-exercise in both groups, with no changes in central arterial stiffness.13 To our knowledge there have been no reports on the acute effect of a single bout of exercise on arterial stiffness in endurance trained individuals.
The primary aim of this study was to compare initial changes in central and peripheral arterial stiffness following moderate intensity aerobic exercise in endurance-trained athletes, resistance-trained athletes and sedentary controls.
Method
Inclusion and exclusion criteria
The resistance and endurance trained athletes were included if they had been actively competing and training in their respective sports at a competitive level (at regional or national standard) for a minimum of one year and training more than three times a week. Furthermore, endurance trained athletes were only included if they performed less than 90 min of concomitant non-vigorous resistance activity per week and resistance trained athletes were only included if they performed less than 90 min of concomitant non-vigorous endurance activity per week. Non-vigorous activity was defined as exercise which was part of a simple warm up or ‘cool down’ at the end of a session. The control group consisted of participants who were not involved in any regular planned exercise program.
Exclusion criteria consisted of any history of respiratory or cardiovascular disease, obesity, diabetes, use of any medication, smoking, and any orthopaedic or musculoskeletal injuries, which could prevent full compliance with the exercise protocol.
Ethical approval was granted by Queen Mary University of London Research Ethics Committee (QMREC2007/70).
Recruitment
Endurance trained athletes were recruited from elite running clubs in London whilst resistance trained athletes were all members of Crystal Palace Weightlifting Club. Sedentary controls were students and staff members of Queen Mary University of London. Both males and females ranging from ages 20–45 were included in the study.
Method protocol
In accordance with guidelines for measuring arterial stiffness,14 participants were asked to refrain from drinking alcohol and participating in vigorous exercise for at least 12 h prior to testing.
Height and weight were measured using a Seca Leicester Portable Height Measure and a Salter electronic weight scale. Body mass index (BMI) was calculated using the Mosteller formula.15 Body circumference measures were taken with a tape measure (to the nearest mm) at the neck, chest, upper arm, waist and thigh, at the site of greatest circumference. Subjects then rested supine for ten minutes on an examination couch, after which resting BP and heart rate (HR) were measured at the left brachial artery using an automatic, oscillometric blood pressure monitor (Omron X3, UK). Central arterial pulse waveforms were then recorded by placing 4 MHz Doppler probes over the pulse of the left carotid and left femoral artery for 60 s whilst the patient lay in a supine position. Each probe was connected to a hand held Doppler flow velocimeter (Multi Dopplex II, Huntleigh Diagnostics, Cardiff, UK). Distances between the probes were measured as a straight line with a tape measure to the nearest 5 mm.14 This procedure was repeated for peripheral arterial stiffness with Doppler probes placed at the left femoral and left posterior tibial artery.
Subjects then cycled on a stationary mountain bike (Trax Tr.1, Halfords, UK) for 30 min at moderate intensity (65% of age-predicted maximum heart rate). Heart rate was monitored with a polar heart rate monitor (Polar F6, Polar Electro Oy, USA). At intervals of 3, 15 and 30 min after exercise, BP and heart rate were measured, immediately followed by recordings of the central and peripheral pulse waveforms for 30 s each.
Pulse wave velocity
The Doppler flow velocimeters were connected to a custom built data capture unit which sampled the analogue data from the velocimeters at a rate of 1 kHz.16 The digital data from the capture unit was interfaced through the USB port to a laptop PC running custom written software which displayed the velocity waveforms in real time and detected the feet of the flow waves from each site.
Central PWV was calculated as the surface distance between the Doppler probes at the carotid and femoral artery divided by the mean time interval between the carotid and femoral pulses.14 Mean pulse transit time was calculated as the mean of the time differences between the ‘feet’ of each pair of proximal and corresponding distal pulse waves, recorded during the 30 s sampling period. Similarly, peripheral PWV was calculated as the surface distance between the Doppler probes at the femoral and posterior tibial artery divided by the mean pulse transit time between the femoral and posterior tibial pulses.17
Statistical tests
All data analysis was carried out using Statistical Package for the Social Sciences (version 18.0, SPSS, Inc., Chicago, IL). All variables were normally distributed according to the Shapiro–Wilk test. Significant differences between the three groups in baseline descriptive variables (age, height, weight, BMI, BSA, body circumference measures) and resting dependent variables (central PWV, peripheral PWV, systolic BP, diastolic BP, pulse pressure (PP), mean arterial pressure [defined as PP/3 + diastolic BP] and heart rate) were assessed by one-way analysis of variance. Wherever significant differences were detected, Tukey’s test was used for post-hoc comparisons. Analysis of co-variance was used to adjust for any potential confounders that were significantly different between the groups at baseline. Two-tailed paired t-tests were used to seek significant differences between pre-exercise and post-exercise dependent variables within each group. All values are reported as means ± standard deviation. A P-value of <0.05 was considered statistically significant.
Results
Subject characteristics
Subject characteristics are presented in Table 1. Groups were matched for age and height. The resistance group were significantly heavier than the endurance (P = 0.002) and control group (P = 0.01). BMI was also significantly higher in the resistance group compared to the endurance (P < 0.001) and control group (P = 0.002). The resistance group had significantly greater neck, chest and waist circumferences than controls (P = 0.01, P = 0.03 and P = 0.009 respectively). They also had greater arm, chest and thigh circumferences than the endurance group (P < 0.001, P = 0.003 and P = 0.002 respectively).
| Resistance trained (n = 18) | Endurance trained (n = 19) | Controls (n = 15) | |
|---|---|---|---|
| Male:female | 16:2 | 16:3 | 12:3 |
| Age (years) | 30.1 ± 8.5 | 28.0 ± 8.7 | 29.0 ± 4.1 |
| Height (cm) | 1.8 ± 0.1 | 1.8 ± 0.1 | 1.7 ± 0.1 |
| Weight (kg) | 85.9 ± 14.4 | 71.3 ± 8.1a | 74.6 ± 14.8a |
| BMI (kg/m2) | 27.7 ± 3.6 | 22.9 ± 1.9a | 24.3 ± 3.9a |
| Body surface area (m2) | 2.0 ± 0.2 | 1.9 ± 0.1a | 1.9 ± 0.2a |
| Circumference (cm) | |||
| Neck | 39.7 ± 3.0 | 37.6 ± 1.9 | 37.2 ± 3.5a |
| Arm | 34.6 ± 3.4 | 28.5 ± 3.1a | 31.7 ± 4.7 |
| Chest | 99.5 ± 10.1 | 89.7 ± 6.3a | 92.5 ± 10.1a |
| Thigh | 57.0 ± 4.4 | 51.3 ± 4.8a | 55.5 ± 5.9 |
| Waist | 96.6 ± 12.6 | 88.8 ± 7.8 | 86.3 ± 12.2a |
Significantly different from resistance group.
Subject characteristics.
Central PWV before and after exercise
There were no significant differences in resting central PWV between the groups (Fig. 1). Central PWV was significantly higher at 3 min after exercise when compared to resting levels, in the endurance group (from 7.7 ± 2.1 to 10.6 ± 4.2 m/s; P = 0.02) and control group (from 7.4 ± 2.2 to 9.1 ± 3.1 m/s; P = 0.01). Central PWV returned to resting levels by 15 min in both groups. The resistance group revealed a reduction of central PWV at 30 min, although this was not statistically significant (P = 0.08).
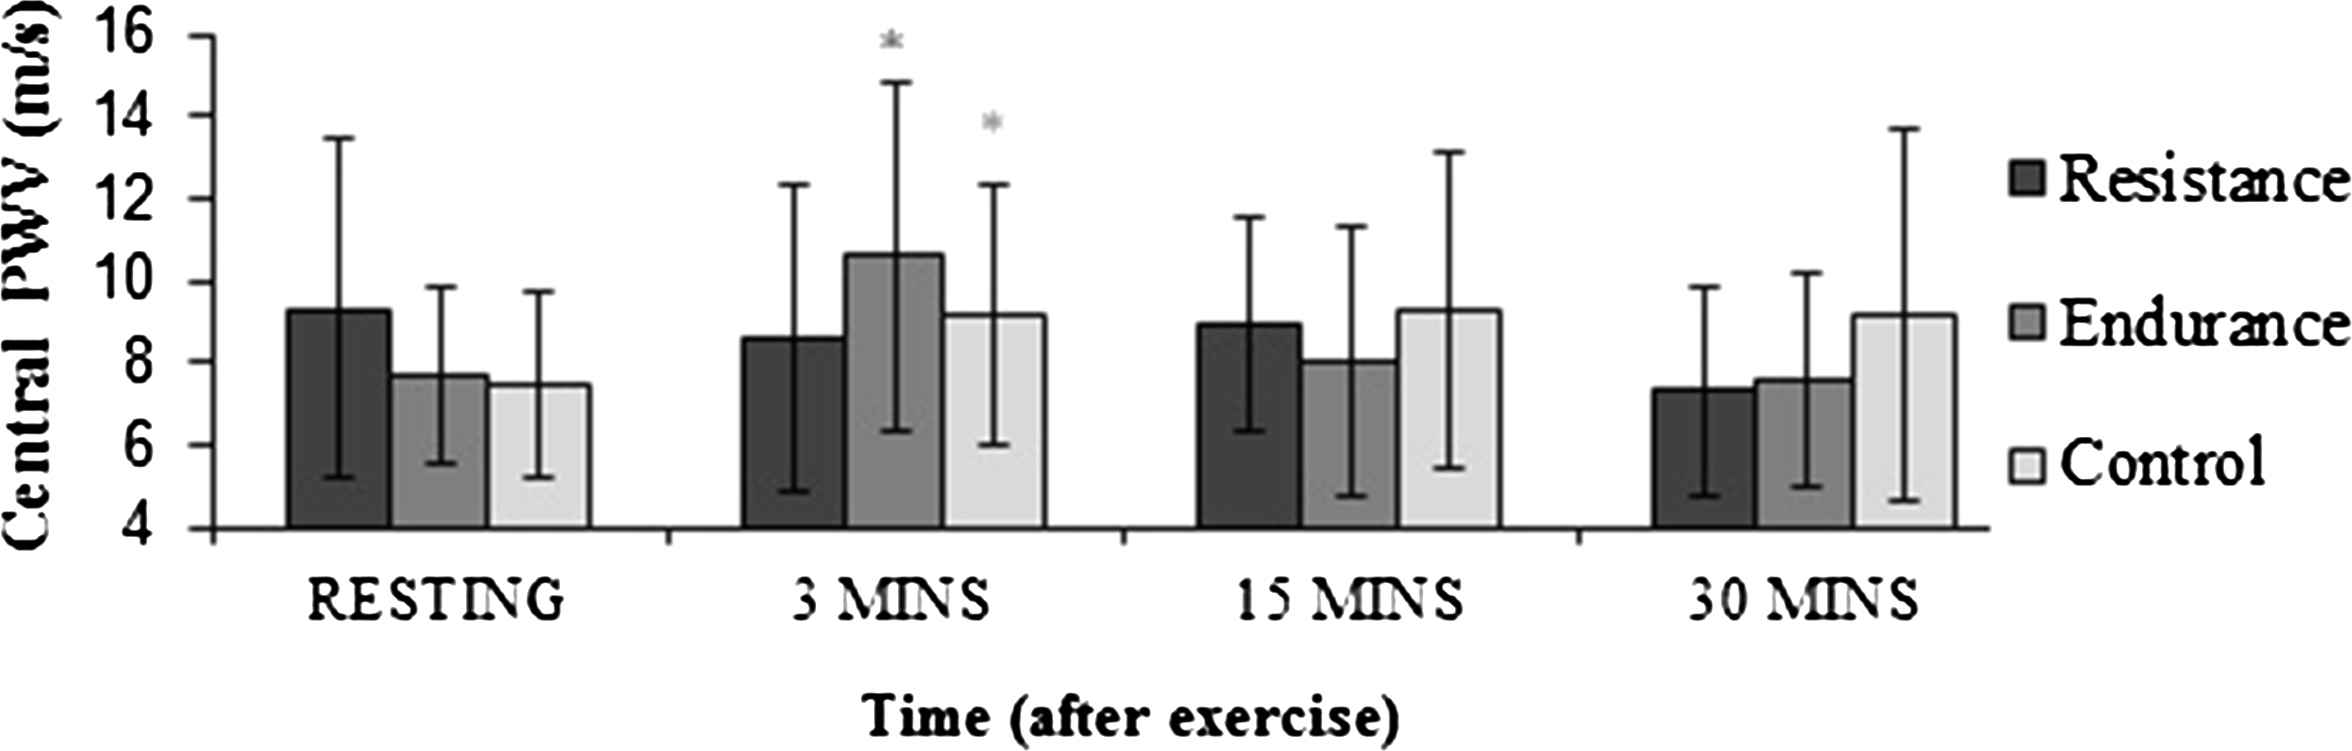
Changes in central PWV following exercise in resistance athletes (black), endurance athletes (dark grey) and controls (light grey). * indicates significant difference from resting levels (P < 0.05).
Peripheral PWV before and after exercise
No differences existed in resting peripheral PWV between the groups (Fig. 2). There were no significant changes in peripheral PWV post-exercise in any group.
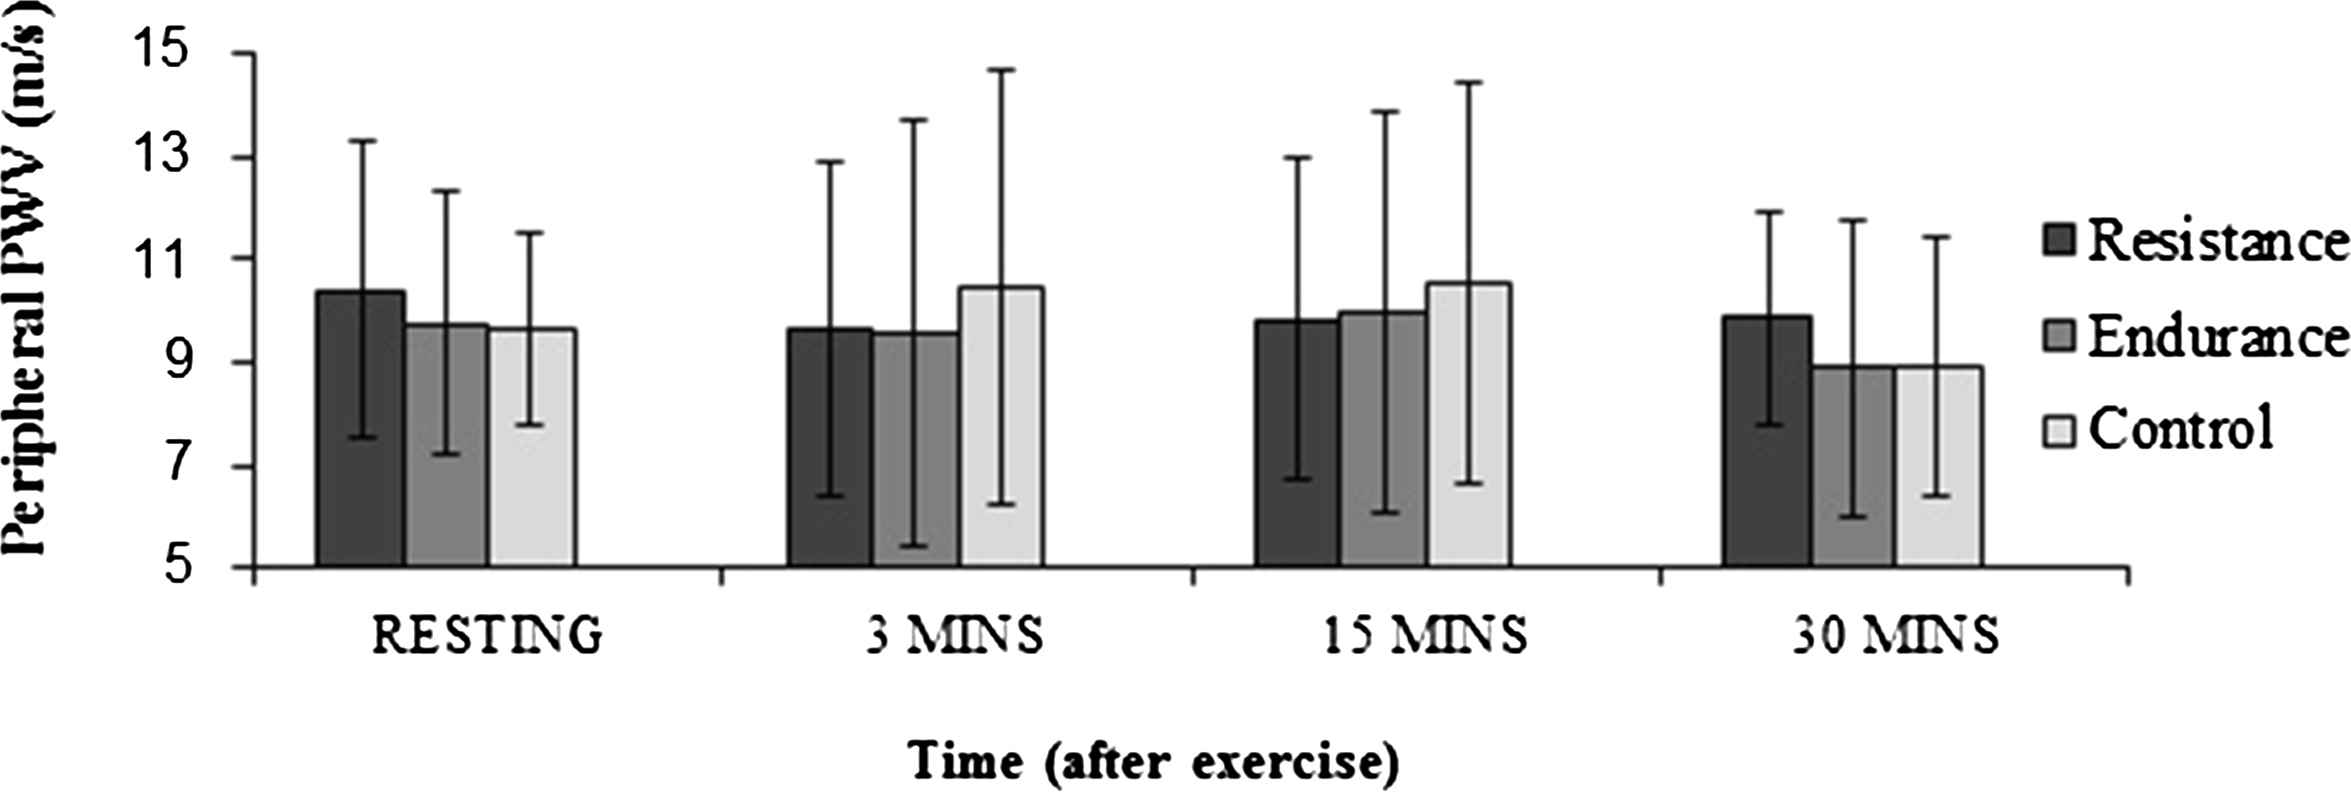
Changes in peripheral PWV following exercise in resistance athletes (black), endurance athletes (dark grey) and controls (light grey).
Haemodynamic variables before and after exercise
There were no significant differences in resting mean arterial pressure (MAP) between the three groups (Table 2). The resistance group had a higher resting pulse pressure (PP) than the control group at rest (P = 0.01). At 3 min after exercise, SBP increased in the resistance and endurance group (P = 0.04 and P = <0.001 respectively), and fell significantly 30 min after exercise in the resistance and control groups (P = 0.006 and P = 0.004 respectively). PP increased in all groups at 3 min post-exercise (P < 0.05), and was reduced in the resistance and control group at 30 min post-exercise (P = 0.04 and P = 0.013 respectively). HR was significantly higher in all three groups at 3 min post-exercise (P < 0.05), and had returned to resting values by 30 min after exercise. There was a significant reduction in MAP 30 min post-exercise in the resistance and endurance group (P = 0.01 in both groups).
| Pre-exercise | 3 min post-exercise | 15 min post-exercise | 30 min post-exercise | |
|---|---|---|---|---|
| SBP (mmHg) | ||||
| RT | 132 ± 14 | 140 ± 16a | 126 ± 12a | 124 ± 12a |
| ET | 133 ± 16 | 148 ± 13a | 130 ± 15 | 127 ± 12 |
| Control | 123 ± 13 | 130 ± 9 | 115 ± 8a | 114 ± 11a |
| DBP (mmHg) | ||||
| RT | 70 ± 9 | 68 ± 9 | 69 ± 10 | 65 ± 8a |
| ET | 73 ± 12 | 72 ± 7 | 70 ± 10 | 69 ± 9a |
| Control | 69 ± 10 | 69 ± 8 | 70 ± 10 | 68 ± 10 |
| MAP (mmHg) | ||||
| RT | 88 ± 9 | 91 ± 10 | 87 ± 9 | 83 ± 8a |
| ET | 93 ± 13 | 97 ± 7 | 90 ± 11 | 88 ± 9a |
| Control | 88 ± 10 | 89 ± 7 | 85 ± 8 | 84 ± 10 |
| PP (mmHg) | ||||
| RT | 64 ± 12b | 72 ± 12a | 57 ± 13a | 60 ± 12a |
| ET | 60 ± 9 | 77 ± 14a | 60 ± 10 | 59 ± 9 |
| Control | 55 ± 10 | 62 ± 10a | 47 ± 10a | 48 ± 8a |
| HR | ||||
| RT | 68 ± 14 | 80 ± 15a | 71 ± 12a | 66 ± 12 |
| ET | 60 ± 9 | 74 ± 10a | 63 ± 7 | 61 ± 7 |
| Control | 67 ± 13 | 79 ± 11a | 70 ± 13 | 65 ± 9 |
RT, resistance trained; ET, endurance trained; SBP, systolic blood pressure; DBP, diastolic blood pressure; MAP, mean arterial pressure; PP, pulse pressure; HR, heart rate.
Significant difference from pre-exercise levels.
Significant difference from control group.
Haemodynamic variables before and after exercise.
Discussion
The main findings of this study are that 1) a 30 min bout of moderate intensity cycling caused an immediate but short-term increase in central PWV in the endurance and control group, 2) There was a trend towards reduction in central PWV in the resistance group, 3) Resting central and peripheral PWV were similar between the groups and 4) There were no changes in peripheral PWV post-exercise in any group.
Mechanisms likely to account for the increased central PWV include sympathetic adrenergic vasoconstriction due to elevated catecholamine and endothelin-1 (ET-1) levels, and vascular smooth muscle cell contraction, which have all been associated with increased arterial stiffness.18 Resistance trained athletes have higher levels of plasma ET-1 levels at baseline and hence this may have prevented any further significant increase of ET-1 during exercise.19 It may be argued that the rise in PP (if accompanied by an increase in mean BP) could have contributed to the concomitant rise in PWV.17 However, since the resistance group showed no signs of an increase in PWV despite increases in PP, it remains uncertain as to whether PP accounted for the increase in PWV in the endurance and control group. Similarly, the SBP rise in the endurance group at 3 min post-exercise could have accounted for the groups’ increase in PWV, but again this seems unlikely as no SBP rises occurred in the control group, despite a similar increase in PWV. PWV was not affected by MAP in our study. Kingwell et al.11 also found that PWV was not affected by MAP after moderate intensity exercise. With a higher intensity and/or duration of exercise MAP could well have had a statistically significant effect on PWV. We conclude, therefore that the observed differences in PWV between the groups are not due merely to differences in arterial elasticity resulting from passive stretch of the vessels. It might also be argued that changes in HR may have affected PWV. Some studies have suggested that there is a positive association between PWV and HR in young and middle aged individuals20 as well as in the elderly,21 whilst others have argued that there is no such association.22 In this study we checked for an association between central or peripheral PWV and HR by regression analysis and found no relationship either at rest or at any of the time intervals after exercise.
Central PWV returned to resting levels by 15 min post-exercise in the endurance and control groups and this is most likely because the vasoconstriction changes were only transient.18 Kingwell et al. reported a reduction in central PWV 30 min after moderate intensity cycling in sedentary subjects,11 which does not agree with our findings. These differences can be attributed to oxygen consumption being used as a measure of exercise intensity in the Kingwell study whilst subjects in our study exercised to a level determined by their maximal heart rate.
In the resistance group there was a measurable reduction in central PWV (P = 0.08) at 30 min post-exercise, although this reduction was not statistically significant. A possible reason for this finding is that exercise causes vasodilatation of the vasa vasorum of the aorta in resistance trained athletes, stimulating vascular smooth muscle relaxation and therefore reducing arterial stiffness.18
Peripheral PWV did not change after exercise in any group. It may be expected that vasoactive substances such as the production of nitric oxide in the vascular endothelium during exercise would cause vasodilatation of the arteries in the exercising limbs, and subsequently lead to reduced peripheral PWV.19 However, the release of nitric oxide tends to occur with higher intensities of exercise19 and hence it is not surprising that, in contrast to our findings, Heffernan et al. found reductions in peripheral arterial stiffness after maximal aerobic exercise.13
We observed no differences in resting central and peripheral arterial stiffness between the groups, which supports previous findings13 that chronic resistance training does not increase arterial stiffness, although others have reported contradictory results.8,9 However these contradictory studies included younger subjects, whereas our study involved middle aged participants and ageing per se is strongly associated with increased arterial stiffness.1
A limitation of this study was that subjects were not tested at the same time of day and since diurnal variations in arterial stiffness exist,23 this could have confounded PWV readings. Furthermore, we used the surface distance between the Doppler probe recording sites to represent the actual length between the respective arteries and, although this approach is consistent with the recommendations of the expert consensus document on the measurement of PWV,23 it provides only an estimation of true arterial length. Also, the SBP measurements taken at the arm are not a true representation of central SBP due to the well-established phenomenon of pulse wave amplification, where SBP measured in the arm is greater than the corresponding central values, with the error, especially in the young, sometimes being as high as 10 mmHg.14
To our knowledge this is the first study to compare short term changes in arterial stiffness following moderate intensity exercise in endurance and resistance trained athletes. To improve the external validity of these findings, future research should be aimed at female athletes. Only eight females were recruited in this study and there are no reports of arterial stiffness measured after a single bout of aerobic exercise in female athletes.
In conclusion, central PWV transiently increased in endurance trained athletes and sedentary individuals 3 min after ceasing 30 min of moderate intensity exercise and returned to baseline levels by 15 min post-exercise. Reasons for this are most likely to be related to mechanisms involving vasoconstriction. No significant changes in central PWV occurred in the resistance group nor did peripheral PWV change after exercise in any group. It is likely that exercise of a higher intensity and/or for a more prolonged amount of time is required for more pronounced changes in arterial stiffness to occur post-exercise in these different groups of athletes.
Sources of support
None.
Competing interests
None.
References
Cite this article
TY  - JOUR
AU  - Bhupinder Hoonjan
AU  - Rajdip Dulai
AU  - Zakariya Ahmed
AU  - Alice Lucey
AU  - Richard Twycross-Lewis
AU  - Dylan Morrissey
AU  - Stephen E. Greenwald
PY  - 2013
DA  - 2013/08/31
TI  - Comparing the effect of moderate intensity exercise on arterial stiffness in resistance trained athletes, endurance trained athletes and sedentary controls: A cross-sectional observational study
JO  - Artery Research
SP  - 216
EP  - 221
VL  - 7
IS  - 3-4
SN  - 1876-4401
UR  - https://doi.org/10.1016/j.artres.2013.08.002
DO  - 10.1016/j.artres.2013.08.002
ID  - Hoonjan2013
ER  -