
Carotid–femoral pulse wave velocity in obese children and adolescents: The potential bias of tape distance measuring
- DOI
- 10.1016/j.artres.2013.09.003How to use a DOI?
- Keywords
- Adolescence; Aortic stiffness; Children; Methodology; Obesity; Pulse wave velocity
- Abstract
Background: The recommendation for carotid–femoral pulse wave velocity (cfPWV) is to use a calliper to measure the aortic length as a straight line. In adults, it has been shown that tape follows the body contours potentially making the distance longer – ultimately a higher cfPWV – interpreted as a higher aortic stiffness. Our objective was to investigate to what extent a tape measurement is influenced by abdominal obesity in children and adolescents.
Methods: In a cross-sectional design, 100 obese patients with age 10–18 years were compared to 50 healthy control individuals. CfPWV was measured by applanation tonometry. The aortic length was determined with tape and a calliper (distance-tape and distance-calliper). The bias of the tape measurements was calculated as distance-tape minus distance-calliper.
Results: The bias of the tape measurements (mean ± SD) was significant in both the obese (Δ 14.6 ± 11.2 mm, P < 0.0001) and the control group (Δ 5.7 ± 5.8 mm, P < 0.0001), and showed a linear relationship with waist-height ratio in the obese group (obese: β = 96.9, CI: 75.3–118.5, P < 0.0001). Likewise, cfPWV was significantly higher when tape was used for the distance measurements in both groups (P values <0.0001). In multiple regression, however, cfPWV for both tape and calliper were significantly lower in the obese compared to the control group (P values <0.01).
Conclusions: The bias of the tape measurements was related to the degree of abdominal obesity. Our results emphasize the importance of the use of a calliper when evaluating cfPWV in obese children and adolescents.
- Copyright
- © 2013 Association for Research into Arterial Structure and Physiology. Published by Elsevier B.V. All rights reserved.
- Open Access
- This is an open access article distributed under the CC BY-NC license.
Background
The expert consensus report1 on carotid–femoral pulse wave velocity (cfPWV) emphasizes the use of an infantometer (calliper) to measure the aortic length as a straight line. As shown in adult, tape follows the body contours potentially making the distance longer than the correct straight line – ultimately giving a higher cfPWV – interpreted as higher aortic stiffness.2 Studies with divergent results on cfPWV in obese children and adolescents using tape measurements have been.3–5 A potential bias in respect to the distance measure might affect the interpretation of obesity’s association with arterial stiffness.
Aim
The objective was to investigate to what extent the length of a tape distance measurement is influenced by abdominal obesity.
Methods
In a cross-sectional study, 104 obese patients were compared to 50 healthy control individuals. The main publication of the study population is in.6 ClinicalTrials.org NCT01310088.
CfPWV was measured by applanation tonometry with the SphygmoCor 9.0 device (AtCor Medical, Australia) using the intersecting tangents algorithm according to recommendations.1 With stretch resistant tape and a calliper the aortic length was determined consecutively as 80% of the distance from the common carotid artery to the femoral artery (distance-tape and distance-calliper). From the same transit time cfPWV-tape and cfPWV-calliper were calculated and reported as mean of at least two measurements.
Statistical significance was an α-level below 0.05 on 2-sided tests. Comparisons in Table 1 were made with unpaired t tests, Wilcoxon rank sum tests or Chi-squared test. The systematic difference (bias) of the tape distance measurements was calculated as distance-tape minus distance-calliper and plotted against waist-height ratio (Fig. 1). Also, the potential bias of the distance measures and the resulting cfPWV were tested with paired t tests. In multiple regression analysis, the relationship between cfPWV-tape and obese status were adjusted for age, gender, mean arterial pressure and heart rate. Results of multiple regression of cfPWV-calliper are reported in.6 β coefficients for group status (obese vs. control, 95% confidents limits (CI)) were reported.
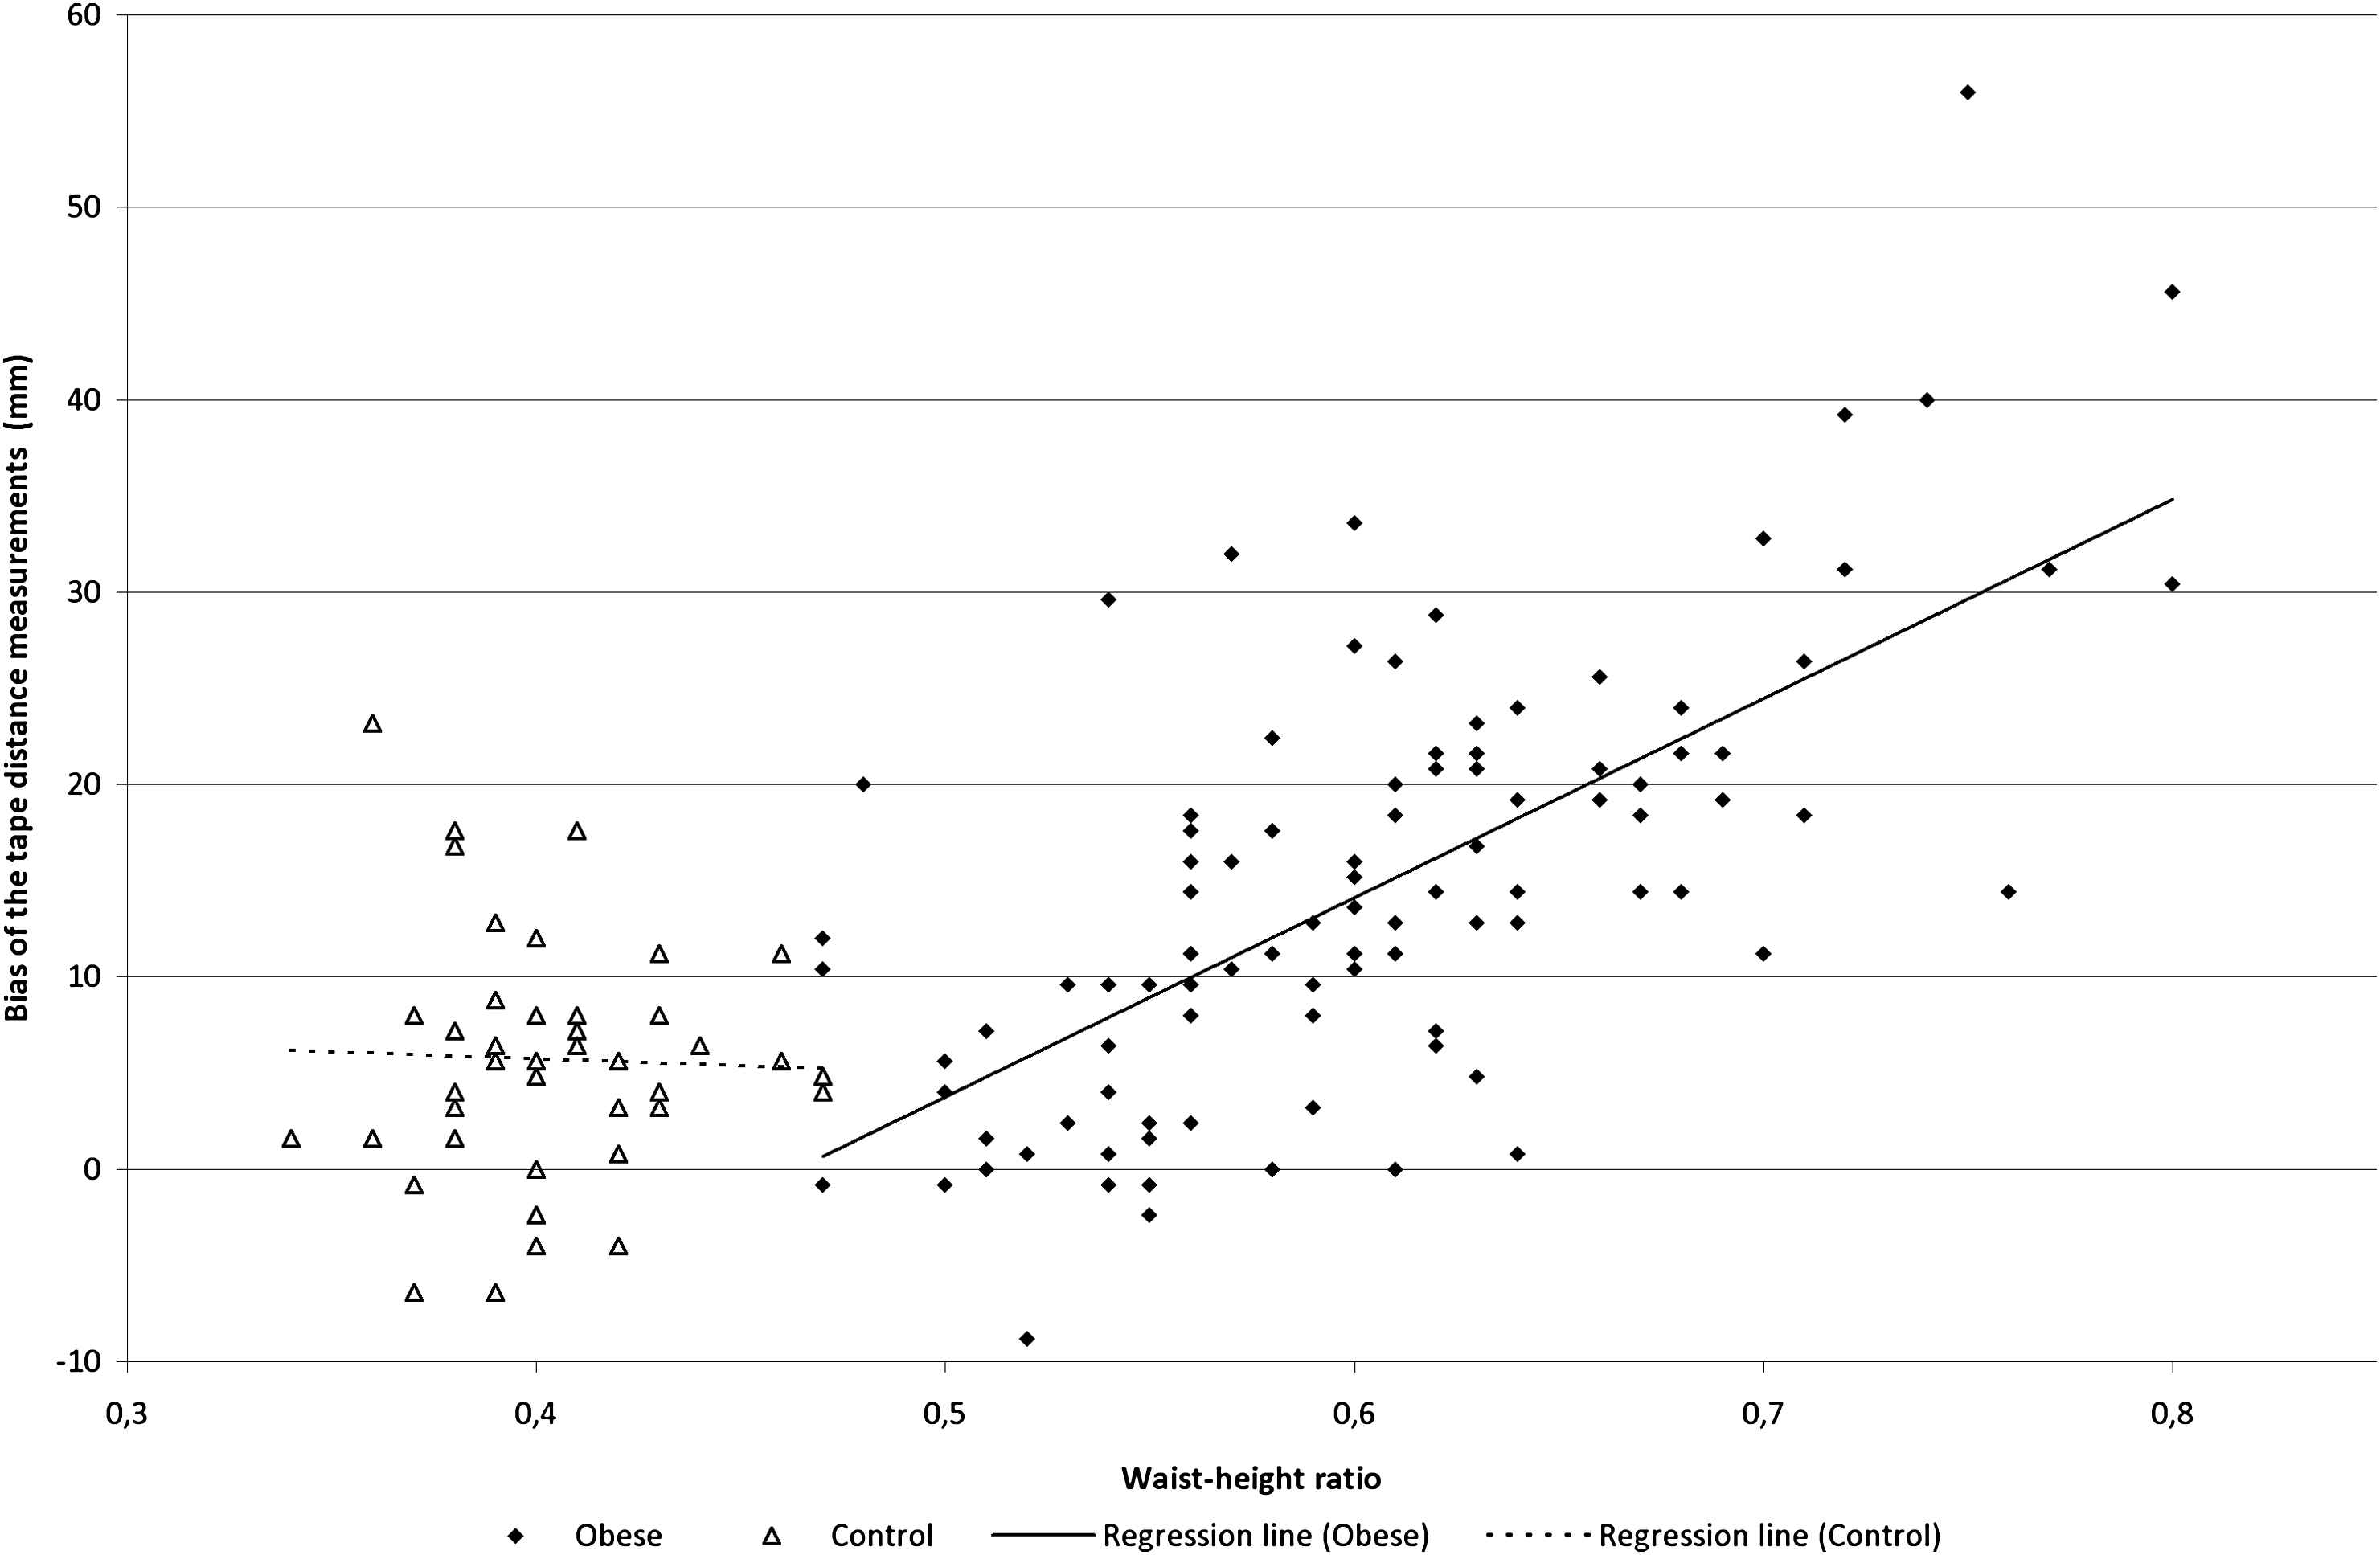
The bias of the tape distance measurements in relation to abdominal obesity. The bias of the tape distance measurements was calculated as distance-tape minus distance-calliper (mm) and plotted in relation to waist-height-ratio in the obese and the control group. Regression lines; obese: β = 96.9, 95% CI: 75.3–118.5, P < 0.0001, control: β = −7.1, 95% CI: −64.6–50.4, P = 0.81.
| Variable | Obese group N = 104 | Control group N = 50 | P value |
|---|---|---|---|
| Mean ± SD or median (IQR) | Mean ± SD or median (IQR) | ||
| Male/female (N/N) | 50/54 | 23/27 | 0.81 |
| Age (years) | 12.6 (11.4–15.0) | 13.2 (11.7–14.9) | 0.44 |
| Height (cm) | 159.9 ± 11.9 | 163.2 ± 12.1 | 0.11 |
| Weight (kg) | 66.9 (57.7–90.9) | 50.7 (41.3–58.4) | <0.0001 |
| BMI z score | 2.76 ± 0.68 | 0.08 ± 0.84 | <0.0001 |
| Waist (cm) | 94.8 (85.3–107.5) | 66.4 (62.7–69.6) | <0.0001 |
| Waist/height ratio | 0.60 (0.56–0.64) | 0.40 (0.38–0.42) | <0.0001 |
| Brachial systolic BP (mmHg) | 110.9 ± 8.51 | 107.7 ± 8.0 | 0.026 |
| Brachial diastolic BP (mmHg) | 61.8 ± 5.7 | 59.1 ± 5.3 | 0.004 |
| Heart rate (bpm) | 66.6 ± 9.5 | 63.4 ± 10.0 | 0.055 |
| CfPWV-tape (m/s) | 4.98 ± 0.60 | 5.16 ± 0.66 | 0.092 |
| CfPWV-calliper (m/s) | 4.83 ± 0.57 | 5.10 ± 0.65 | 0.008 |
| Distance-tape (mm) | 461.5 ± 50.0 | 451.5 ± 44.8 | 0.23 |
| Distance–calliper (mm) | 446.9 ± 44.5 | 445.8 ± 43.5 | 0.89 |
| Transit time (seconds) | 88.5 ± 12.3 | 82.6 ± 12.1 | 0.006 |
Results are reported as mean ± standard deviation (SD) or median (interquartile range) (IQR). With exceptions of cfPWV-tape and distance-tape, all variables in the table are published in.6
Basic and hemodynamic characteristics.
Results
Table 1 lists the basic and hemodynamic characteristics of the two groups. While no differences were found in gender, age and height; anthropometrics were significantly higher in the obese when compared to the control group according to the design of the study. Brachial blood pressures (BP) were significantly higher in the obese group.
Although no significant differences in the distance measures were found between the obese and the control group, the bias of the tape distance measurements (mean ± SD) were significant in both the obese (Δ 14.6 mm ± 11.2 mm, P < 0.0001) and the control group (Δ 5.7 mm ± 5.8 mm, P < 0.0001). Also, a linear relationship was found between the bias of the tape measurements and waist-height ratio in the obese group, while no relation was found for the control group (Fig. 1).
The two different types of cfPWV lead to different conclusions since cfPWV-calliper was lower in the obese group, whereas no difference was found in cfPWV-tape between the two groups. Also, systematic differences were found for cfPWV using tape and calliper in the obese (Δ 0.15 ± 0.11 m/s, P < 0.0001) and the control group (Δ 0.06 ± 0.06 m/s, P < 0.0001). However, in multiple regression analyses, both cfPWV-tape (β = −0.25, 85% CI: −0.44–0.06, P = 0.009) and cfPWV-calliper (β = −0.34, 95% CI: −0.53–0.15, P = 0.0004) were significantly lower in the obese group.
Conclusion
The main finding was that the magnitude of the bias of the tape distance measurements was related to the extent of abdominal obesity. However, the bias was significant in both the obese and the control group. To the best of our knowledge, the present paper is the first to investigate this intuitive bias in obese children and adolescents. However, Sakuragi et al.4 found a significant association between cfPWV and abdominal girth. Wildman et al.7 held the tape measure above the surface of the body parallel to the plane of the examination table in order to reduce the influence of body contours on the distance measure. Whereas Zebekakis et al.8 discussed the potential overestimation of the length of the carotid–femoral segment artificially affecting the cfPWV measurement.
The most precise aortic distance measure, using the common carotid and femoral arteries as reference points, has been established in adults.9 Recently, we found that the recommended distance measurement for adults lead to the same distance measure when evaluated in relation to height in both the obese and the control group.6 In agreement with studies in adults,2 we found that tape distance measuring results in a bias when comparing obese with normal weighted children and adolescents.
In conclusion, the bias of the tape distance measurements was related to the degree of abdominal obesity. Our results emphasize the importance of the use of a calliper when evaluating cfPWV in obese individuals in order to avoid a systematic bias potentially leading to an overestimation of cfPWV in obese children and adolescents.
Financial disclosure
The corresponding author received
Conflict of interest
All authors declare that there is no conflict of interests in respect to executing, analysing or reporting this research project.
Acknowledgements
We would like to thank
Abbreviations
- BMI
body mass index
- BP
blood pressure
- cfPWV
carotid–femoral pulse wave velocity
References
Cite this article
TY  - JOUR
AU  - Kristian Nebelin Hvidt
AU  - Michael Hecht Olsen
AU  - Jens-Christian Holm
AU  - Hans Ibsen
PY  - 2013
DA  - 2013/10/03
TI  - Carotid–femoral pulse wave velocity in obese children and adolescents: The potential bias of tape distance measuring
JO  - Artery Research
SP  - 234
EP  - 237
VL  - 7
IS  - 3-4
SN  - 1876-4401
UR  - https://doi.org/10.1016/j.artres.2013.09.003
DO  - 10.1016/j.artres.2013.09.003
ID  - Hvidt2013
ER  -