
Variation and variability in carotid-femoral pulse wave velocity
- DOI
- 10.1016/j.artres.2013.04.001How to use a DOI?
- Keywords
- Pulse wave velocity; Variability; Variation
- Abstract
Background: There are very limited data on the day-to-day variability and virtually no data on within-subject measurement variation of carotid-femoral pulse wave velocity (c-fPWV). Therefore, we conducted this study in healthy volunteers to measure both day-to-day variability and day-to-day within-subject measurement variation.
Methods: C-fPWV values were measured in ten adult volunteers resting in supine position for at least 10 min using the SphygmoCor system {AtCor Medical Pty Ltd, West Ryde (Sydney), Australia} on two consecutive days. The data were captured for ten seconds from the right carotid and then right femoral arteries.
Results: The average c-fPWV readings and the between-subject standard deviations (SD) was 7.43 ± 1.9 m/sec for day 1 and 6.93 ± 1.36 m/sec for day 2, which are statistically insignificant with a paired t-test (p = 0.197). However, the Pearson’s correlation showed a coefficient of 0.8 (p value = 0.005). There was a statistically significant difference (p = 0.01) in the within-subject c-fPWV measurement variation, calculated as the mean of the SD comparing day 1 (0.74 ± 0.09 m/sec) and day 2 (0.53 ± 0.07 m/sec). The average MAP was 93.9 ± 2.3 mmHg for day 1 and 90.5 ± 1.7 mmHg for day 2, which were not statistically different (p = 0.1).
Conclusions: The c-fPWV readings were highly reproducible between the two days and the measurement variation in the within-subject c-fPWV is significantly lower on the second day. Our study highlights that day-to-day variability and within-subject measurement variation of c-fPWV, although present is not significant enough to influence the assessment of outcome measures of interventions that alter the arterial stiffness.
- Copyright
- © 2013 Association for Research into Arterial Structure and Physiology. Published by Elsevier B.V. All rights reserved.
- Open Access
- This is an open access article distributed under the CC BY-NC license.
Background and objectives
Carotid-femoral Pulse wave velocity (c-fPWV), a measure of the arterial stiffness, is an important predictor1–9 of cardiovascular events and has prognostic value10,11 in these disease states. Interventions to decrease the arterial stiffness are therefore much needed to decrease the mortality and morbidity caused as a result of these cardiovascular events.
Although there are very few studies conducted on the day-to-day variability of c-fPWV measurements, reproducibility is generally good.12,13 However, these studies are often done in patients with cardiovascular disease states and there is virtually no data on within-subject measurement variation of the c-fPWV value, which usually represents seven to nine readings of velocity derived from ten seconds worth of pulse waveform recordings. Therefore, we conducted this study in healthy volunteers to determine the day-to-day variability in the PWV itself and the within-subject measurement variation of PWV value on two separate occasions.
Methods
In this single-center study, we recruited 10 adult normotensive volunteers at the Hospital of University of Pennsylvania. Study enrollment was completed over a period of 2 months. This study was approved by the Institutional Review Board of the University of Pennsylvania. Written informed consent was obtained from all subjects.
Blood pressure and PWV data were collected beginning at 8:30AM ± 60 min on two consecutive days. At the beginning of the PWV measurements on day 1, demographic data, including date of birth, gender, and ethnicity were collected. The height and weight of each participant was recorded using the Seca 242 digital stadiometer (Hanover, MD) and Scaletronix 5002 (White Plains, NY) stand-on scale. Standard seated blood pressures with cuff sizes appropriate to mid-arm circumference were obtained in triplicate using an Accutorr (Datascope, Mahwah, NJ) device.
C-fPWV values were measured using the SphygmoCor system {AtCor Medical Pty Ltd, West Ryde (Sydney), Australia} on two consecutive days by a sole operator (RRK). All the c-fPWV values were measured with the subject resting in supine position for at least ten minutes, capturing data for ten seconds from the right carotid and then right femoral arteries using methodology previously published by our group.14 Generally, 7–9 carotid and femoral waveform pairs were analyzed, and a mean ± S.D. determined for each c-fPWV measurement in all subjects. This mean of the SD was used as the measure of within-subject measurement c-fPWV variation.
Results
We recruited 10 subjects with ages ranging 24–57 years and Body Mass Index (BMI) ranging 20.4–38.6 kg/m2 for this study. There were 5 men and 5 women with an average age of 37 years and an average BMI of 27.16 kg/m2. Seven identified their race as Caucasian and three as Asian. The average c-fPWV readings and the between subject standard deviations for the 10 participants using the Sphygmocor device was 7.43 ± 1.9 m/sec for day 1 and 6.93 ± 1.36 m/sec for day 2. The difference in the readings on two days is statistically insignificant with a paired t-test (p = 0.197) (Fig. 1). The Pearson’s correlation showed a coefficient of 0.8 (p value = 0.002) (Fig. 2). All testing procedures were well tolerated.
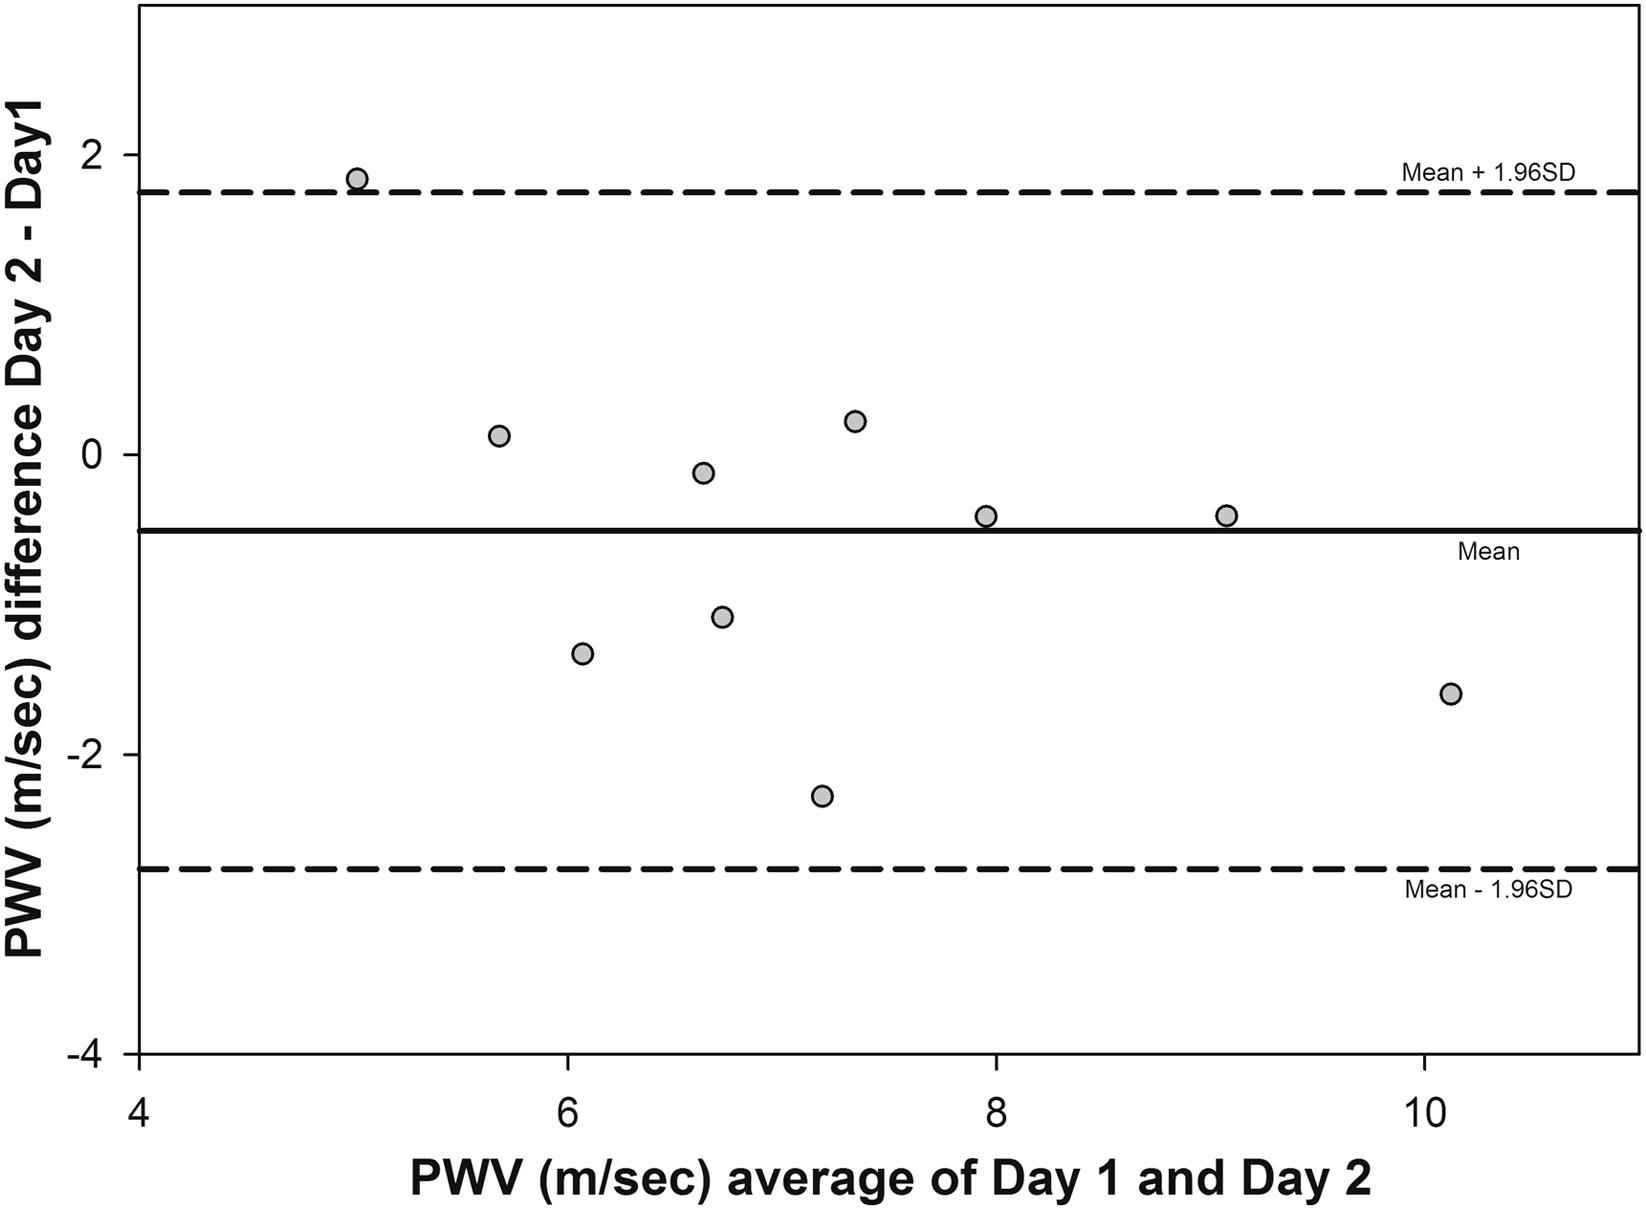
Graph shows the Bland Altman plot of the pulse wave velocities (PWVs) as measured by the Sphygmocor on days 1 and 2; central line indicates the mean of the differences (bias). Outer dotted lines on either side of the mean indicate the confidence intervals of agreement between the two days’ measurements. Standard error of the mean (SEM) (agreement) = 0.36; standard deviation (agreement) = 1.15; p value (agreement) = 0.197.
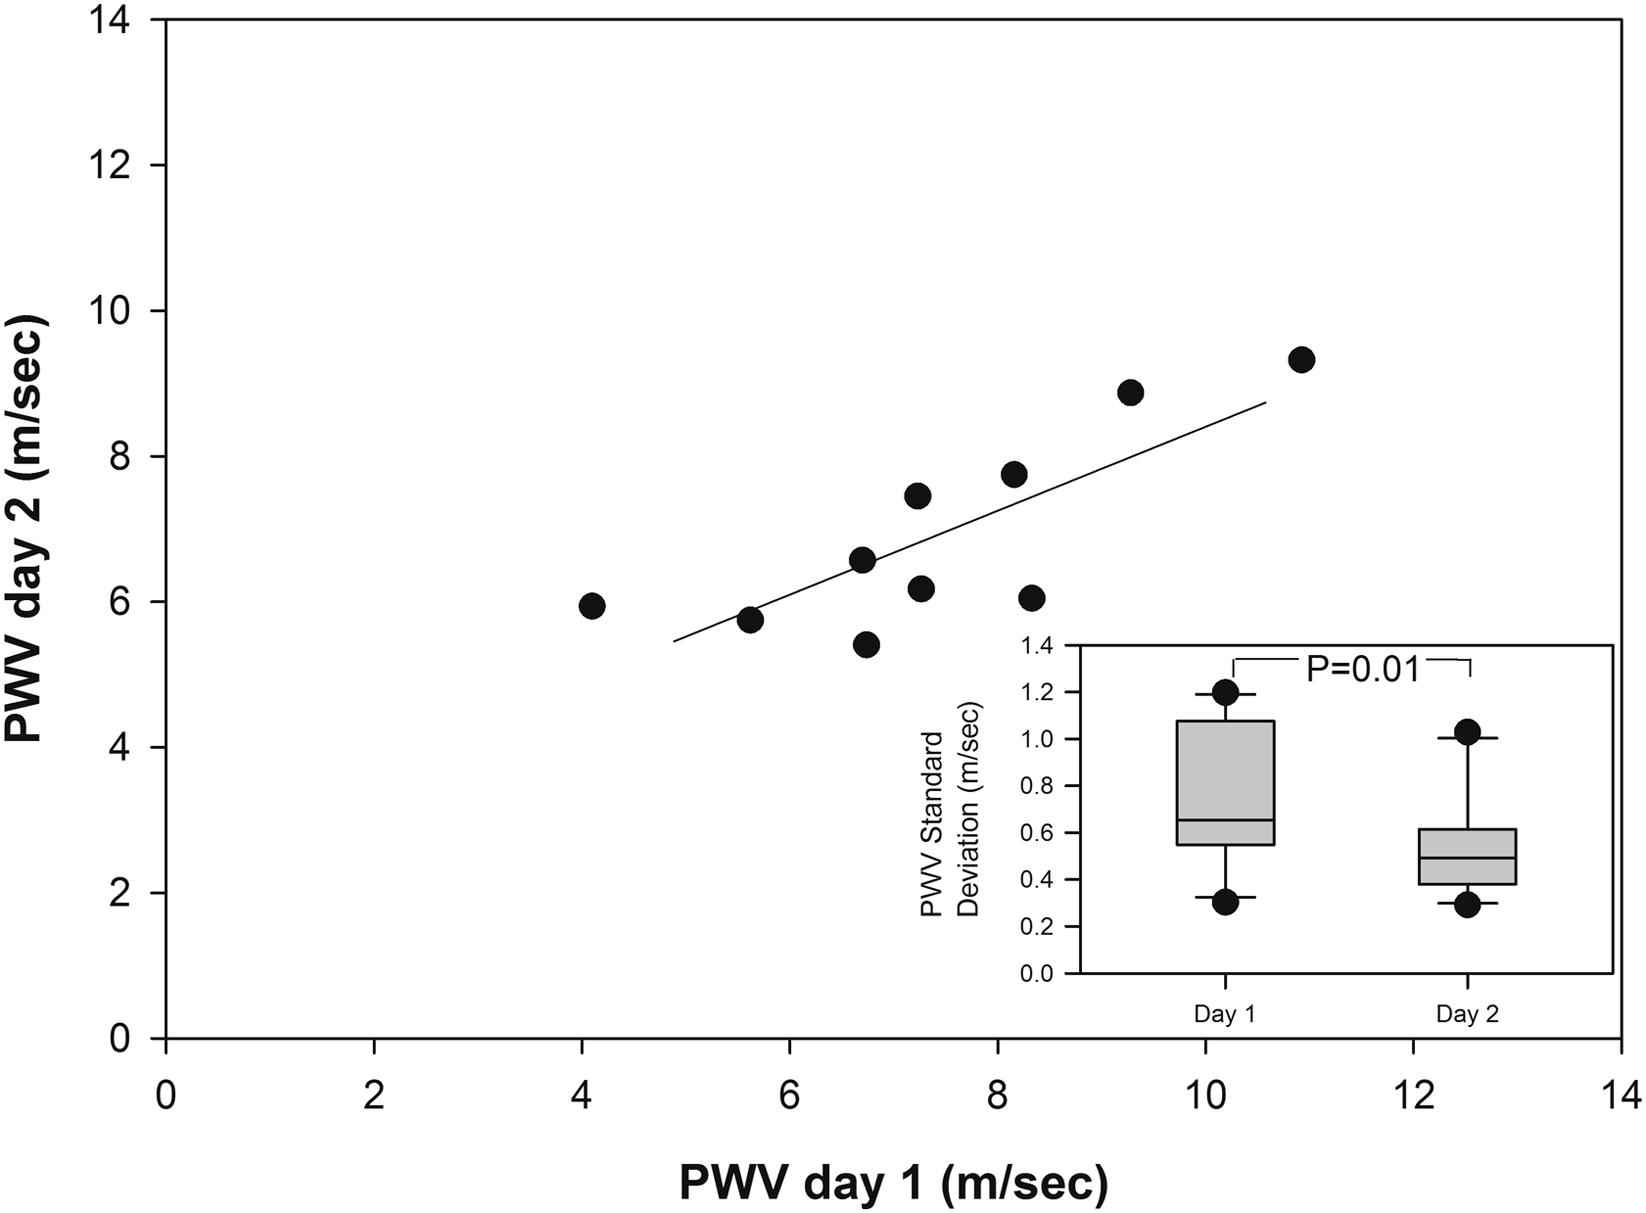
Main graph shows c-fPWV performed on two separate days in 10 subjects, with a ρ = 0.8, p = 0.002. The inset shows a box plot of the within-subject measurement variation of c-fPWV with boxes representing 25th–75th percentiles and median value depicted as solid line within the box.
Table 1 provides the measurement data on our subjects. There was a statistically significant difference (p = 0.01) in the within-subject c-fPWV standard deviation comparing day 1 (0.74 ± 0.09) and day 2 (0.53 ± 0.07) for the 10 participants with paired t-test (inset of Fig. 2). We also calculated the coefficient of variation defined as the percentage of SD/mean for each subject as show in Table 1. The differences in coefficient of variation were similar to the within-subject c-fPWV standard deviation readings with a p value of 0.07. The average MAP reading for the 10 participants was 93.9 ± 2.3 for day 1 and 90.5 ± 1.7 for day 2 2. The difference in the readings on two days is statistically insignificant with a paired t-test (p = 0.1).
| Subject | PWV day 1 (m/sec) | PWV day 2 (m/sec) | PWV difference (m/sec) | Std. Dev day1 (m/sec) | Std. Dev day2 (m/sec) | Coefficient of variation day 1(%) | Coefficient of variation day 2(%) | Heart rate day 1 (beats/min) | Heart rate day 2 (beats/min) |
|---|---|---|---|---|---|---|---|---|---|
| 1 | 5.62 | 5.74 | −0.12 | 0.71 | 0.39 | 12.62 | 6.74 | 95.66 | 82.59 |
| 2 | 8.16 | 7.75 | 0.41 | 1.20 | 0.78 | 14.65 | 10.09 | 62.02 | 64.70 |
| 3 | 7.27 | 6.18 | 1.09 | 0.63 | 0.56 | 8.63 | 9.05 | 82.58 | 73.93 |
| 4 | 10.92 | 9.32 | 1.60 | 1.13 | 0.51 | 10.39 | 5.47 | 76.56 | 76.52 |
| 5 | 4.10 | 5.93 | −1.84 | 0.68 | 0.29 | 16.59 | 4.91 | 50.30 | 51.74 |
| 6 | 6.73 | 5.40 | 1.33 | 0.56 | 0.39 | 8.24 | 7.14 | 71.45 | 95.60 |
| 7 | 7.23 | 7.45 | −0.22 | 0.60 | 0.47 | 8.31 | 6.33 | 60.24 | 63.08 |
| 8 | 8.33 | 6.05 | 2.28 | 0.53 | 0.51 | 6.32 | 8.49 | 75.85 | 83.18 |
| 9 | 9.28 | 8.87 | 0.41 | 1.06 | 1.03 | 11.38 | 11.58 | 82.16 | 87.11 |
| 10 | 6.70 | 6.57 | 0.12 | 0.30 | 0.37 | 4.51 | 5.57 | 69.45 | 69.04 |
| Mean(m/sec) | 7.43 | 6.93 | 0.51 | 0.74 | 0.53 | 10.17 | 7.54 | 72.63 | 74.75 |
Morning PWVs & corresponding Std. Deviations, coefficients of variation and heart rates within subjects on days 1 & 2.
The average systolic pressure for the 10 participants was 127.8 ± 3.0 for day 1 and 123.5 ± 2.2 for day 2 (p = 0.14). The average diastolic pressure for the 10 participants was 77.2 ± 2.3 for day 1 and 73.9 ± 1.8 for day 2 (p = 0.09). The mean heart rates on days 1 and 2 were 72.6 ± 4.1 and 74.7 ± 4.1 respectively, which were statistically not different using a paired T-test (p = 0.51).
Conclusion
Measurement of carotid-femoral PWV is a simple non-invasive method to assess aortic stiffness, an independent risk factor for death and cardiovascular disease in healthy elderly, diabetics, hypertensives, and those with end stage kidney disease.2–10 Increasing interest in methods to “unstiffen” the aorta has led to small clinical trials of drug intervention.15 However, when comparing a before versus after measurement, following an intervention, it is useful to have an understanding of the day-to-day variability on the outcome measure and to appreciate variability of determinants of c-fPWV, such as mean arterial pressure. We observed that c-fPWV is highly reproducible on different days. We made the novel observation that the variation in within-subject c-fPWV measure was significantly lower on the second day compared with the first day, which could be of interest when estimating the power calculations for studies. The lower MAP on day 2 could have contributed to this finding. The statistically insignificant difference of 2 beats/min that were noted in mean heart rate on two days may have contributed to the observed PWV variability, but we think it is highly unlikely. If anything, the higher mean heart rate on day 2 should raise the average PWV value on day 2.
In summary, our findings show that the c-fPWV readings were highly reproducible between the two days. However, we noticed that the variation in the within-subject c-fPWV measure is significantly lower on the second day. Our study highlights that day-to-day variability and within-subject measurement variation, although present is not significant enough to influence the assessment of outcome measures of interventions that alter the arterial stiffness. Further, it warrants the undertaking of similar studies with a large sample size to confirm the findings.
Sources of funding
These studies were conducted in the Clinical and Translational Research Center, which is funded by Grant number
Conflicts of interest/disclosures
The authors report no financial conflicts of interest.
Acknowledgments
None.
References
Cite this article
TY  - JOUR
AU  - Radhakrishna R. Kallem
AU  - Kevin E.C. Meyers
AU  - Deirdre L. Sawinski
AU  - Raymond R. Townsend
PY  - 2013
DA  - 2013/05/01
TI  - Variation and variability in carotid-femoral pulse wave velocity
JO  - Artery Research
SP  - 230
EP  - 233
VL  - 7
IS  - 3-4
SN  - 1876-4401
UR  - https://doi.org/10.1016/j.artres.2013.04.001
DO  - 10.1016/j.artres.2013.04.001
ID  - Kallem2013
ER  -