
Central vs. peripheral blood pressure components as determinants of retinal microvessel diameters
Contributed equally to this work.
- DOI
- 10.1016/j.artres.2014.01.004How to use a DOI?
- Keywords
- Central blood pressure; Microcirculation; Retina; Peripheral blood pressure; Arterioles; Venules
- Abstract
Background: We assessed association of retinal arteriolar and venular diameters with central and peripheral blood pressure (BP).
Methods: We post-processed retinal photographs from 514 participants randomly recruited from a Flemish population (mean age, 50.6 years; 50.8% women), using IVAN software to generate retinal arteriolar (CRAE) and venular (CRVE) equivalents. We measured peripheral BP by mercury sphygmomanometry and central BP by tonometry at the carotid artery. We applied multivariable-adjusted regression analysis.
Results: For peripheral vs. central BP (mmHg) average levels were 126.6 vs. 122.1 systolic and 79.4 vs. 79.6 diastolic, and 95.1 vs. 97.9 and 47.2 vs. 42.5 for mean and pulse pressure, respectively. CRAE and CRVE averaged 153 μm and 219 μm. Effect sizes (μm) for CRAE for 1 − SD increase in peripheral vs. central BP were −3.77 vs. −3.52 systolic, −3.16 vs. −3.13 diastolic, −3.84 vs. −3.64 for mean BP, and −2.07 vs. −1.83 for pulse pressure (p ≤ 0.006). Models that included two BP components demonstrated that CRAE decreased (p ≤ 0.035) with systolic (peripheral vs. central, −2.87 vs. −2.40) and diastolic (−1.58 vs. −1.80) BP. CRAE decreased with mean BP (−3.53 vs. −3.53; p < 0.0001), but not with pulse pressure (p ≥ 0.19). CRVE was not related to any peripheral or central BP component (p ≥ 0.062). All CRAE regression slopes on corresponding peripheral and central BP components were similar (p ≥ 0.28).
Conclusion: Higher systolic, diastolic and mean BPs were associated with smaller CRAE, regardless of whether BP was measured centrally or peripherally. Central BP does not refine the inverse association of CRAE and CRVE with peripheral BP.
- Copyright
- © 2014 Association for Research into Arterial Structure and Physiology. Published by Elsevier B.V. All rights reserved.
- Open Access
- This is an open access article distributed under the CC BY-NC license.
Introduction
Non-mydriatic retinal photography allows the non-invasive assessment of the retinal micro-vessel in population studies.1–9 The central retinal arteriolar equivalent (CRAE) and central retinal venular equivalent (CRVE) represent the average arteriolar and venular diameters in the retinal microvasculature.10,11 Previous population studies established that CRAE decreases with higher blood pressure.1–9 However, all of these studies relied on peripheral blood pressure as measured at the brachial artery.1–9 Several reports suggested that central blood pressure is a more accurate marker of target organ damage.12 One recently published study reported that central pulse pressure, indicative of changes in large conduit arteries, is an independent determinant of vascular remodeling in small retinal arterioles and concluded there was crosstalk between the microvascular and macrovascular changes attributable to hypertension.13 Furthermore, the retina can be viewed as an extension of the brain. From a circulatory point of view, the brain is unique, because throughout systole and diastole it is perfused at high-volume flow14 and because the cerebral circulation is auto-regulated.15 In view of Ott’s findings13 and the high-volume flow to the brain,14 we postulated that the diameter of the retinal microvessels might be tighter associated with central than peripheral blood pressure. We therefore investigated the relations of the diameters of the retinal arterioles and venules with central and peripheral blood pressure components.
Methods
Study population
Recruitment for the Flemish Study on Environment, Genes, and Health Outcomes (FLEMENGHO) started in 1985.16 From August 1985 to November 1990, a random sample of the households living in a geographically defined area of Northern Belgium was investigated with the goal to recruit an equal number of participants in six subgroups stratified by sex and age (20–39, 40–59, and ≥60 years). All household members aged 20 years or older were invited, if the quota of their sex-age group had not yet been satisfied. From June 1996 until January 2004 recruitment of families continued using the former participants (1985–1990) as index persons and also including teenagers.16 The initial participation rate was 78.0%.
The participants were repeatedly followed up. From January 2008 to July 2012, we mailed invitation letters to 1181 former participants for a follow-up examination at our field center including imaging of the retinal microvessels and pulse wave analysis. However, 29 participants had died and 17 were bedridden or institutionalized. We obtained informed written consent from 854. The participation rate was therefore 75.2%. From our current analyses, we excluded 249 participants with retinal images of low quality and 87 without pulse wave analysis. In addition, we excluded 4 participants from analysis, because their retinal phenotypes were more than 3 SDs higher than the mean. Thus, the number of participants analyzed totaled 514. FLEMENGHO was conducted according to the principles outlined in the Helsinki Declaration for Investigation of Human Participants.17 The Ethics Committee of the Medical Faculty of the University of Leuven approved the study.
Hemodynamic measurements
Subjects had to refrain from smoking, heavy exercise, and drinking alcohol or caffeinated beverages for at least 3 h prior to the examination. After subjects had rested in the supine position for at least 15 min, trained observers (n = 4) measured blood pressure and subsequently did the arterial measurements. The observers performed two consecutive brachial blood pressure readings to the nearest 2 mmHg at the subjects’ right arm by auscultation of the Korotkoff sounds, using a standard mercury sphygmomanometer (Riester GmbH, Jungingen, Germany), according to current European guidelines.18 The two readings were averaged for analysis. Pulse pressure was systolic minus diastolic blood pressure. Mean arterial pressure was diastolic pressure plus one third of pulse pressure. Hypertension was a brachial blood pressure of at least 140 mmHg systolic or 90 mmHg diastolic or use of antihypertensive drugs.
During an 8-s period, the observers recorded the radial arterial waveform at the dominant arm by applanation tonometry. They used a high-fidelity SPC-301 micromanometer (Millar Instruments, Inc., Houston, TX) interfaced with a laptop computer running the SphygmoCor software (AtCor Medical Pty. Ltd., West Ryde, New South Wales, Australia), version 8.2. Recordings were discarded if systolic or diastolic variability of consecutive waveforms exceeded 5%, or the amplitude of the pulse wave signal was less than 80 mV. The carotid pulse wave was calibrated by mean arterial pressure and diastolic blood pressure of supine brachial blood pressure measurement at the same arm.19 From the carotid signal, the SphygmoCor software calculates the aortic pulse wave by means of a validated20,21 generalized transfer function.
Retinal phenotypes
To facilitate pupil dilation, retinal imaging took place in a dimly lit room, after participants had accommodated to the darkness for at least 5 min. An observer obtained one image per eye with a Canon Cr-DGi (Canon Co., Ltd., Kyoto, Japan) non-mydriatic retinal visualization system, combined with a digital camera (Canon D-50, Canon Co., Ltd., Kyoto, Japan). After format conversion from JPEG to TIFF images using Phatch (http://photobatch.stani.be/), one single observer (Y-P L), masked to the participants’ characteristics, identified individual arterioles and venules in duplicate, using a validated computer-assisted program IVAN (Vasculomatic ala Nicola, version 1.1, Department of Ophthalmology and Visual Science, University of Wisconsin-Madison, Madison, WI).22 This software combines the individual measurements into summary indexes: CRAE and CRVE, based on formulae published by Parr10,11 and Hubbard.23 The arteriole-to-venule ratio (AVR) was CRAE divided by CRVE. The intra-session intra-observer variability for CRAE and CRVE was 13.2% and 8.4%, respectively.24
Other measurements
At each visit, trained nurses measured the subjects’ anthropometric characteristics. They administered a questionnaire to collect information about each participant’s medical history, smoking and drinking habits, and intake of medications. Body height was measured to the nearest 0.5 cm with a pliable measurer and the participant standing against a wall. Participants wore light indoor clothing without shoes for body weight measurement. Body mass index was weight in kilograms divided by the square of height in meters.
With the subjects fasting for at least 6 h, venous blood samples were drawn for the determination of serum cholesterol and blood glucose. Diabetes was the use of antidiabetic drugs, a fasting or random blood glucose of at least 7.0 mmol/l or 11.1 mmol/l respectively,25 a self-reported diagnosis, or diabetes documented in practice or hospital records.
Statistical analysis
For database management and statistical analysis, we used SAS software, version 9.3 (SAS Institute). We compared means and proportions using the large-sample z-test, and χ2 statistic, respectively. In unadjusted categorical analyses, we tested for linear trend using an ordinal design variable coding for quartiles and the generalized linear model as implemented in the PROC GLM procedure of the SAS software package. We tested for sex difference in linear trend using an interaction term. In multiple regression analyses, we adjusted for sex, age, body mass index, ratio of HDL-to-total cholesterol in serum, and design variables (0, 1) coding for smoking, drinking, antihypertensive drug treatment. Effect sizes express the multivariable-adjusted change in CRAE and CRVE associated with a 1−SD increase in the blood pressure components. In models including two blood pressure components, we tested for collinearity using the variance inflation factor. We used the TEST statement in PROC REG to perform the multivariable analysis of variance, which tests the null hypothesis of no differences between the parameters of the regression equations. Significance was a α-level of 0.05 or less.
Results
Characteristics of participants
Women and men had similar age (mean, 50.5 years; range, 18–85 years). Table 1 summarizes their demographic characteristics. The study sample included 113 (22.0%) hypertensive patients of whom 52 (46.0%) were on antihypertensive drug treatment. Of 261 women and 253 men, 61 women (23.4%) and 59 men (23.3%) were smokers, and 85 women (32.3%) and 138 men (54.5%) reported intake of alcohol. In smokers, median tobacco use was 15 cigarettes per day (interquartile range, 7–20 cigarettes per day). In drinkers, the median alcohol consumption was 10 g per day (interquartile range, 4–17 g per day). Among women, 59 (22.6%) reported natural or surgical menopause, and 70 (13.6%) used oral contraceptives, and 15 (5.7%) took hormonal replacement therapy. None of the participants had diabetes mellitus.
| Characteristics | Women | Men | All |
|---|---|---|---|
| Number | 261 | 253 | 514 |
| Number (%) with characteristic | |||
| Current smoking | 61 (23.4) | 59 (23.3) | 120 (23.3) |
| Drinking alcohol | 85 (32.3) | 138 (54.5)§ | 233 (43.4) |
| Hypertension | 43 (16.5) | 70 (27.7)† | 113 (22.0) |
| Antihypertensive drug treatment | 26 (10.0) | 26 (10.3) | 52 (10.1) |
| Diuretics | 9 (3.45) | 9 (3.56) | 18 (3.50) |
| β-blockers | 18 (6.90) | 21 (8.30) | 39 (7.59) |
| Vasodilators | 2 (0.77) | 4 (1.58) | 6 (1.17) |
| RAAS inhibitors | 4 (1.53) | 5 (1.98) | 9 (1.75) |
| Mean (±SD) of characteristic | |||
| Age (year) | 50.4 ± 14.3 | 50.6 ± 14.8 | 50.5 ± 14.5 |
| Body mass index (kg/m2) | 24.5 ± 3.9 | 25.5 ± 3.6† | 25.0 ± 3.8 |
| Peripheral blood pressure | |||
| Systolic blood pressure (mmHg) | 124.2 ± 16.0 | 129.1 ± 13.7‡ | 126.6 ± 15.1 |
| Diastolic blood pressure (mmHg) | 76.6 ± 8.7 | 82.3 ± 9.1§ | 79.4 ± 9.3 |
| Mean arterial pressure (mmHg) | 92.4 ± 10.0 | 97.9 ± 9.4§ | 95.1 ± 10.1 |
| Pulse pressure (mmHg) | 47.6 ± 12.7 | 46.8 ± 11.6 | 47.2 ± 12.2 |
| Central blood pressure | |||
| Systolic blood pressure (mmHg) | 120.5 ± 17.0 | 123.9 ± 14.7* | 122.1 ± 16.0 |
| Diastolic blood pressure (mmHg) | 76.9 ± 8.9 | 82.3 ± 9.4§ | 79.6 ± 9.5 |
| Mean arterial pressure (mmHg) | 95.7 ± 10.8 | 100.2 ± 10.1§ | 97.9 ± 10.7 |
| Pulse pressure (mmHg) | 43.5 ± 13.5 | 41.5 ± 12.5 | 42.5 ± 13.1 |
| Total cholesterol (mmol/L) | 5.17 ± 0.92 | 4.94 ± 0.90† | 5.06 ± 0.92 |
| HDL-to-total cholesterol ratio | 0.32 ± 0.07 | 0.27 ± 0.07§ | 0.30 ± 0.08 |
| Blood glucose (mmol/L) | 4.76 ± 0.60 | 4.89 ± 0.57† | 4.82 ± 0.59 |
Abbreviations: HDL, high-density lipoprotein; RAAS, renin–angiotensin–aldosterone system. Vasodilators include calcium channel blockers and α-blockers. RAAS inhibitors include angiotensin II converting-enzyme inhibitors and angiotensin II type-1 receptor blockers.
Significance of the sex difference:
p < 0.05;
p < 0.01;
p < 0.001;
p < 0.0001.
Baseline characteristics.
In all participants (Table 2), CRAE and CRVE averaged 152.7 μm and 219.0 μm, respectively. CRAE and the arteriole-to-venule ratio were larger in women compared to men (p ≤ 0.046), but CRVE was not significantly different between the two sexes (p = 0.063). The correlation coefficient between CRAE and CRVE was 0.57 (p < 0.0001).
| Characteristics | Women | Men | All |
|---|---|---|---|
| Number | 261 | 253 | 514 |
| Central retinal arteriolar equivalent (μm) | 154.9 ± 13.7 | 150.4 ± 13.7‡ | 152.7 ± 13.9 |
| Central retinal venular equivalent (μm) | 220.6 ± 20.0 | 217.4 ± 18.6 | 219.0 ± 19.4 |
| Arteriole-to-venule ratio | 0.70 ± 0.06 | 0.69 ± 0.06* | 0.70 ± 0.06 |
Values were mean ± SD. Significance of the sex difference:
p < 0.05;
p < 0.01;
p < 0.001.
Retinal vascular phenotypes of participants.
Categorical analyses of the associations with blood pressure
In both women and men, CRAE significantly (p ≤ 0.052) decreased across increasing quartiles of the distributions of peripheral and central blood pressure. In women and men alike, CRVE decreased with increasing quartiles of central systolic and mean blood pressure (p ≤ 0.047), but did not show a significant trend for all of the components of peripheral blood pressure (p ≥ 0.077) nor for central diastolic and pulse pressure (p ≥ 0.066). None of the interaction terms between trend and sex was statistically significant (p ≥ 0.084). We therefore pooled women and men. In both sexes combined, CRAE decreased with increasing quartiles of peripheral and central blood pressure components (p ≤ 0.004, Fig. 1). Similarly, in all participants, CRVE (p ≤ 0.032, Fig. S1) decreased across increasing quartiles of the distributions of peripheral and central blood pressure, except for CRVE in relation to peripheral pulse pressure (p = 0.23).
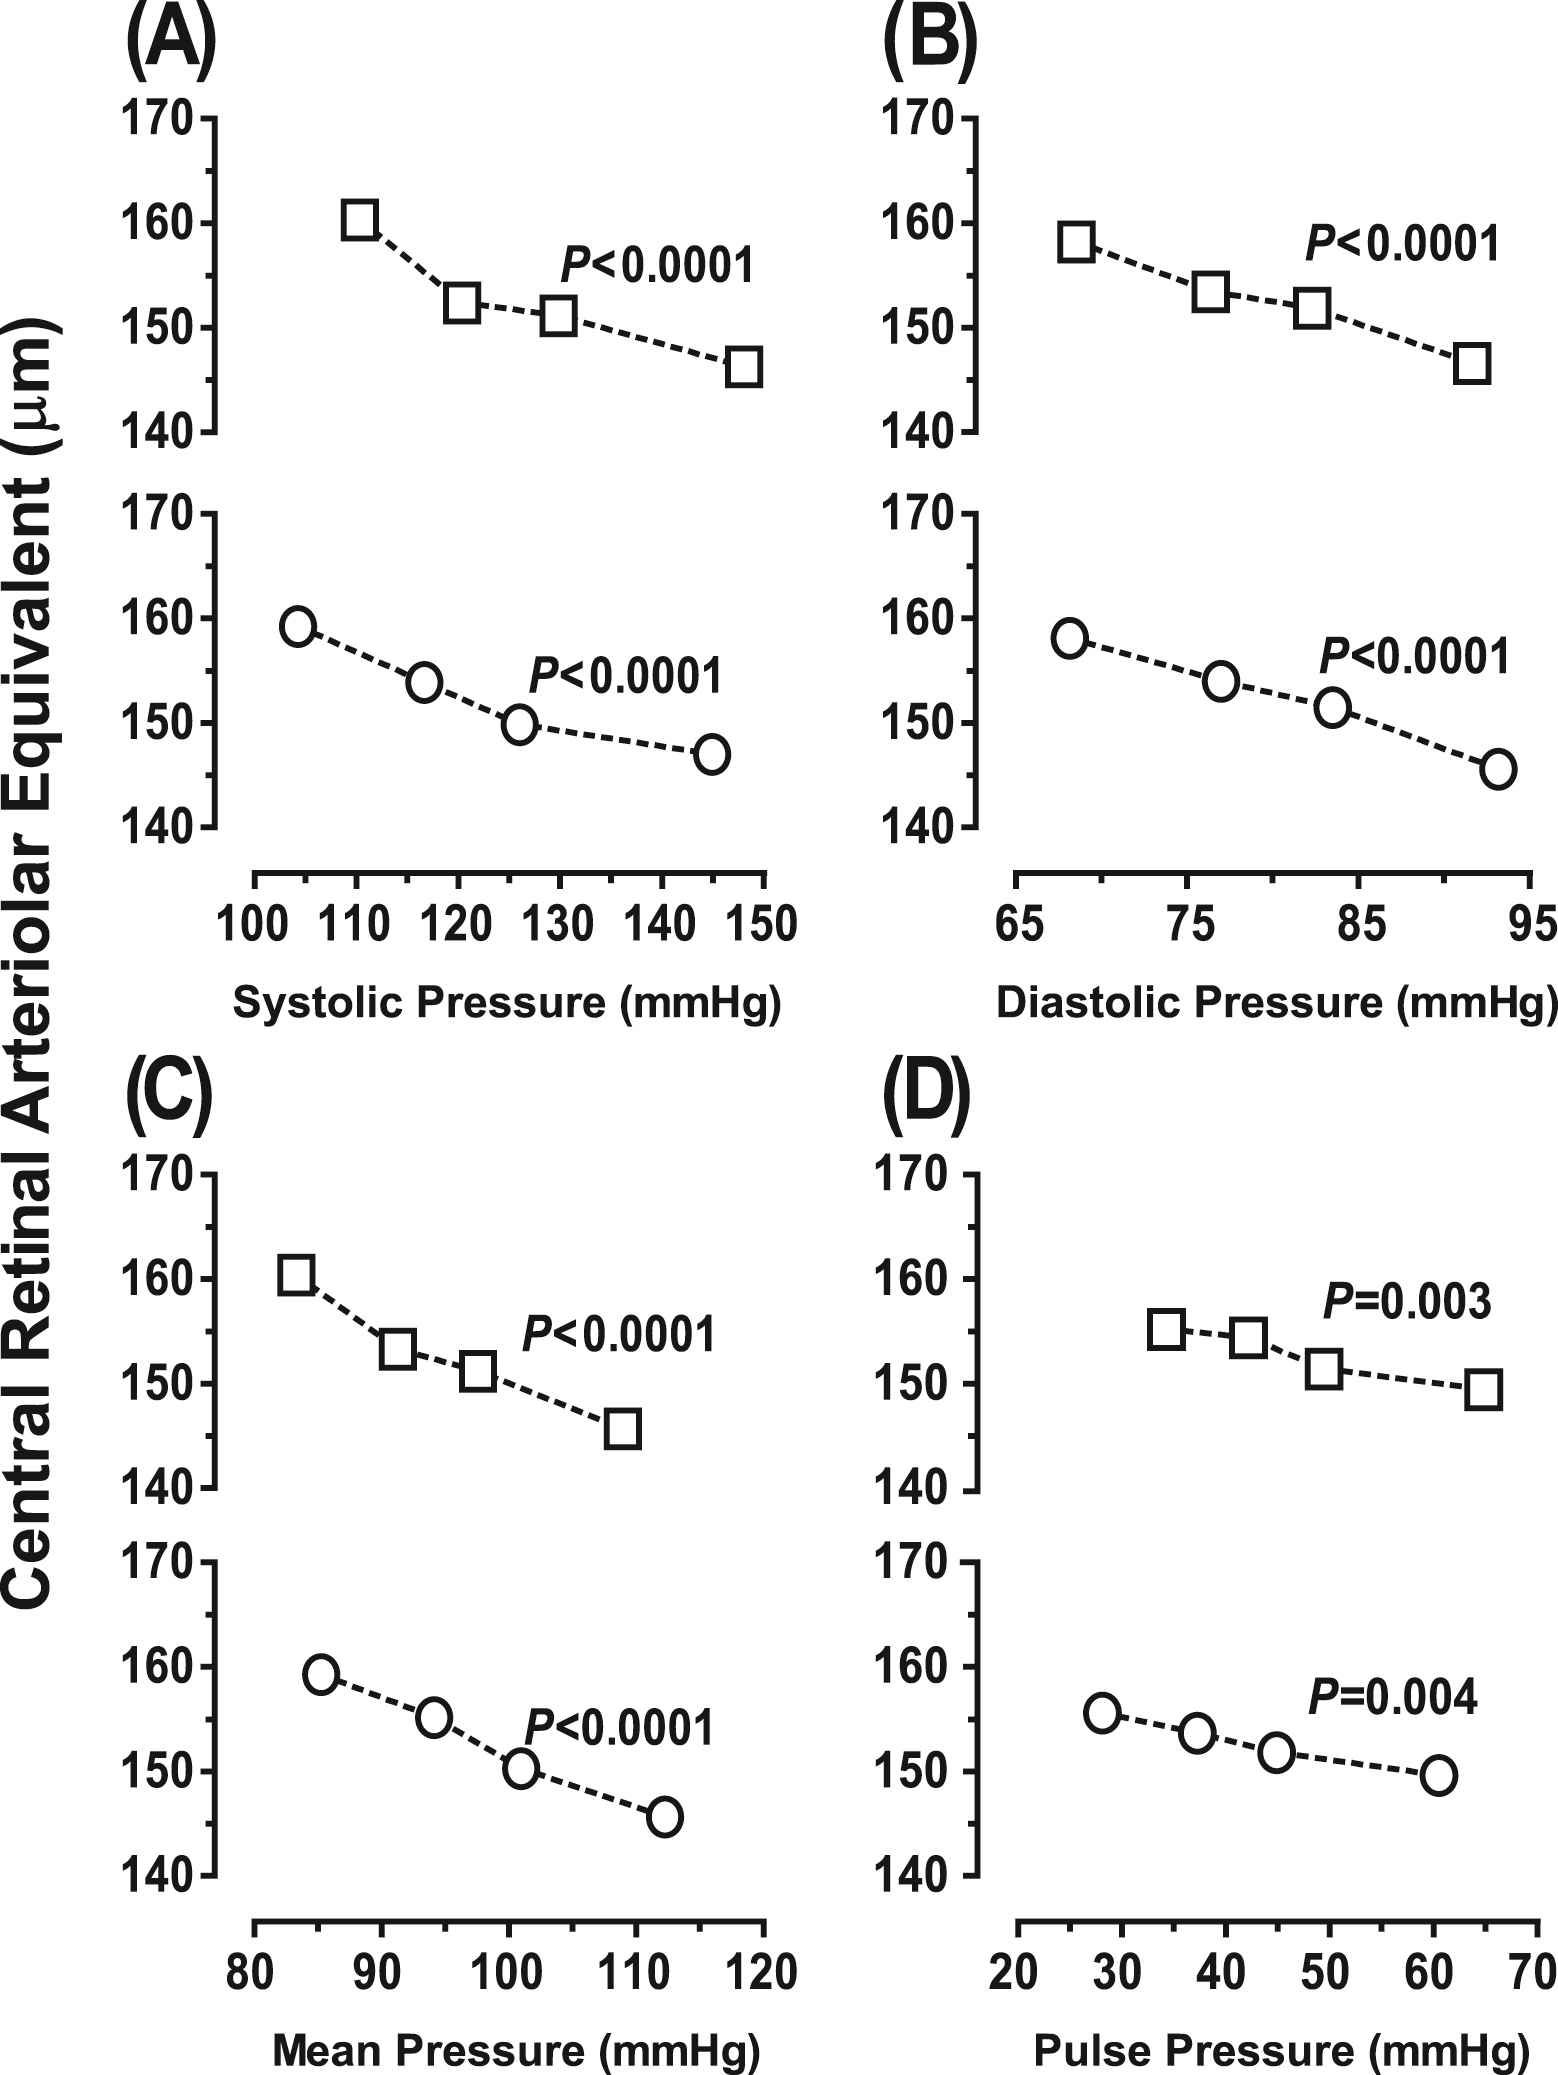
Central retinal arteriolar equivalent across increasing quartiles of systolic (A), diastolic (B), mean (C) and pulse (D) pressure, as measured peripherally (□) or centrally (O) in 514 participants (261 women and 253 men). p Values denote the significance of linear trend. None of the sex-by-trend interaction terms reached significance (p ≥ 0.16).
Multivariable-adjusted analyses of the associations with blood pressure
Peripheral Blood Pressure—With adjustments applied for sex, age, body mass index, smoking and drinking, the HDL-to-total cholesterol ratio and antihypertensive drug treatment (Table 3), CRAE decreased (p ≤ 0.001) with all single components of peripheral blood pressure. The effect sizes for a 1−SD increase were −3.77 μm for systolic pressure, −3.16 μm for diastolic pressure, −3.84 μm for mean pressure and −2.07 μm for pulse pressure. Models that included two blood pressure components demonstrated that CRAE decreased (p ≤ 0.035) with both systolic (−2.87 μm) and diastolic (−1.58 μm) blood pressure. In models that included both the steady and pulsatile component of peripheral blood pressure, only mean pressure remained significant with an effect size of −3.53 μm. The variance inflation factors in models including two blood pressure components did not exceed 1.81. CRVE was not related to peripheral blood pressure components, irrespective of whether models included a single or two blood pressure components (Table 3; p ≥ 0.062).
| Independent variables | Central retinal arteriolar equivalent | Central retinal venular equivalent | ||||||
|---|---|---|---|---|---|---|---|---|
| β (95% CI) | r2 | p | VIF | β (95% CI) | r2 | p | VIF | |
| Single blood pressure component | ||||||||
| Systolic pressure (mmHg) | −3.77 (−4.96 to −2.60) | 0.067 | <0.0001 | 1.23 | −1.66 (−3.44 to 0.11) | 0.007 | 0.06 | 1.23 |
| Diastolic pressure (mmHg) | −3.16 (−4.44 to −1.89) | 0.049 | <0.0001 | 1.19 | −0.84 (−2.66 to 0.98) | 0.002 | 0.35 | 1.19 |
| Mean pressure (mmHg) | −3.84 (−5.02 to −2.65) | 0.072 | <0.0001 | 1.23 | −1.41 (−3.19 to 0.37) | 0.004 | 0.13 | 1.23 |
| Pulse pressure (mmHg) | −2.07 (−3.27 to −0.88) | 0.021 | 0.001 | 1.17 | −1.34 (−3.01 to 0.33) | 0.005 | 0.12 | 1.17 |
| Two blood pressure components | ||||||||
| Model 1 | ||||||||
| Systolic pressure (mmHg) | −2.87 (−4.35 to −1.39) | 0.027 | 0.0002 | 1.81 | −1.81 (−3.88 to 0.26) | 0.005 | 0.10 | 1.81 |
| Diastolic pressure (mmHg) | −1.58 (−3.04 to −0.12) | 0.009 | 0.035 | 1.76 | 0.19 (−2.00 to 2.37) | <0.001 | 0.88 | 1.76 |
| Model 2 | ||||||||
| Mean pressure (mmHg) | −3.53 (−4.72 to −2.35) | 0.055 | <0.0001 | 1.39 | −1.01 (−2.99 to 0.97) | 0.002 | 0.29 | 1.39 |
| Pulse pressure (mmHg) | −0.85 (−2.05 to 0.34) | 0.003 | 0.19 | 1.33 | −0.98 (−2.89 to 0.94) | 0.002 | 0.27 | 1.33 |
All models were adjusted for sex, age, body mass index, smoking and drinking, ratio of HDL-to-total serum cholesterol, and antihypertensive drug treatment. β (95% confidence interval), r2, and p, indicate effect size (95% confidence interval), the squared partial correlation coefficient, and significance, respectively. Effect sizes express the change in central retinal arteriolar or venular equivalent associated with a 1−SD increase in the blood pressure component. SDs were 15.1 mmHg, 9.3 mmHg, 10.1 mmHg, and 12.2 mmHg for systolic, diastolic, mean arterial pressure and pulse pressure, respectively. VIF indicates the variance inflation factor.
Relation of retinal vessel diameters with peripheral blood pressure components.
Central Blood Pressure—In multivariable-adjusted analyses (Table 4), CRAE decreased (p ≤ 0.006) with all single components of central blood pressure. The effect sizes were −3.52 μm for systolic pressure, −3.13 μm for diastolic pressure, −3.64 μm for mean pressure and −1.83 μm for pulse pressure. Models that included two blood pressure components demonstrated that CRAE decreased (p ≤ 0.015) with both systolic (−2.40 μm) and diastolic (−1.80 μm) blood pressure. In models that included both the steady and pulsatile components of central blood pressure, only mean pressure remained significant with an effect size of −3.53 μm. The variance inflation factors in models including two blood pressure components were not higher than 1.90. CRVE was unrelated to central blood pressure components, irrespective of whether models included a single or two components (Table 4; p ≥ 0.093).
| Independent variables | Central retinal arteriolar equivalent | Central retinal venular equivalent | ||||||
|---|---|---|---|---|---|---|---|---|
| β (95% CI) | r2 | p | VIF | β (95% CI) | r2 | p | VIF | |
| Single blood pressure component | ||||||||
| Systolic pressure (mmHg) | −3.52 (−4.77 to −2.26) | 0.057 | <0.0001 | 1.29 | −1.60 (−3.48 to 0.28) | 0.006 | 0.09 | 1.29 |
| Diastolic pressure (mmHg) | −3.13 (−4.25 to −2.02) | 0.049 | <0.0001 | 1.18 | −0.76 (−2.43 to 0.91) | 0.002 | 0.37 | 1.18 |
| Mean pressure (mmHg) | −3.64 (−4.90 to −2.38) | 0.066 | <0.0001 | 1.19 | −1.18 (−2.85 to 0.50) | 0.003 | 0.20 | 1.19 |
| Pulse pressure (mmHg) | −1.83 (−3.12 to −0.55) | 0.015 | 0.006 | 1.26 | −1.18 (−2.98 to 0.62) | 0.004 | 0.18 | 1.26 |
| Two blood pressure components | ||||||||
| Model 1 | ||||||||
| Systolic pressure (mmHg) | −2.40 (−3.97 to −0.83) | 0.020 | 0.001 | 1.90 | −1.60 (−3.79 to 0.59) | 0.004 | 0.16 | 1.90 |
| Diastolic pressure (mmHg) | −1.80 (−3.29 to −0.31) | 0.011 | 0.015 | 1.74 | 0.07 (−1.98 to 2.11) | <0.001 | 0.95 | 1.74 |
| Model 2 | ||||||||
| Mean pressure (mmHg) | −3.53 (−4.79 to −2.27) | 0.052 | <0.0001 | 1.54 | −0.75 (−2.64 to 1.14) | 0.001 | 0.43 | 1.54 |
| Pulse pressure (mmHg) | −0.26 (−1.54 to 1.02) | <0.001 | 0.73 | 1.45 | −0.92 (−2.97 to 1.14) | 0.001 | 0.37 | 1.45 |
All models were adjusted for sex, age, body mass index, smoking and drinking, ratio of HDL-to-total serum cholesterol, and antihypertensive drug treatment. β (95% confidence interval), r2, and p, indicate effect size (95% confidence interval), the squared partial correlation coefficient, and significance, respectively. Effect sizes express the change in central retinal arteriolar or venular equivalent associated with a 1−SD increase in the blood pressure component. SDs were 16.0 mmHg, 9.5 mmHg, 10.7 mmHg, and 13.1 mmHg for systolic, diastolic, mean arterial pressure and pulse pressure, respectively. VIF indicates the variance inflation factor.
Relation of retinal vessel diameters with central blood pressure components.
Comparison of Effect Sizes for Peripheral and Central Blood Pressure—In multivariable analyses comparing the regression slopes of CRAE or CRVE on peripheral vs. central blood pressure components, none of the differences reached significance (p ≥ 0.28). This is illustrated for CRAE in Fig. 2 and CRVE in Fig. S2.
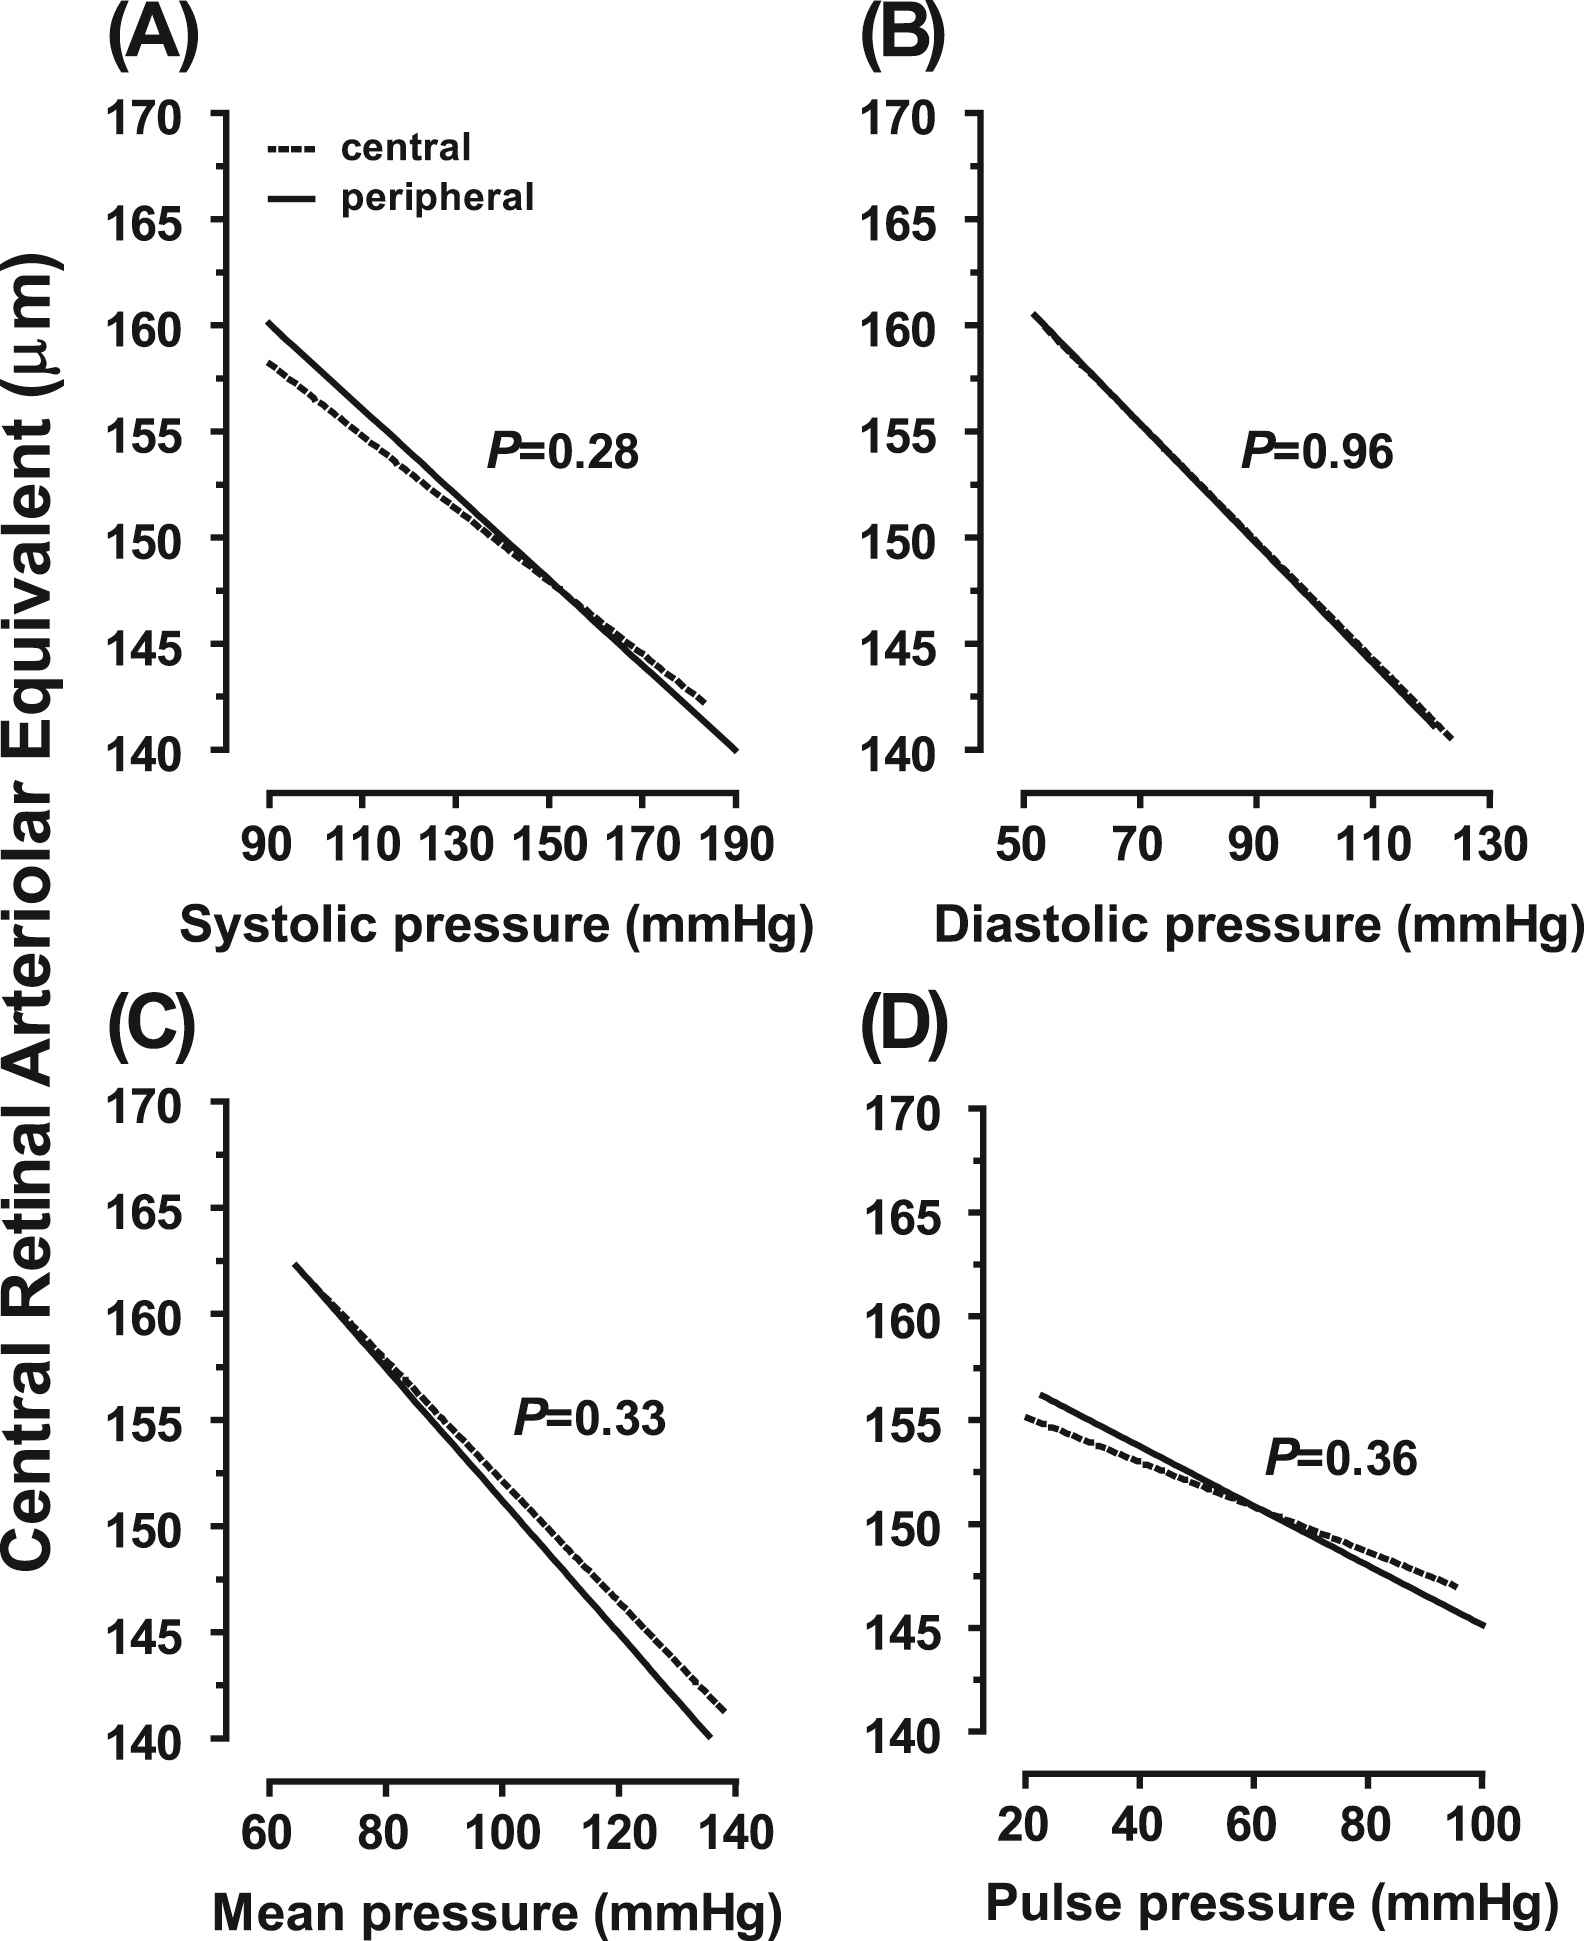
Regression slopes of the central retinal arteriolar equivalent on systolic (A), diastolic (B), mean (C) and pulse (D) pressure on peripheral (— —) and central (……) measurement. All models were adjusted for sex, age, body mass index, smoking and drinking, ratio of HDL-to-total serum cholesterol, and antihypertensive drug treatment. p Values denote the significance of the difference in slope between peripheral and central blood pressure.
Sensitivity Analyses—Our results remained consistent after exclusion of 52 patients on antihypertensive drug treatment except for the appearance of a borderline significant inverse association of CRVE with peripheral (Table S1; p = 0.023) and central (Table S2; p = 0.057) systolic blood pressure. The associations of CRAE and CRVE with peripheral and central blood pressure were independent of smoking and drinking as tested by the appropriate interaction terms (0.065 ≤ p ≤ 0.98). In addition, our results did not materially change, if we accounted for relatedness, using mixed models with pedigree modeled as a random effect, or if we adjusted our analyses for the four drug classes listed in Table 1. Finally, we did a sensitivity analysis, in which we added the fellow vessel diameter as an additional covariable to models describing the relation of CRAE or CRVE with peripheral (Table S3) or central (Table S4) blood pressure components. Fellow vessel adjustment indicates that models with CRAE as dependent variable additionally included CRVE as covariable and vice versa. Fellow vessel adjustment did not alter the results for CRAE. However, it introduced significance in the associations of CRVE with diastolic and mean arterial pressure, irrespective of whether blood pressure was measured peripherally (Table S3) or centrally (Table S4).
Discussion
In the light of the available literature, we hypothesized that the central blood pressure components would be tighter associated with the diameter of the retinal microvessels than peripheral blood pressure components. The key findings of our study were (i) that CRAE was equally associated with peripheral and central blood pressure with no differences in the observed effect sizes or regression slopes; (ii) that CRAE decreased with higher systolic and diastolic blood pressure and mean arterial pressure, but not pulse pressure; (iii) and that CRVE was only weakly associated with blood pressure, irrespective of where it was measured.
To the best of our knowledge, only two previous studies13,26 addressed the association between the diameter of the retinal microvessels and central blood pressure, and none formally compared central with peripheral blood pressure. In 121 adolescents (mean age, 16.2 years), Murgan and coworkers observed an inverse association of CRAE with systolic blood pressure as measured peripherally (r = −0.201; p = 0.043) or centrally (r = −0.205; p = 0.041).26 In line with our current findings, these correlation coefficients were similar. They remained significant with adjustments applied for body mass index and the central augmentation index. CRVE was not correlated with blood pressure.26 Ott and colleagues assessed the wall-to-lumen ratio of retinal arterioles in 135 non-diabetic patients whose blood pressure averaged (±SD) 135 ± 16 mmHg systolic and 83 ± 12 mmHg diastolic.13 The wall-to-lumen ratio correlated with peripheral and central systolic pressure (r = −0.212 and −0.270, respectively; p ≤ 0.014) and peripheral and central pulse pressure (r = −0.270 and −0.302; p ≤ 0.002). In multivariable-adjusted analyses, the slopes of peripheral and central pulse pressure remained significant (p ≤ 0.017), amounting to 0.219 units/mmHg and 0.269 units/mmHg, respectively. In contrast, the association of the retinal arteriolar wall-to-lumen ratio with central mean arterial pressure was not significant.13 Using a ratio rather than the absolute diameter might explain the apparent divergence between Ott’s13 and our current observations. In our study, the correlation coefficients and regression slopes describing the association between the diameter of the retinal microvessels and blood pressure components were similar for peripheral and central blood pressure. Comparison with Ott’s findings would have been easier had he reported whether associations of the lumen-to-wall ration were driven by the nominator or denominator of the ratio, or both.
Our current findings are in line with previous population studies, which all reported on peripheral blood pressure in relation to the retinal microvasculature.1–9 In 9300 non-diabetic participants enrolled in the Atherosclerosis Risk in Communities Study, generalized narrowing of small retinal arterioles was strongly and monotonically related with higher mean arterial pressure.1 In the over 4600 participants enrolled in the Beaver Dam Eye Study (age range, 43–86 years; 56.0% women), for each 10-mmHg in increase in mean arterial pressure, CRAE decreased by 4.4 μm (95% confidence interval [CI], 3.8–5.0; p < 0.001)3 and CRVE decreased by 0.33 μm (CI, 0.20–0.46; p < 0.001).9 Findings in the Blue Mountains Eye Study4 and the Rotterdam Study5 were similar. In 3355 participants enrolled in the former study (mean age, 65.5 years; 56.5% women),4 for every 10-mmHg increase in mean arterial blood pressure, CRAE and CRVE decreased (p < 0.001) by 3.5 μm and 0.96 μm, respectively. In the over 7000 participants enrolled in the Rotterdam Study (mean age, 68.0 years; 59.0% women),5 both CRAE and CRVE decreased with systolic, diastolic and pulse pressure. For CRAE, the effect sizes for a 10-mmHg increase in peripheral pressure were −1.1 μm (CI, −1.3 to −0.9) systolic, −2.1 μm (CI, −2.5 to −1.8) diastolic, and −0.8 μm (CI, −1.1 to −0.6) for pulse pressure; for CRVE, the corresponding estimates were −0.5 μm (CI, −0.7 to −0.2), −0.7 μm (CI, −1.1 to −0.2), and −0.5 μm (CI, −0.8 to −0.1), respectively.5 Other studies confirmed the inverse association between CRAE and peripheral systolic pressure6 or mean arterial pressure7,8 in other ethnicities, including Blacks,6 Chinese,6,7 Hispanics,6 Indians,7 and Malay.7,8
Liew and colleagues27 reported that the main determinant of retinal venular diameter was arteriolar diameter, with arteriolar diameter explaining approximately 30% of the variability in venular diameter presumably due to shared genetic and environmental determinants (e.g. lifestyle factors)28 as well as magnification artifacts.23 We therefore performed a sensitivity analysis, in which CRAE was additionally adjusted for CRVE and vice versa. For CRAE fellow vessel adjustment did not alter our results. However, it produced significant positive associations of CRVE with diastolic and mean arterial pressure, irrespective of whether blood pressure was measured peripherally or centrally. In our current study, arterial diameter decreased with mean arterial pressure and diastolic blood pressure. We speculate that in the presence of a higher steady component of blood pressure, hardening of the arterioles at venular–arteriolar crossings might compress the venules thereby increasing their diameter. We also noticed that women had a slight but significantly greater arteriolar diameter than men. This small 3% difference, existed the intra-observer variability can be explained by a systematic sex difference.
The present study must be interpreted within the context of some limitations. First, compared with previous population studies our sample size was substantially smaller. Because the absolute effect size of blood pressure is greater for CRAE than CRVE, lack of power might have prevented us to observe significant association of CRVE with blood pressure. Nevertheless, among nine large studies1–9 only three found an association between CRVE and peripheral blood pressure.4,5,9 Second, like most other studies1–9 ours had a cross-sectional design. It can therefore only demonstrate association without inference about causality. Third, we had to exclude 253 participants because of ungradable or unreliable retinal photographs. Compared to the excluded participants, the analyzed participants were younger (51.8 vs. 58.9 years; p < 0.0001) and had lower systolic blood pressure (126.6 vs. 132.6 mmHg; p < 0.0001), while their distributions of sex (50.8% vs. 49.4% women; p = 0.72) and diastolic blood pressure (79.4 vs. 79.2 mmHg; p = 0.85) were similar. Finally, collinearity might cause models to become unstable when they include two blood pressure components. There are no formal criteria for deciding whether the variance inflation factor is large enough to affect the variance of the estimate regression coefficient. According to statistical experts, variance inflation values greater than 10 indicate collinearity among the predictor variables that warrant corrective action.29 In our analyses, the variance inflation factors never exceeded a value of two.
We believe that our current study contributes to the interpretation of previous research on retinal microvessels and highlights novel avenues for future research. ECG gating of imaging the retinal vessels demonstrated that the retinal venular diameter decreases in early systole, whereas the arteriolar diameter peaked in mid-late systole.30 These observations30 are consistent with the concept that the retinal microcirculation, being part of the cerebrovascular arterial bed, is characterized by high-volume pulsatile blood flow.14 We believe that ECG gating might be necessary to demonstrate a difference between peripheral and central blood pressure components in relation to the diameter of the retinal microvessels. Indeed, the travel distance of the pulse wave from the heart to the central arteries is shorter than to the peripheral circulation. It follows that without proper ECG gating and repetitive retinal photographing during the cardiac cycle, it might be impossible to demonstrate difference between peripheral and central blood pressure components of the retinal microvessels. Furthermore, four longitudinal studies, including 6247 adults and reviewed by Chew and colleagues,31 with follow-up ranging from 3 to 7 years consistently showed that generalized retinal arteriolar narrowing was associated with an increased risk of incident hypertension. The review of Chew and colleagues31 might be reconciled with the concept that high blood pressure precedes retinal arterial narrowing by future studies based on out-of-the-office rather than office blood pressure measurement.32 Indeed, masked hypertension that is an elevated blood pressure on out-of-the-office measurement in the presence of a normal office blood pressure is associated with target organ damage, including retinal changes,32 and increased cardiovascular risk,33,34 and often progresses to sustained hypertension with an elevated blood pressure both inside and outside the office.33,34
Based on our observations in randomly recruited people, central systolic and mean blood pressure have a significantly negative association with the retinal vessel diameter. Compared with the peripheral blood pressure, the central blood pressure did not refine any association with the retinal vessel diameter. We believe that future research on the morphology of the retinal microcirculation in relation to peripheral and central blood pressure should be refined by ECG gating30 and that prospective studies on the cause–effect relation between retinal arterial narrowing and hypertension should be based on 24-h ambulatory blood pressure monitoring32–34 rather than office blood pressure measurement alone. Until results from research based on these technologies become available, clinicians might continue seeing peripheral rather than central blood pressure as a risk factor for damage of the retinal microvasculature. In addition, 24-h ambulatory blood pressure monitoring might be recommended if retinal arterial narrowing is diagnosed in patients with a normal blood pressure on office measurement.32–34
Conflicts of interest
None of the authors declares a conflict of interest.
Acknowledgments
The
Appendix A
Supplementary data
Supplementary data related to this article can be found at
References
Cite this article
TY  - JOUR
AU  - Yu-Mei Gu
AU  - Yan-Ping Liu
AU  - Lutgarde Thijs
AU  - Tatiana Kuznetsova
AU  - Fang-Fei Wei
AU  - Harry A.J. Struijker-Boudier
AU  - Peter Verhamme
AU  - Jan A. Staessen
PY  - 2014
DA  - 2014/02/08
TI  - Central vs. peripheral blood pressure components as determinants of retinal microvessel diameters
JO  - Artery Research
SP  - 35
EP  - 43
VL  - 8
IS  - 2
SN  - 1876-4401
UR  - https://doi.org/10.1016/j.artres.2014.01.004
DO  - 10.1016/j.artres.2014.01.004
ID  - Gu2014
ER  -