
Noninvasive evaluation of varying pulse pressures in vivo using brachial sphymomanometry, applanation tonometry, and Pulse Wave Ultrasound Manometry
- DOI
- 10.1016/j.artres.2017.02.002How to use a DOI?
- Keywords
- Abdominal aorta; Blood pressure; Central pulse pressure; Elastography; Hypertension; Pulse wave imaging; Pulse wave velocity; Ultrasound imaging
- Abstract
The routine assessment and monitoring of hypertension may benefit from the evaluation of arterial pulse pressure (PP) at more central locations (e.g. the aorta) rather solely at the brachial artery. Pulse Wave Ultrasound Manometry (PWUM) was previously developed by our group to provide direct, noninvasive aortic PP measurements using ultrasound elasticity imaging. Using PWUM, radial applanation tonometry, and brachial sphygmomanometry, this study investigated the feasibility of noninvasively obtaining direct PP measurements at multiple arterial locations in normotensive, pre-hypertensive, and hypertensive human subjects. Two-way ANOVA indicated a significantly higher aortic PP in the hypertensive subjects, while radial and brachial PP were not significantly different among the subject groups. No strong correlation (r2 < 0.45) was observed between aortic and radial/brachial PP in normal and pre-hypertensive subjects, suggesting that increases in PP throughout the arterial tree may not be uniform in relatively compliant arteries. However, there was a relatively strong positive correlation between aortic PP and both radial and brachial PP in hypertensive subjects (r2 = 0.68 and 0.87, respectively). PWUM provides a low-cost, non-invasive, and direct means of measuring the pulse pressure in large central arteries such as the aorta. When used in conjunction with peripheral measurement devices, PWUM allows for the routine screening of hypertension and monitoring of BP-lowering drugs based on the PP from multiple arterial sites.
- Copyright
- © 2017 Association for Research into Arterial Structure and Physiology. Published by Elsevier B.V. All rights reserved.
- Open Access
- This is an open access article distributed under the CC BY-NC license.
Introduction
Hypertension is a highly prevalent cardiovascular risk condition that affects nearly 1 billion people globally,1 increasing the risk of heart disease and stroke by 3–4 times.2 In current clinical practice, the diagnosis and monitoring of hypertension is based on peripheral blood pressure measurements taken from the brachial artery using a sphygmomanometer. However, the central blood pressure (CBP) near the heart (i.e. in large arteries such as the aorta) has been recognized to play a key role in the pathogenesis of cardiovascular disease.3–5 The distending pressure in the large elastic arteries is a key determinant of the degenerative changes that characterize accelerated aging and hypertension.6 Furthermore, it has been demonstrated that different anti-hypertensive pharmacological treatments may have different effects on CBP reduction while maintaining similar brachial BP reduction.6,7 These findings support the need to account for CBP during hypertension treatment and monitoring.
Pulse pressure (PP), defined as the difference between the systolic and diastolic blood pressures (i.e. the pressure increase required to generate a pulse), has been recognized by several studies as a significant predictor of all-cause cardiovascular mortality and morbidity.3,8,9 PP arises from the interaction of cardiac ejection (stroke volume) and the properties of the arterial circulation. An increased stiffness of the large arteries leads to an increase in PP due to a reduction in arterial compliance and increased speed of wave reflections.10 The PP in peripheral arteries is commonly assessed using cuff sphygmomanometry at the brachial site and applanation tonometry at the radial site.11 However, the PP in large arteries remains challenging to measure clinically, as the only method to obtain a direct measurement of central PP in the clinic is by way of a highly invasive arterial catheter. Many longitudinal clinical research studies3,12–16 have employed radial applanation tonometry with a generalized transfer function to derive central PP in large populations of patients. However, an indirect method may not be used for evaluation on an individual case-by-case basis.
Pulse Wave Ultrasound Manometry (PWUM) was previously developed by our group17 as a noninvasive, easy-to-use central PP measurement technique based on the regional pulse wave propagation characteristics obtained using ultrasound elasticity imaging. Initial feasibility studies have demonstrated the reproducibility (∼11% average intra-subject variability) of the method and its high correlation (0.94 < r2 < 0.98) with the aortic PP waveforms obtained using radial applanation tonometry and a generalized transfer function in healthy, normotensive subjects. A block diagram of the PWUM technique on a normal human aorta is shown in Fig. 1. Aortic wall displacements and pulse wave velocity (PWV) are estimated using our established Pulse Wave Imaging (PWI) technique,18–25 and the incremental distension curve is obtained by subtracting the posterior wall displacements from anterior wall displacements at the central scan line to avoid angle artifacts. The theoretical basis for PWUM is formed by combining the Laplace Law26 and the Modified Moens–Korteweg Equation,27–29 thus relating an incremental change in fluid pressure (dP) to the PWV, incremental distension (dR), fluid density (ρ), Poisson’s ratio (ν), and lumen radius (R).
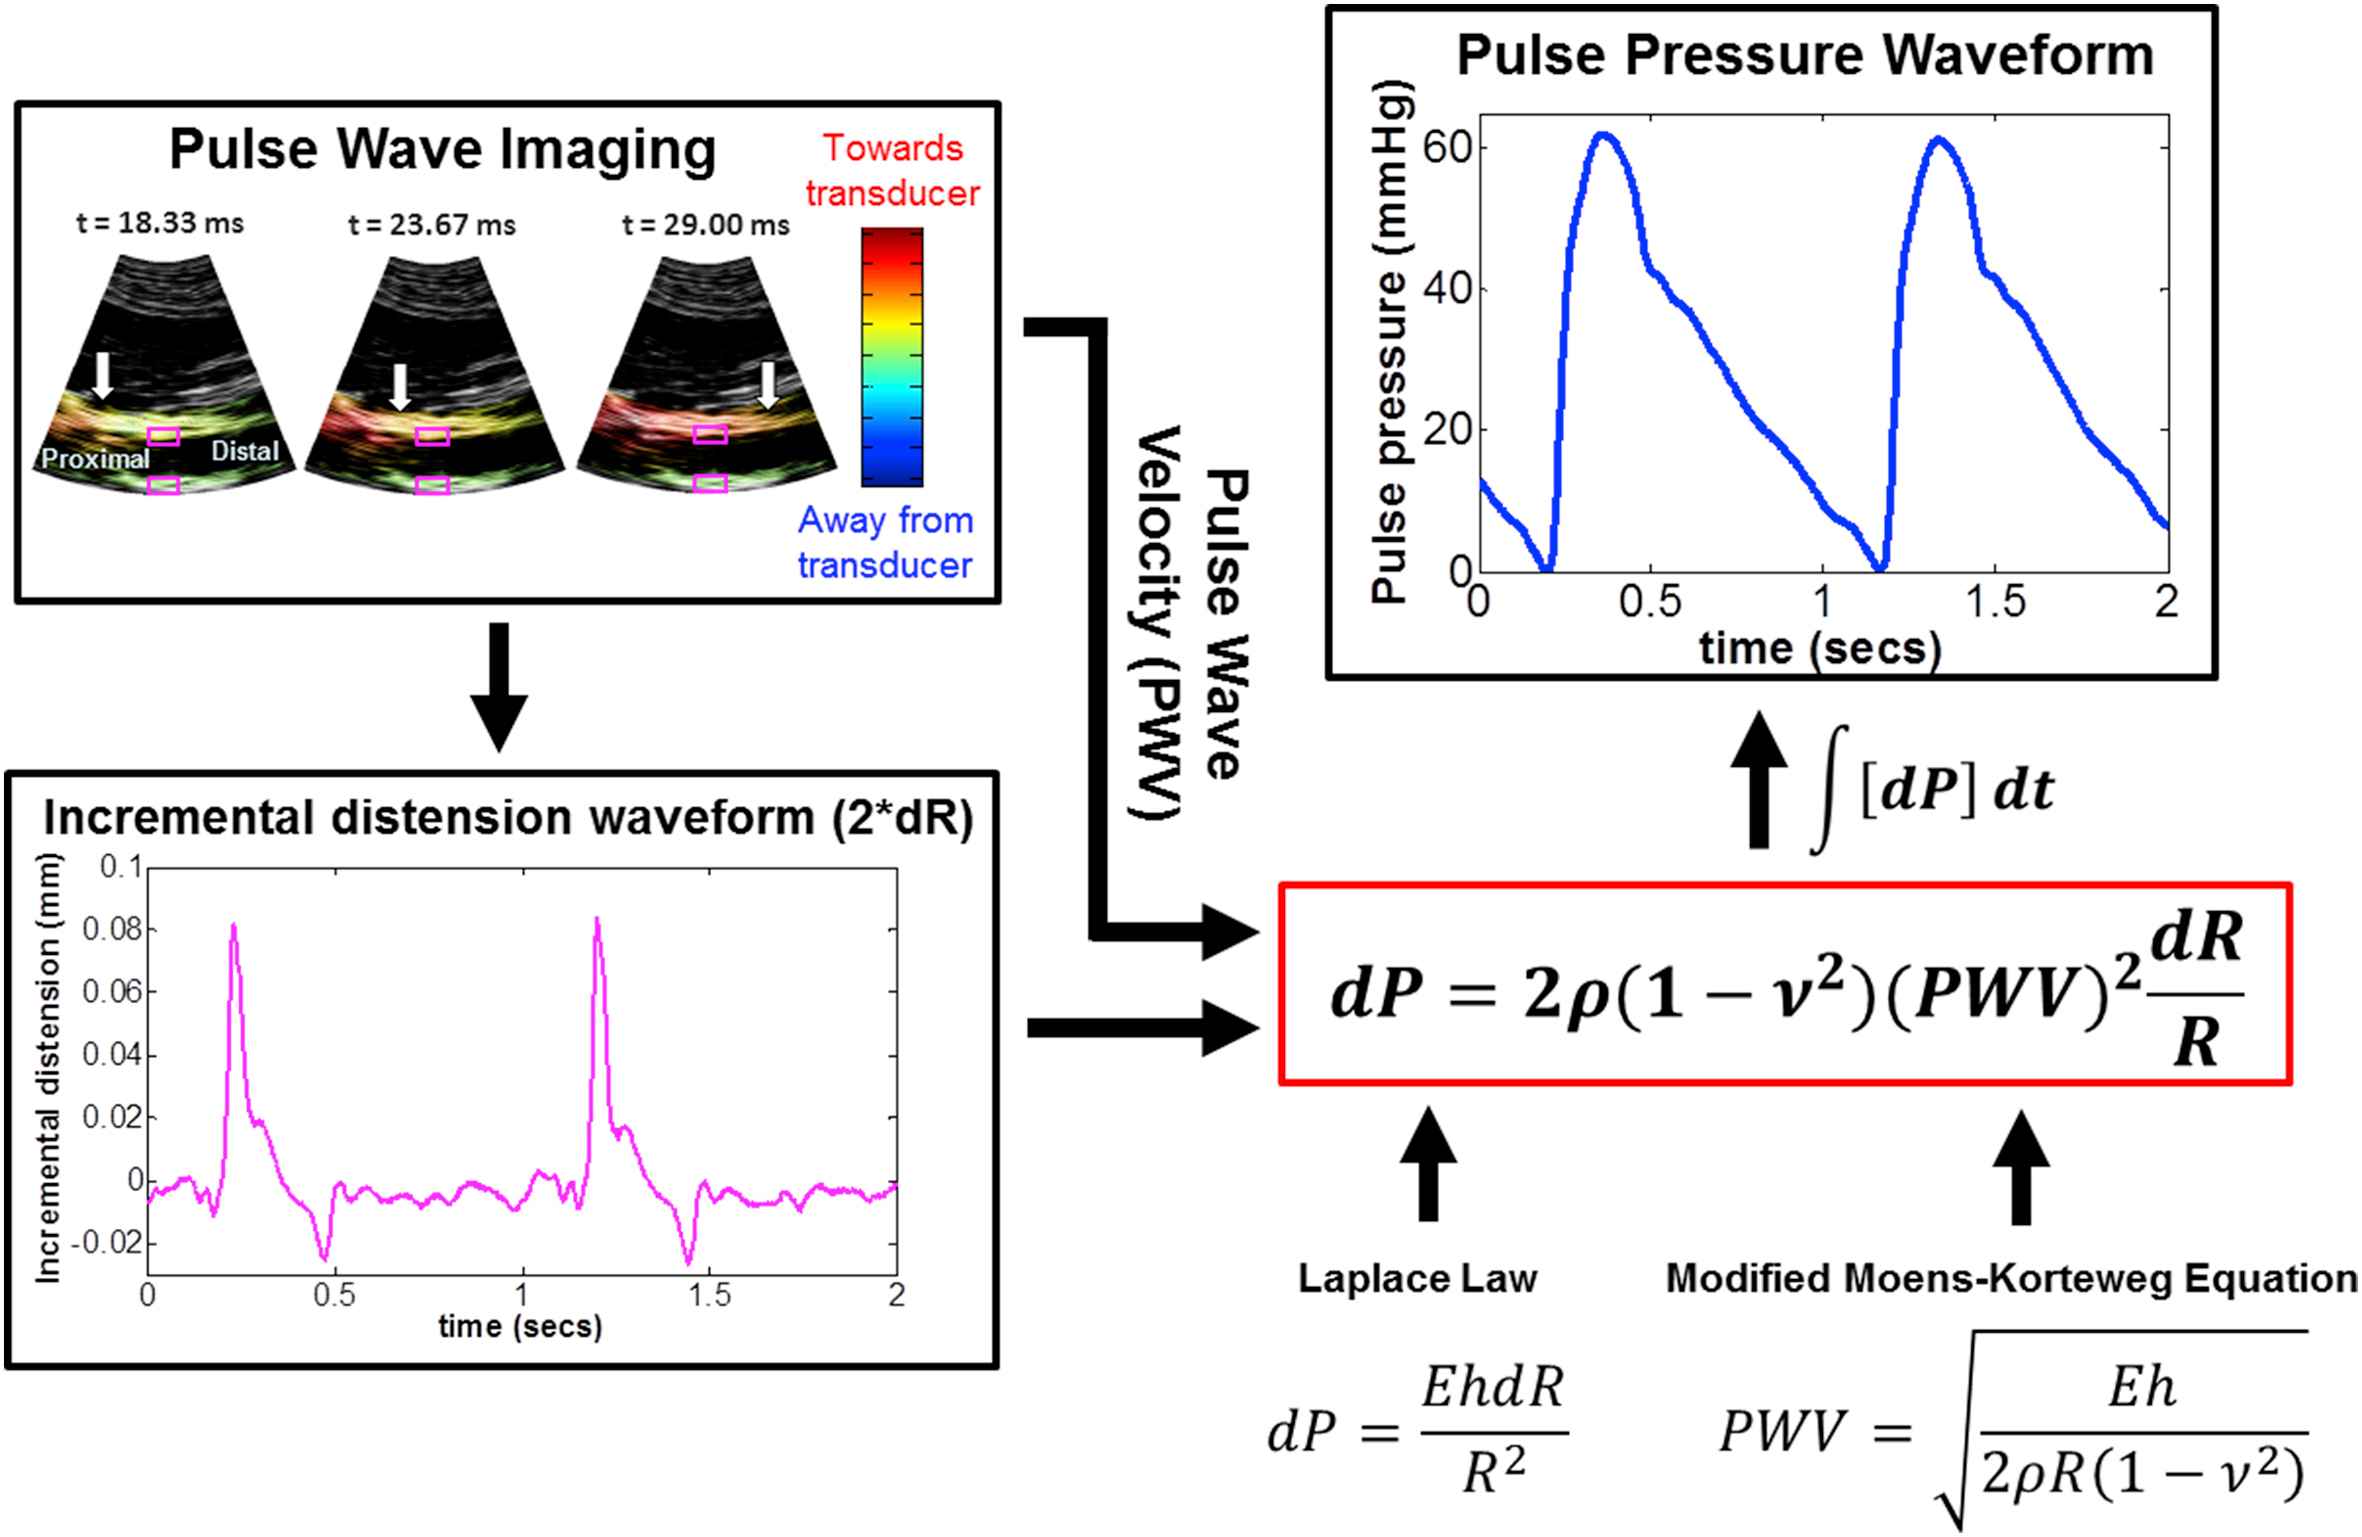
Block diagram of the Pulse Wave Ultrasound Manometry (PWUM) method on a normal human aorta in vivo. A previously developed technique, Pulse Wave Imaging (PWI), provides local PWV measurements by tracking the estimated aortic wall displacement waveform, shown here in color overlaid onto consecutive B-Mode frames. The incremental distension waveform (pink) obtained at the central scan line (pink squares) was used along with the PWV to derive the pulse pressure waveform based on the Laplace law and the Modified Moens–Korteweg equation. (For interpretation of the references to colour in this figure legend, the reader is referred to the web version of this article.)
While PWUM has been tested in healthy, normotensive subjects,17 it has not yet been used to evaluate patients with elevated blood pressure. This study aims to evaluate the feasibility of a more complete assessment of PP variation throughout the arterial tree by performing direct measurement of PP at three arterial sites using three different instruments – a sphygmomanometer cuff for the left brachial artery, an applanation tonometer for the left radial artery, and PWUM for the infrarenal abdominal aorta.
Methods & study design
Study design
This study was approved by the Institutional Review Board (IRB) of Columbia University. Outpatients visiting the Dental Clinic at Columbia University Medical Center for routine dental exams were recruited. Patients who provided informed consent to participate in the study were instructed to lie in the supine position for the duration of the exam. Three brachial blood pressure measurements were performed on the left arm over a 15-minute period using a clinically recommended30 automatic digital blood pressure monitor (HEM-705CP, Omron Corp., Kyoto, Japan). The first measurement was excluded, and the average of the latter two was used to classify each subject as pre-hypertensive (systolic blood pressure between 120 mmHg and 139 mmHg) or hypertensive (systolic blood pressure >140 mmHg) based on the American Heart Association (AHA) recommendation for blood pressure categorization.31
Brachial PP was calculated as the difference between the systolic and diastolic pressures. Because blood pressure is known to fluctuate throughout the day,32 it was important to perform all measurements as concurrently as possible. In between each brachial cuff measurement, PWUM and radial applanation tonometry were performed to obtain the pulse pressure waveform in the aorta and left radial artery, respectively. Only the subjects who exhibited a clear, unobstructed acoustic window of an infrarenal abdominal aortic segment were included in this study. This resulted in N = 9 pre-hypertensive (5 M, 4 F, mean age 37.8 ± 8.4 y.o.) and N = 5 hypertensive (3 M, 2 F, mean age 54.2 ± 3.1 y.o.) subjects. N = 5 normal subjects (3 M, 2 F, mean age 27.2 ± 3.2 y.o.) were also recruited for comparison, yielding a total subject population of N = 19.
PWUM
The infrarenal abdominal aorta of each subject was scanned in the longitudinal (i.e. long-axis) view using a SonixTOUCH system (Analogic Corp., Peabody, MA, USA) and a 3.3 MHz curvilinear array transducer, as shown in Fig. 2. Because the pulse wave travels at a high velocity (∼4–12 m/s in human abdominal aortas19,20), a high frame rate was warranted to adequately track its propagation.33 The imaging depth was adjusted to the minimum depth so as to visualize both the anterior and posterior aortic walls, and the lateral resolution was reduced to between 19 and 25 scan lines over the field of view. This resulted in imaging depths of 7–12 cm and frame rates of 222–351 Hz, which corresponded to maximum measurable PWVs33 of ∼14.9–23.3 m/s. RF frames were acquired over 2-second intervals during which the subject was required to perform breath holding in order to minimize rigid motion. One additional RF frame was acquired at a high line density (180) to provide a reference frame for accurate manual segmentation of the aortic walls. All RF signals were digitized at a sampling frequency of 40 MHz, and 5–7 acquisitions were performed for each subject in order to average the measurements over multiple cardiac cycles.
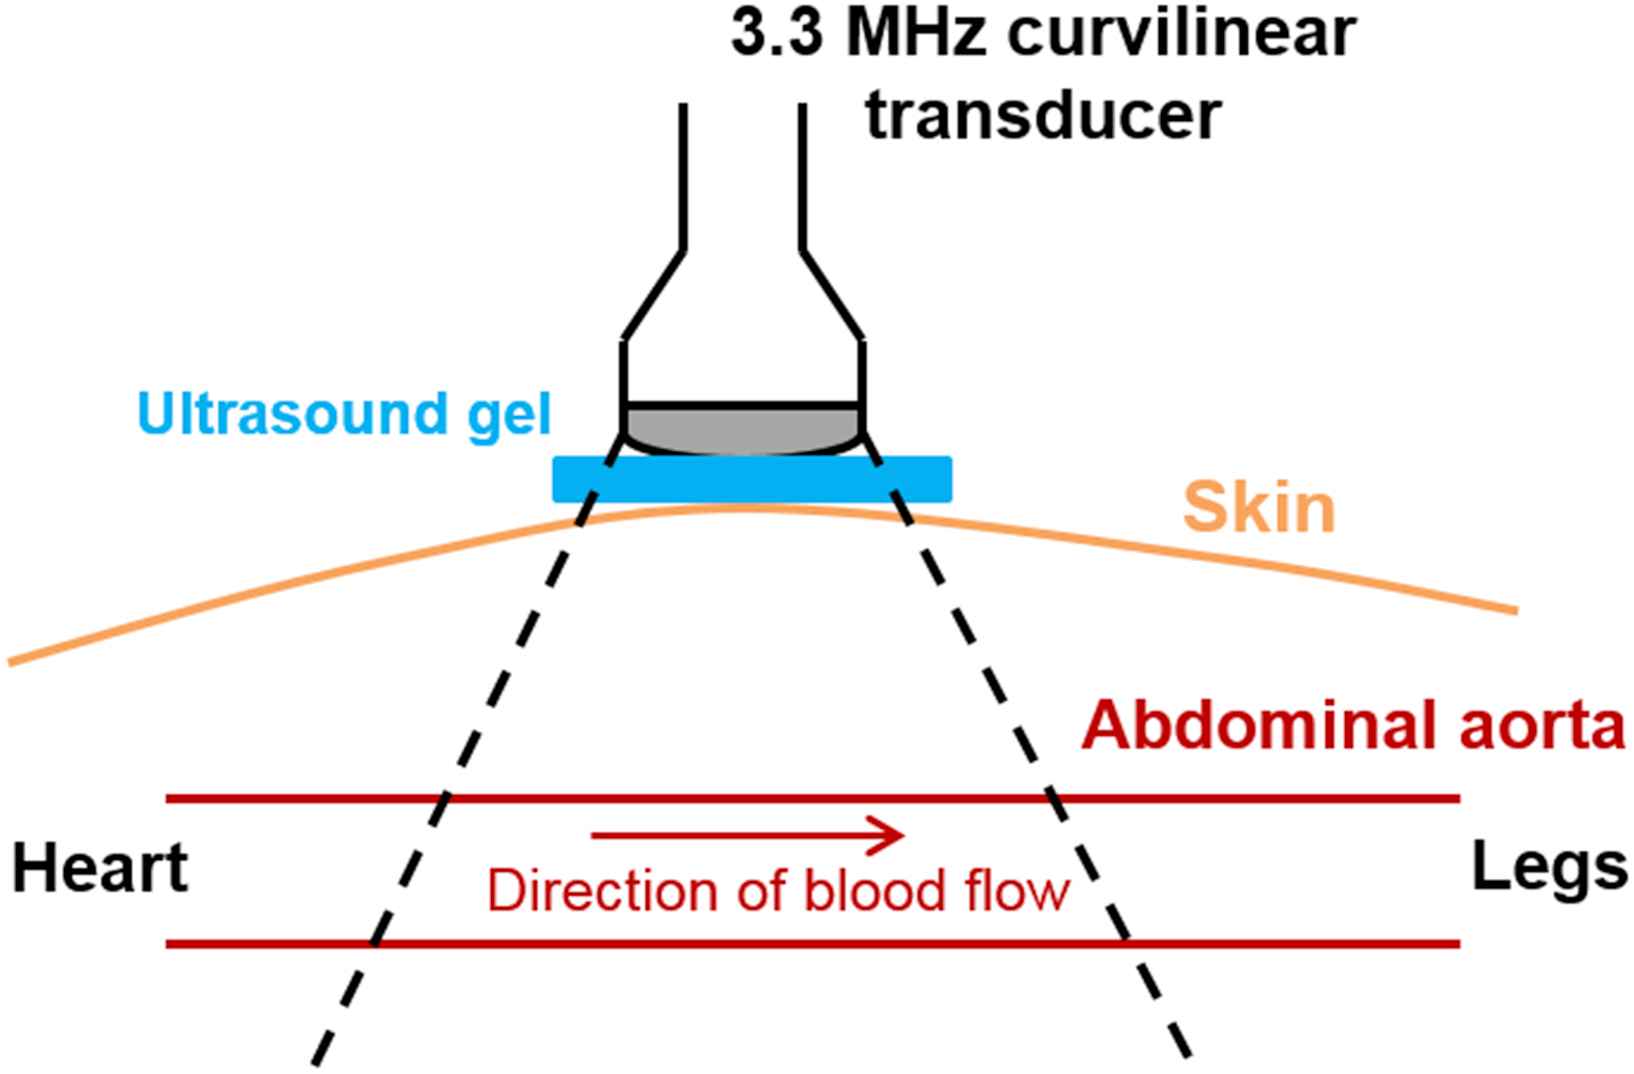
Schematic for in vivo data acquisition using PWUM. In order to minimize rigid motion, each subject was asked for perform breath-holding during each 2.5-second acquisition.
The incremental (i.e. inter-frame) axial displacements were estimated offline using a 1-D normalized cross correlation-based motion estimation method34 on the RF signals with a 1.5 mm window size and 95% overlap. Due to its close proximity to the spine, the posterior aortic wall exhibited minimal motion in vivo. Manual segmentation of the anterior wall was performed on the high line density reference frame, generating a wall trace that was mapped onto the first frame of the RF sequence and automatically updated based on the inter-frame displacements to track the wall throughout the sequence.35 The displacements at each point along the dynamic trace were mapped over time, generating a 2-D image depicting the spatio-temporal variation of the pulse wave propagation. Waveform tracking was performed by automatically identifying the 50% upstroke33 of each displacement waveform on the spatio-temporal map, and PWV was estimated via linear regression of the 50% upstroke markers. The incremental distension curve was obtained at the central scan line and inserted along with the PWV into the PWUM framework (Fig. 1) to arrive at the aortic PP waveform.
Radial applanation tonometry
An applanation tonometry system was assembled and calibrated for the purpose of this study by connecting a SPT-301 noninvasive pulse tonometer to the input channel of a PCU-2000 pressure control unit (Millar Instruments, Houston, TX, USA). The output channel of the control unit was connected to a USB digital I/O device (NI USB-6501, National Instruments Corp, Austin, TX, USA) for data acquisition. The I/O device was controlled by a MATLAB GUI (MathWorks, Natick, MA, USA) that displayed and saved the tonometer signal in real-time on the SonixTouch scanner. Once the pulse in the left radial artery was located by palpation, the tonometer was placed on the top of the artery to record 20 s of radial pressure waveforms.
For each subject, radial and aortic pulse pressures were calculated from the respective waveforms as the amplitude difference between the peak and the beginning of the upstroke (i.e. foot), and averaged over 5–10 cardiac cycles.
Statistical analysis
Due to unequal sample sizes, two-way ANOVA was performed using the Bonferroni method to evaluate statistical significance among the three subject groups.
Results
PWI yielded aortic PWV measurements of 5.00 ± 0.59 m/s, 7.37 ± 1.50 m/s, and 11.69 ± 2.72 m/s in the normotensive, pre-hypertensive, and hypertensive subject groups, respectively. Since PWV is a regional functional index of arterial stiffness over a certain arterial length,36 the significantly higher PWV of the hypertensive group (p < 0.01) suggests that the aortas of the hypertensive subjects were stiffer than those of the normotensive and pre-hypertensive subjects.
Figure 3 shows the radial and aortic pulse pressure waveforms over one full cardiac cycle for (a) a normal subject (F, 23 y.o., brachial BP 113/70) in which radial PP > aortic PP, (b) a pre-hypertensive subject (M, 51 y.o., brachial BP 136/87) in which radial PP ≈ aortic PP, and (c) a hypertensive subject (M, 60 y.o., brachial BP 153/91) in which radial PP ≈ aortic PP. Note the difference in the amplitude scale of the waveforms, which were manually aligned by the foot (i.e. beginning of the upstroke). In each case, the times corresponding to the peak of the forward wave, reflected wave, and dicrotic notch in the radial PP waveform are indicated by blue lines and labels.
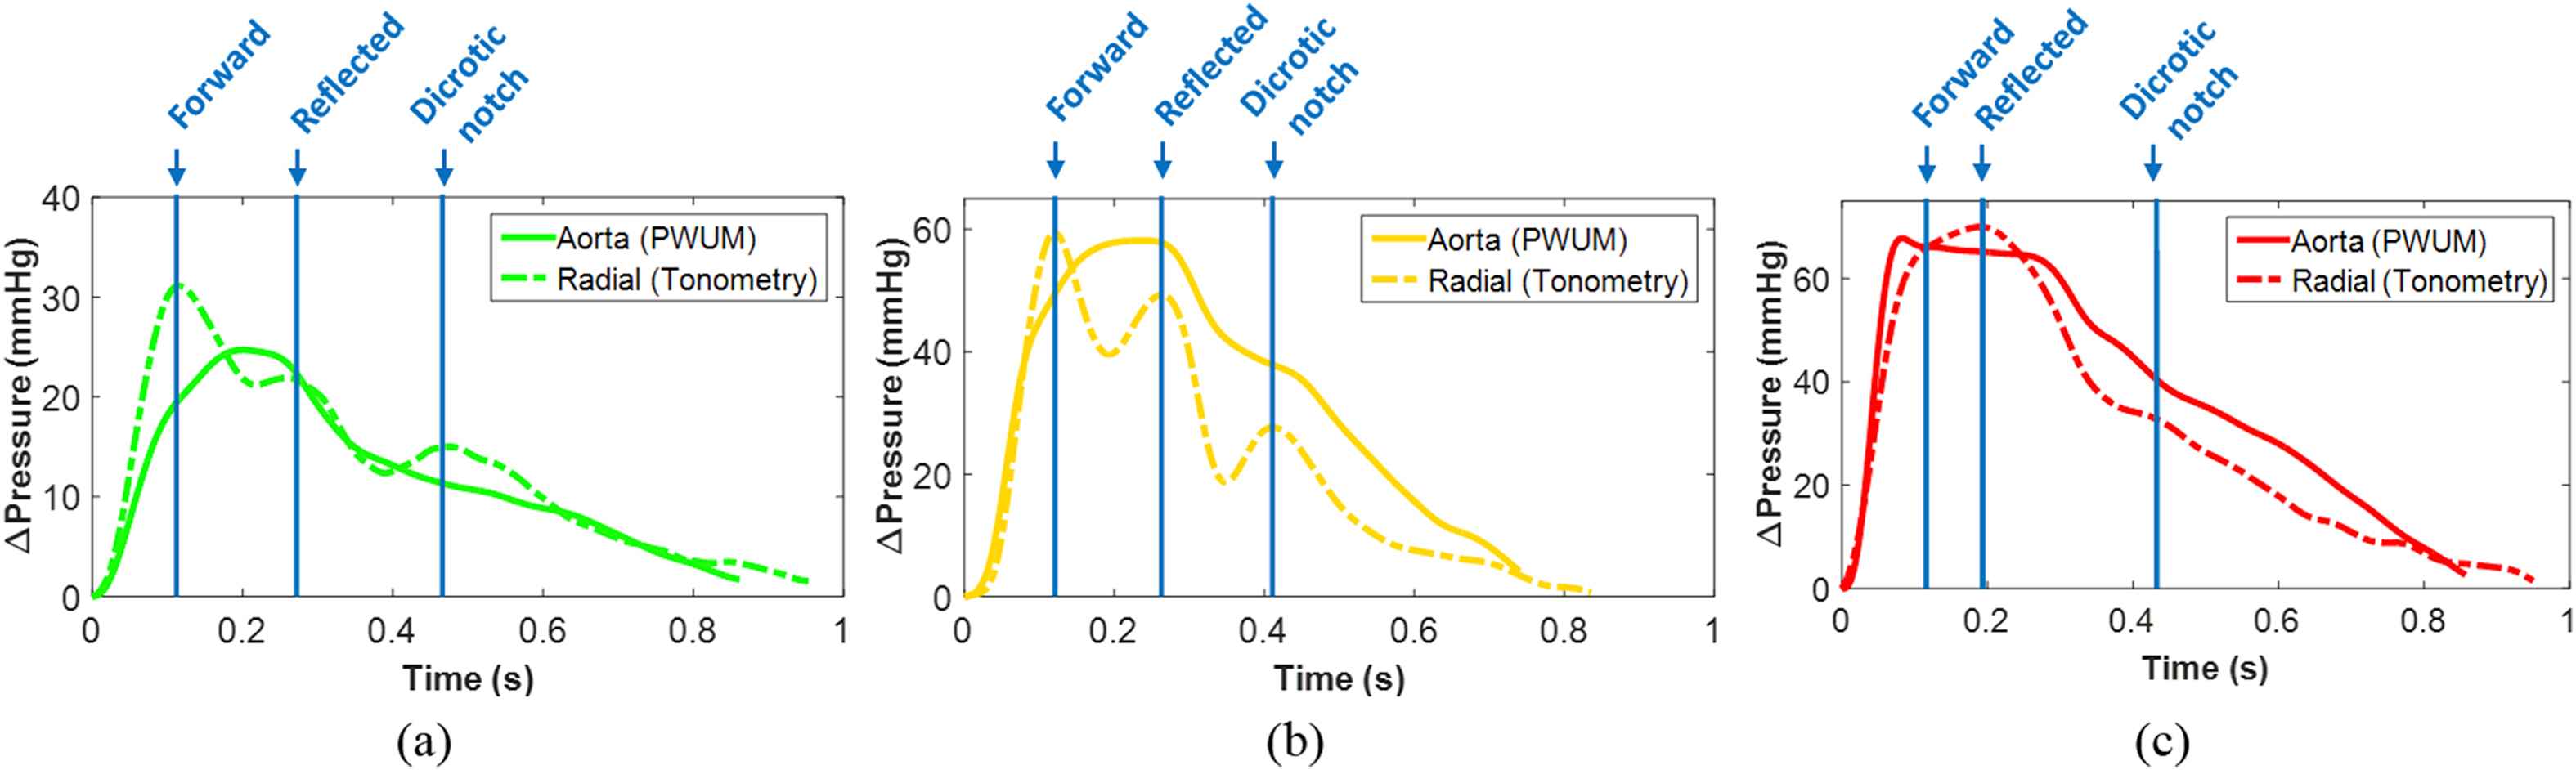
Representative radial and aortic pulse pressure waveforms, manually aligned by the foot of the wave, over a full cardiac cycle from (a) one normal subject (brachial BP 113/70), (b) one pre-hypertensive subject (brachial BP 136/87), and (c) one hypertensive subject (brachial BP 153/91). In each case, the times corresponding to the peak of the forward wave, reflected wave, and dicrotic notch in the radial PP waveform are indicated by blue lines and labels. (For interpretation of the references to colour in this figure legend, the reader is referred to the web version of this article.)
In the normal and pre-hypertensive cases, the peak of the radial forward wave correlates with an inflection point in the aortic waveform representing the beginning of the augmentation pressure, which is commonly observed in the aorta when the forward and reflected waves merge during late systole.37 By contrast, the greater separation between the forward and reflected peaks at the radial site indicates that the reflected wave merges with the forward wave during diastole. Also, the amplitude of the radial reflected wave is greater in the pre-hypertensive case compared to the normal case.
The radial waveform in the hypertensive case closely resembles the aortic waveform in the normal and pre-hypertensive cases – the peak of the forward wave appears as an inflection point rather than a relative maximum, suggesting that the higher velocity of the radial reflected wave in the hypertensive case has caused it to merge with the forward wave in late systole.38 In the aortic waveform, the inflection point corresponding to the radial forward peak is followed by a decrease in pressure rather than the increase seen in the normal and pre-hypertensive cases. This suggests that the reflected wave in the aorta of the hypertensive case may be merging with the forward wave in early diastole rather than late systole.37
The bar graphs in Fig. 4 show the blood pressure measurements (brachial systolic, brachial diastolic, brachial PP, aortic PP measured by PWUM, and radial PP measured by applanation tonometry) averaged across each of the three subject groups. For each of the five pressure measurements, statistical significance among the subject groups was determined using two-way ANOVA (*** denotes p < 0.001, ** denotes 0.001 < p < 0.01, and * denotes 0.01 < p < 0.05). Bonferroni’s multiple comparisons test revealed that a significantly higher PP in the hypertensive group was detected only at the aortic site by PWUM, whereas the radial and brachial PPs were not significantly different among the three subject groups.
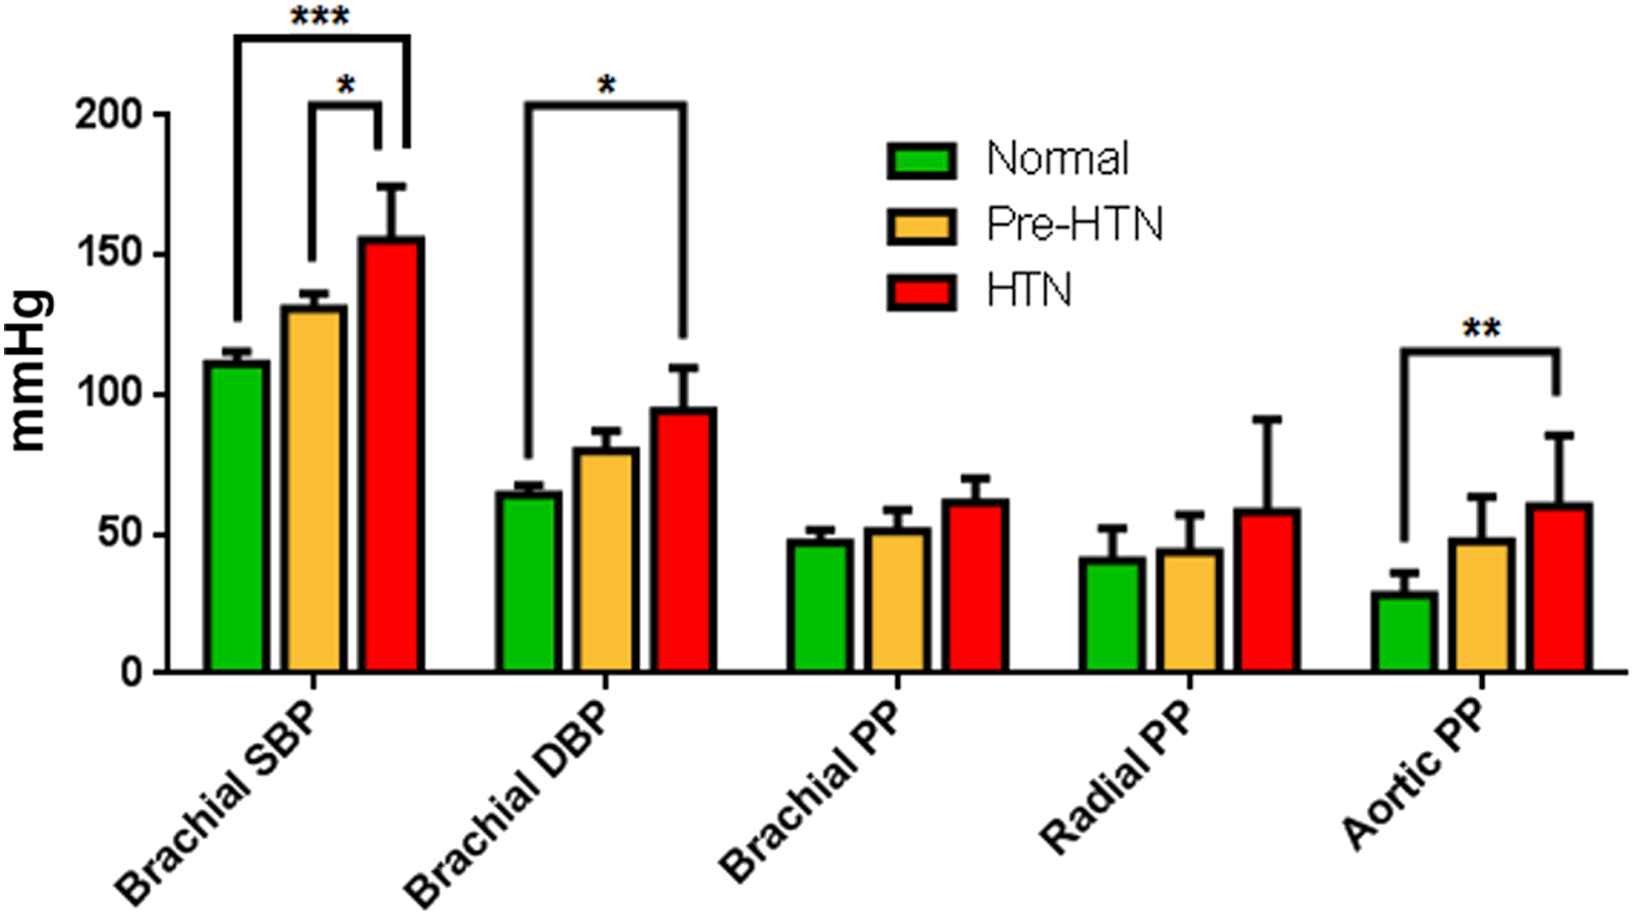
Summary of the average blood pressure measurements for each subject group (Pre-HTN = pre-hypertensive, HTN = hypertensive). For each of the five pressure measurements, statistical significances amongst the subject groups were determined using two-way ANOVA (*** denotes p < 0.001, ** denotes 0.001 < p < 0.01, and * denotes 0.01 < p < 0.05).
The aortic PP vs. (a) radial and (b) brachial PP for all subjects is shown in Fig. 5. While no strong correlation was observed in normal and pre-hypertensive subjects, there was a relatively strong positive correlation between aortic PP and both radial and brachial PP in hypertensive subjects (r2 = 0.68 and 0.86, respectively).
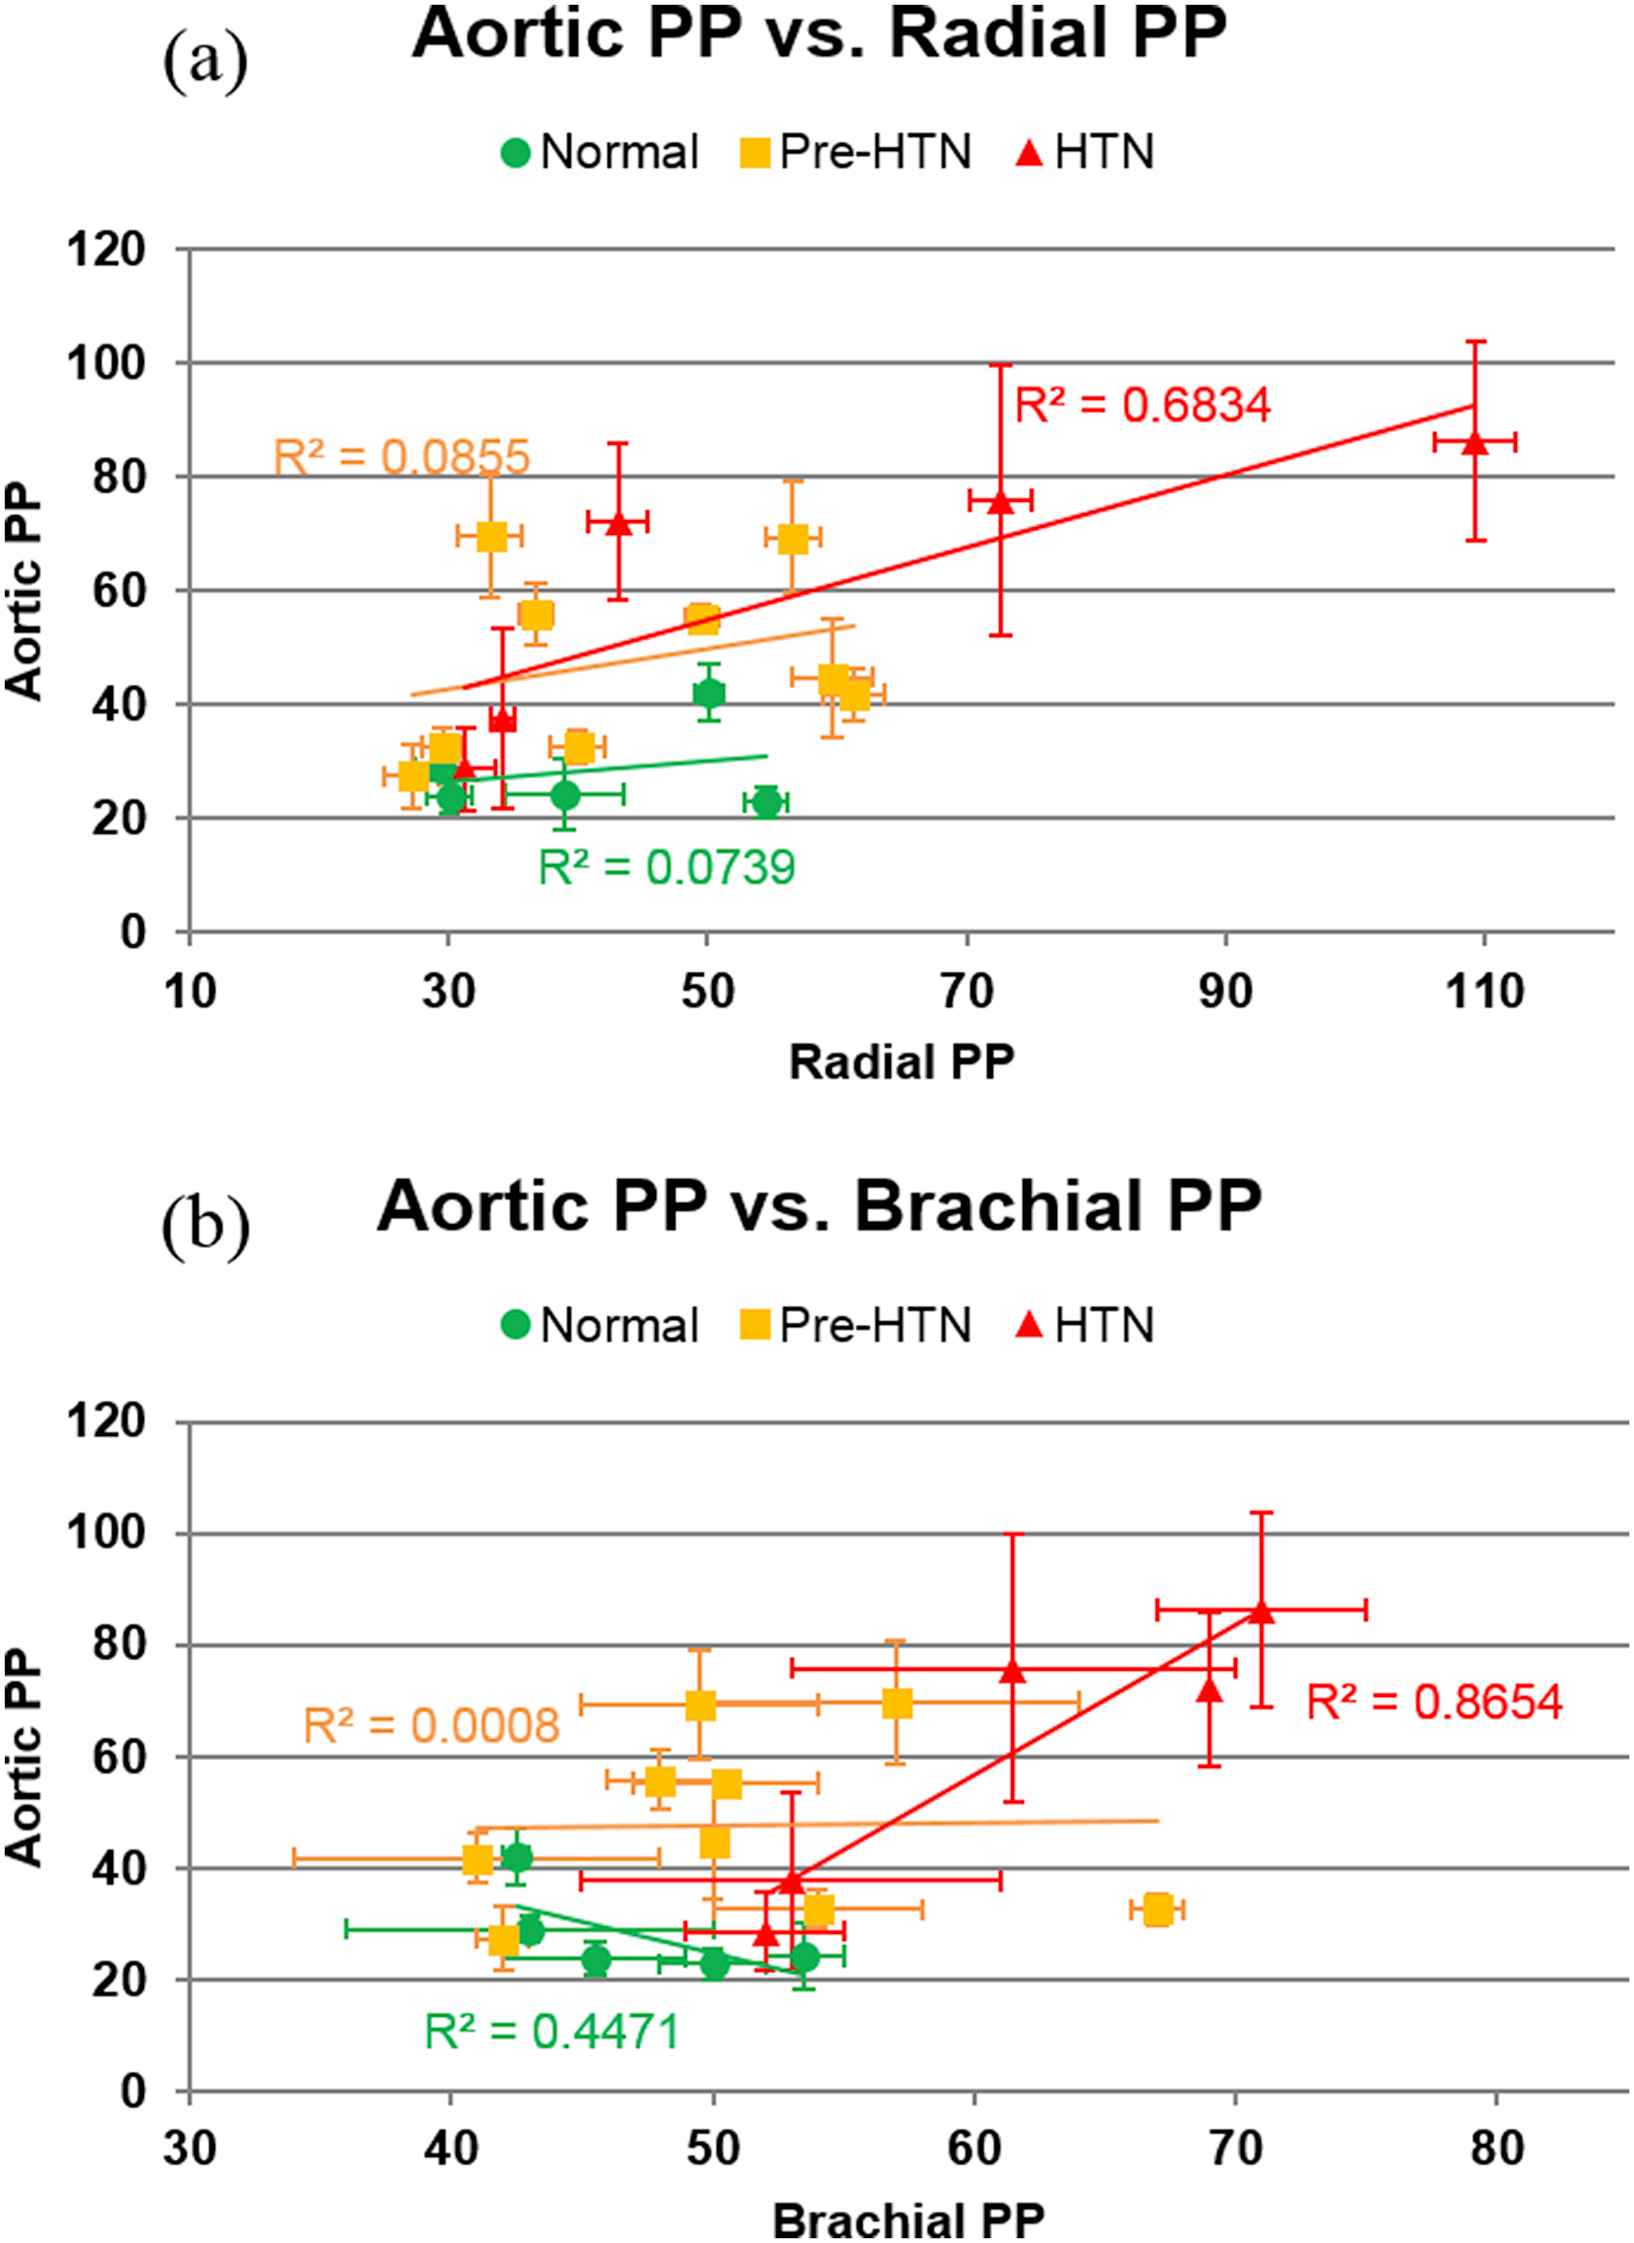
Aortic PP vs. (a) radial and (b) brachial PP for all subjects. In both plots, linear regression was performed on the data within each subject group. The greatest correlation between aortic PP and radial/brachial PP was observed in the hypertensive group.
Discussion
In this study, the aortic PP measured by PWUM was compared to the peripheral PPs measured using radial applanation tonometry and brachial cuff sphygmomanometry. It is important to note that due to the small sample sizes present in this study, the objective was not to establish definitive relationships in PP among different subject groups, but rather to evaluate the feasibility of noninvasively obtaining direct measurements of PP at different arterial locations. The authors acknowledge that larger sample sizes may affect the results of this study.
Due to the lack of ground-truth PPs, the measurements were compared relative to each other using correlations. Significantly higher (p < 0.01) PP in hypertensive subjects was detected at the aorta by PWUM but not in the case of the brachial and radial arteries (Fig. 4). This suggests that changes in overall blood pressure may occur in the central arteries before they are apparent at peripheral sites,7,39 further stressing the importance of routine CBP evaluation.
While the subjects represented three distinct blood pressure levels, they also represented three distinct age groups. The pre-hypertensives were significantly older (p < 0.05) than the normals, and the hypertensives were significantly older (p < 0.01) than the pre-hypertensives. Thus, the effects of aging are also reflected in the PP variations at the three arterial sites. The metabolic and biochemical factors behind age-dependent arterial stiffening are well established.40 Stiffening of the central arteries will result in changes in both the wave reflection patterns and arrival times of the reflected waves at the measurement site.41 This can be either burdensome, if the reflected wave adds to the main systolic pressure peak, or beneficial, if the reflected wave arrives at late systole or early diastole.42 If the reflected wave does not augment the main systolic pressure peak, an increase in PP will not be observed, which tends to be the case in younger, more elastic arteries exhibiting lower PWV and hence lower reflection amplitudes.41 This phenomenon is evident from the results within the pre-hypertensive group in this study – the four subjects who exhibited aortic PP > 50 mmHg were significantly older (42.0 ± 5.7 y.o.) than the five subjects with aortic PP < 50 mmHg (33.4 ± 6.9 y.o.).
Figure 3 depicts the non-uniformity of the PP waveform at different arterial sites. The arrival of the reflected wave caused an amplification of the PP in the normal and pre-hypertensive aortas (Fig. 3a and b, respectively) as well as in the hypertensive radial artery (Fig. 3c), but not in the hypertensive aorta. This appears to contradict the notion that in older, hypertensive individuals, the reflected wave tends to arrive at the ascending aorta during early systole, resulting in an even greater increase in PP.37,43 However, the aforementioned studies have investigated central PP using either a generalized transfer function to derive the PP at the ascending aorta,44,45 or cardiac catheterization at the aortic root.46 Since this study represents the first non-invasive, direct measurements of PP in the abdominal aortas of pre-hypertensive and hypertensive subjects, it is possible that in some hypertensive cases (such as the one shown in Fig. 3c), the arrival of the reflected wave at the abdominal aorta may not always cause pressure amplification.
In the normal and pre-hypertensive groups, no strong correlation (r2 < 0.45) was observed between the aortic and peripheral PPs, while in the hypertensive group, a relatively strong correlation was observed between aortic PP and both peripheral PPs (r2 = 0.68 for the radial, r2 = 0.87 for the brachial). A combination of prolonged peripheral hypertension and age-related arterial stiffening may have resulted in the positive relationship between radial, brachial, and aortic PP in the hypertensive group. However, it is worth noting that two of the hypertensive subjects exhibited PPs within the normal and pre-hypertensive range at all three arterial sites despite exhibiting systolic brachial pressures >140 mmHg. This is attributed to the increased diastolic brachial pressure in these subjects, which can serve as its own cardiovascular risk factor.15 The lack of correlation between aortic and peripheral PPs in the normal and pre-hypertensive groups indicates that PP elevation throughout the arterial tree may not be uniform in relatively compliant arteries.
From a physiological perspective, the mechanical integrity of the aortic wall is mainly determined by its matrix constituents, namely elastin, collagen, and smooth muscle.26,27 Elastin is highly distensible and load-bearing at low pressures, while collagen is 1000 times stiffer and load-bearing at high pressures.26 As the PP rises, the increased intraluminal pressure exerts a greater force on the wall, engaging more collagen fibers and causing a reduction in arterial compliance. However, the arterial compliance is also dependent on the vessel size, which may explain the non-uniformity of PP measurements at the three different sites investigated in this study.
PWUM relies on fundamental physical assumptions that are inherent to the validity of the Laplace law and the Moens–Korteweg equation used in this study. These assumptions include a cylindrical geometry and the linear elasticity of the arterial wall. The linear elasticity assumption denotes that the distension and pressure waveforms have temporal variations that are in-phase. This is a commonly accepted hypothesis47 relying on the fact that the nonlinear behavior of the arterial wall in vitro starts to prevail at higher deformation than the physiological one.48 However, it is unclear how well this translates to human arteries in vivo, as the nonlinear behavior of the arterial wall may infer to a more complex relationship between distension and pressure.49,50
Conclusion
PWUM is a technique that can be used to measure the PP in any artery accessible by ultrasound (e.g. carotid, brachial, etc.). We have selected the abdominal aorta for all PWUM studies to date due to its clinical significance and the fact that it is impossible to directly access with other noninvasive methods such as brachial sphymomanometry or applanation tonometry. Future studies are aimed at applying the PWUM method at other imaging sites such as the carotid and brachial arteries.
Conflict of interest statement
The authors certify that they have no affiliations with or involvement in any organization or entity with any financial interest, or non-financial interest in the subject matter or materials discussed in this manuscript.
Acknowledgments
This work was supported in part by
References
Cite this article
TY  - JOUR
AU  - Ronny X. Li
AU  - Ada Ip
AU  - Elena Sanz-Miralles
AU  - Elisa E. Konofagou
PY  - 2017
DA  - 2017/03/10
TI  - Noninvasive evaluation of varying pulse pressures in vivo using brachial sphymomanometry, applanation tonometry, and Pulse Wave Ultrasound Manometry
JO  - Artery Research
SP  - 22
EP  - 28
VL  - 18
IS  - C
SN  - 1876-4401
UR  - https://doi.org/10.1016/j.artres.2017.02.002
DO  - 10.1016/j.artres.2017.02.002
ID  - Li2017
ER  -