
Application of arterial hemodynamics to clinical practice: A testament to medical science in London
- DOI
- 10.1016/j.artres.2017.03.003How to use a DOI?
- Keywords
- Wave reflection; Pulse wave velocity; Arterial pulse; Impedance
- Abstract
A strong heritage of science has been handed down in Britain from outstanding individuals, promoted and encouraged by strong scientific and medical societies. Application to clinical practice in recent years has been slow but can be expected to advance in the present and future age of new sensors, fast computing and clinical problems awaiting explanation. Agreement on terminology and physical mechanisms needs be fostered.
- Copyright
- © 2017 Association for Research into Arterial Structure and Physiology. Published by Elsevier B.V. All rights reserved.
- Open Access
- This is an open access article distributed under the CC BY-NC license.
Britain has contributed more than any other nation to the theory and application of arterial hemodynamics. Within England, no city has spawned more ideas in this domain than London, home to University College and this meeting. Isaac Newton was the pioneer. His Principa Mathematica established the principles of physics through quantification of information, and observations, using appropriate mathematical analysis. While Newton’s main establishment was at Cambridge, he spent much time in London at meetings of the Royal Society, and in his later life, as Warden of the Mint.1,2
William Harvey in 1628 wrote his famous tome “Exercitatio Anatomica de Motu Cordis et Sanguinis in Animalibus” while Anatomist to the Royal College of Physicians of London.3 His establishment of the circulation was contentious and generated widespread controversy. One subject he championed was wave reflection, not in “de Motu Cordis ...”, but more fully in later work, principally his Second Open Letter to Jean Riolan.4 He was well aware of wave travel and reflection, but could not confirm whether the pressure wave travelled within the lumen of an artery or along its wall. He described experiments where an artery was occluded with an intraluminal reed. It was left to his followers to confirm that velocity of the arterial pressure wave depended both on the properties of the wall and viscosity of the blood within. But he was emphatic about the importance of wave reflection.
“For, so soon as you have tied the artery above the reed or tube with a string, the vessel in question promptly dilates heartwards from the end of the reed under the impact of the blood from above. In consequence, the (forward) flow of blood is impeded and its impact is reflected backwards.”
Harvey’s views were put into practice in London by John Hunter,5 considered to be the pioneer of scientific surgery. His famous operation for popliteal aneurysm was successful not only as he tied off the femoral artery proximal to the aneurysm, but because he applied further ligatures proximally to protect the repaired artery. He reasoned that waves travelling from the heart to the leg could be reflected backwards to the heart, so damping the wave which reached the aneurysm site, and allowing the aneurysm to heal.
Stephen Hales6 first measured arterial pressure from the height of a blood column in a tube that was connected to the crural artery of a horse. By measuring pressure in very small arteries, he showed that high pressure was maintained, deducing that the principal reduction in pressure occurred in small peripheral arteries, opening the way for Poiseuille to confirm that resistance to blood flow is principally peripheral. Hales, an Anglican clergyman, had a parish in North London.
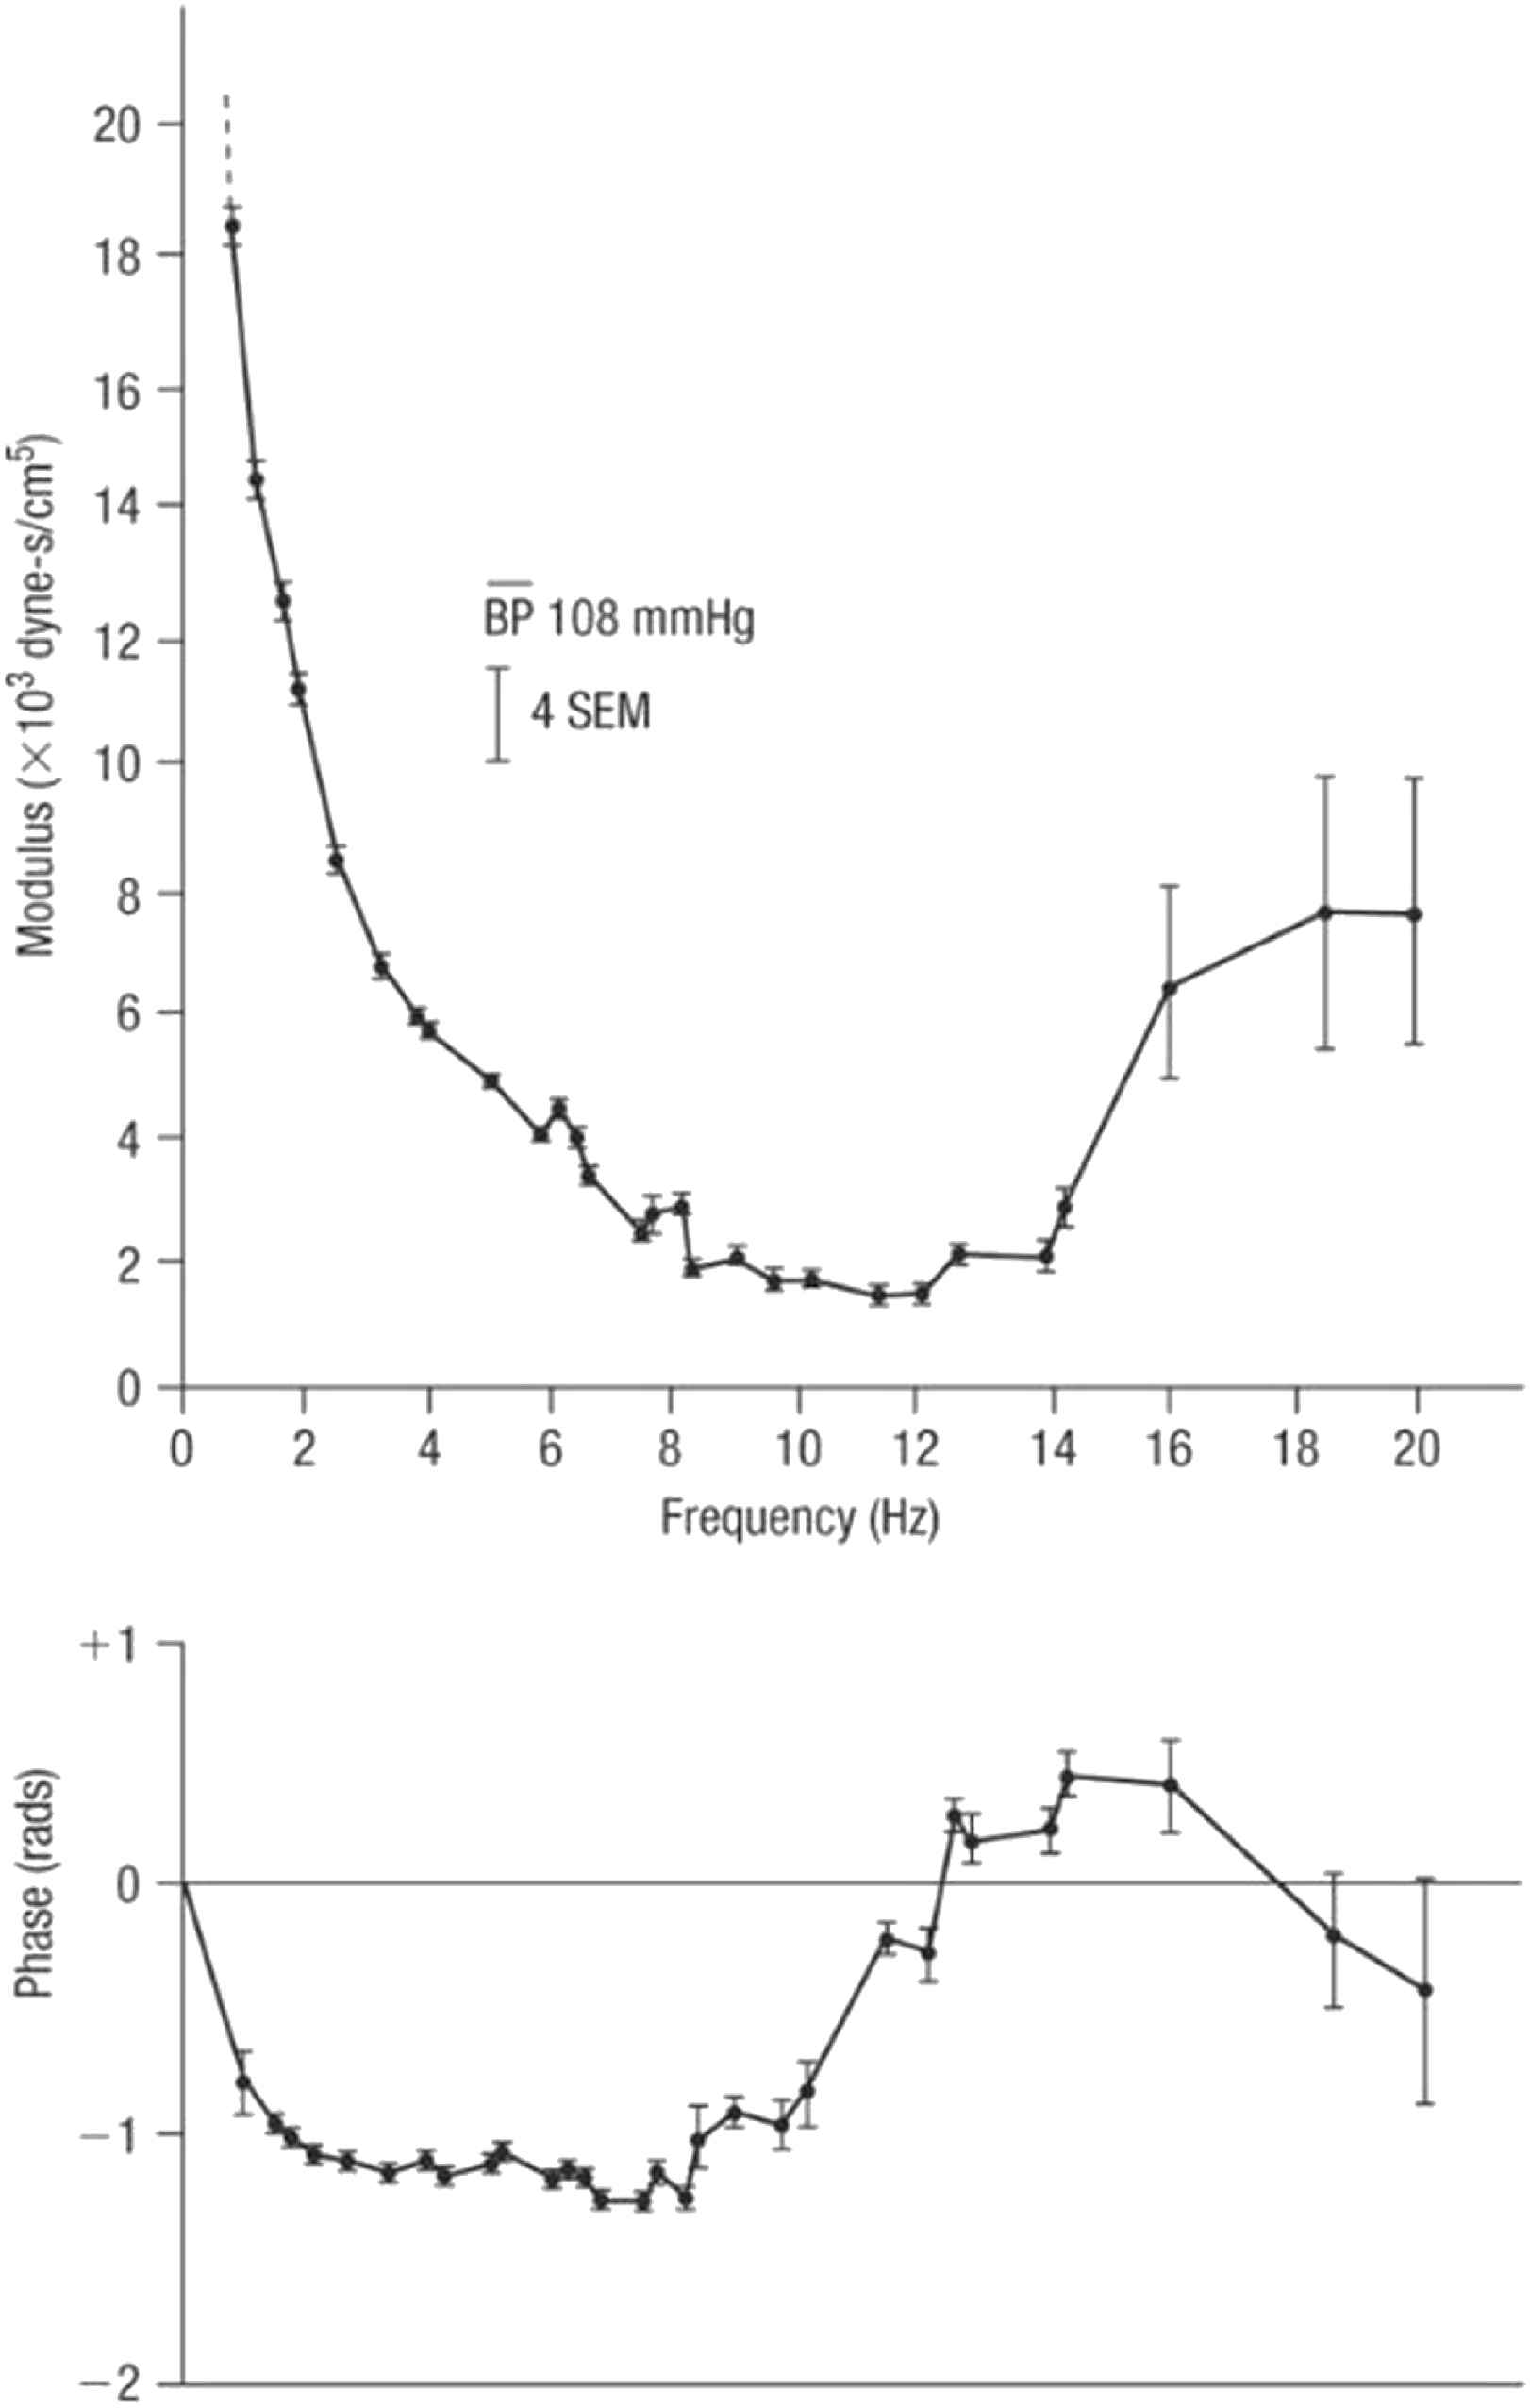
William Bright7 established the relationship between renal disease, stroke and cardiac failure via elevation of arterial pressure and quantified this from palpation of the pulse. From this early work at Guy’s Hospital followed the careful clinical/pathological work of Gull and Sutton8 then of Frederick Mahomed9 who developed his own quantitative sphygmogram as an improvement of Marey’s in Paris.10 It was Mahomed who confirmed Marey’s observations that the characteristic feature of ageing disease (arteriosclerosis) and of hypertension was prominence of the tidal wave at the radial artery – of the late systolic peak of radial artery pressure – which is now described paradoxically by some of our colleagues as a “reservoir wave”. Mahomed described characteristic features of the radial pulse wave in hypertension (Fig. 1) as:
“The dicrotic wave is very small and often scarcely perceptible; the vessels, however, are full during the diastolic period, and collapse slowly. ... The tidal wave is prolonged and too much sustained. . . . The most constant of these indications is the prolongation of the tidal wave; any one or all of the other characters may under certain conditions be absent.”

Characteristic features of radial pulse wave in a normal (top) and a hypertensive (bottom) person.
He also declared that elevated blood pressure, and its adverse clinical course could be diagnosed from contour of the radial artery pulse.
“These persons appear to pass on through life pretty much as others do and generally do not suffer from their high blood pressures, except in their petty ailments upon which it imprints itself . . . As age advances the enemy gains accession of strength . . . the individual has now passed forty years, perhaps fifty years of age, his lungs begin to degenerate, he has a cough in the winter time, but by his pulse you will know him . . . Alternatively headache, vertigo, epistaxis, a passing paralysis, a more severe apopleptic seizure, and then the final blow.”
Sir William Broadbent, Chief Censor of the RCP of London took great interest in the Sphygmograph of Mahomed and wrote a book on the arterial pulse in 1890.11 Sir William did not employ the sphygmograph in his routine clinical practice but stressed the need for a clinician to cultivate understanding of graphic waveforms so that he could interpret what he was feeling at the wrist. Sir James Mackenzie moved to London from the north, and wrote his book on the Arterial Pulse using a Dudgeon sphygmograph (Fig. 2), and stressed the use of this instrument in clinical practice.12 He differed from Broadbent in using the sphygmograph widely in his clinical practice, and pressed the importance of graphic records even at the bedside. Sir James Mackenzie was an early adopter of Riva-Rocci’s sphygmograph and designed his own “polygraph,” that simultaneously defined and aligned arterial and venous pulse images. He founded the Mackenzie Institute of Clinical Research in St Andrews and perhaps because he suffered from angina pectoris or simply by virtue of his keen mind, revolutionized the study of coronary artery disease that was to take his own life. His work in the UK and London led to his general regard as the founder of Cardiology in the English speaking world.

Dudgeon sphygmograph.
The ravages of wars slowed cardiovascular clinical research in London. Crighton Bramwell and A V Hill, Nobel Laureate, worked together on arterial stiffening and cardiac function through measurement of pulse wave velocity.13 The major event in this field was probably that collaboration created between John Womersley14 and Donald McDonald on the value of frequency domain analysis of the arterial pulse15 at St Bartholomew’s Hospital, then Michael Taylor’s application with McDonald of the approach beyond an arterial segment to the whole systemic circulation.16 Colin Caro at Imperial College is the sole survivor of this group from St Bartholomew’s.17
Advances in arterial hemodynamics in London have been pursued by many groups, but have been pressed from the earliest times by the Royal Society, the Royal Society of Medicine, the Royal College of Physicians of London, and the Physiological Society. Donald McDonald was invited to write his book “Blood Flow in Arteries” as a monograph for the Physiological Society in 1960.18
Basic issues of arterial hemodynamics have been discussed in the past editions of McDonald’s Blood Flow in Arteries and continue in the seventh issue of “McDonald” written by authors of this paper. The first edition18 was written in London at St. Bartholomew’s Hospital and published by Edward Arnold as a monograph of the Physiological Society (H. Barcroft, A. Hodgkin, W. Paton). Concepts presented in the first (1960) to sixth (2011 golden anniversary) editions19 were strongly based on past history of the subject and the application of scientific theory and practice to the arterial system in a quantitative way. Application to clinical practice followed in subsequent editions. The city of London has been the epicentre of work in this area throughout Great Britain over a period of 500 years, and continues at this meeting. We meet on hallowed ground.
Over the past 80 years, little has changed in the fundamental issue of wave travel, wave reflection, and vascular impedance. However, over this time there has been increasing interaction between engineering and medical science – with respect to mechanical and electrical devices, monitoring systems and analytic systems. The arterial pulse waveform (as a photo plethysmograph) can be recorded as an “App”’ for a mobile phone and subject to various analyses. Photoplethysmograms are now used routinely to confirm beating of the heart and oxygenation of blood in operating suites, recovery wards and emergency departments, and are being substituted for the cuff sphygmomanometer and ECG as routine monitoring tools.20
Clinicians have not kept pace with these new engineering developments and application of concepts, particularly as they relate to hemodynamics. An example is the view of Aortic Impedance by clinicians as a diffuse concept (Fig. 3) whereas, it is the most appropriate way for engineers to analyse phenomena which are repeated regularly – like musical notes, vibrations, and pulse waveforms. The concept provides mathematical precision and the possibility of describing pressure and flow waveforms, their relationship, and their subsequent analysis, to quantify the magnitude and timing of wave reflection in a vascular bed from flow and pressure waves recorded at its input.21
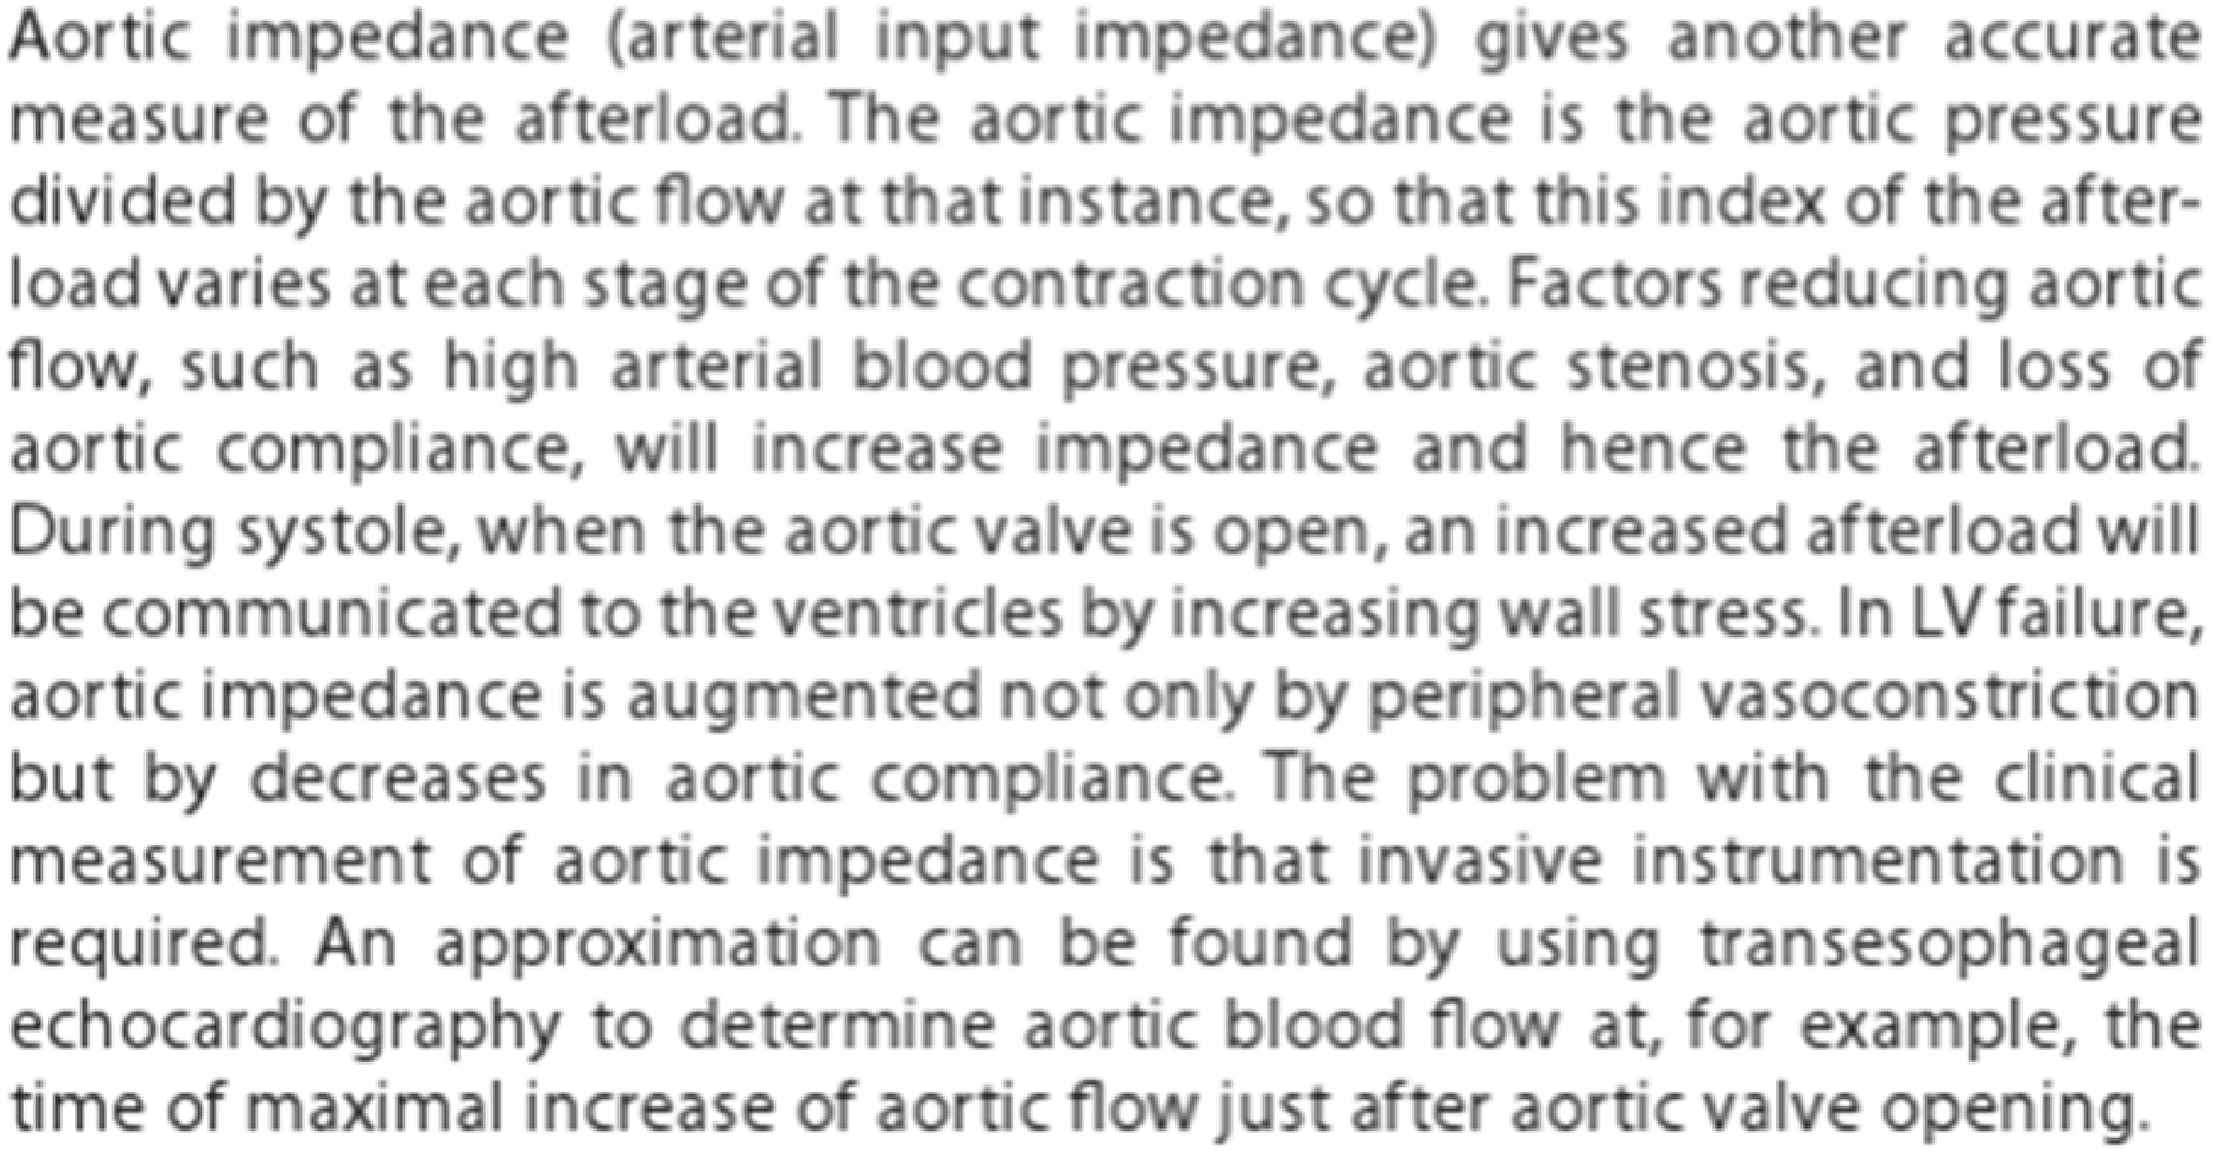
Definition of aortic impedance as printed in Braunwald’s Heart Disease, 9th ed. From Ref. 27.
This meeting in June 2016, is held at University College London to discuss contentious issues in translating the views of McDonald and his colleagues Michael Taylor and John Womersley and was organised by Patrick Segers from Ghent University and Alun Hughes from University College, London with keynote contributions from Michael O’Rourke, Nico Westerhof from the Free University Amsterdam and Kim Parker from Imperial College, London.
Michael O’Rourke, a protégé of Michael Taylor, was the first speaker and introduced the subject of pulse waveform analysis and the conventional approach to this as set out in the McDonald book,18 and which will be basically unchanged in the forthcoming 7th edition. Later presentations consider concepts of Forward and Backward waves and methods of Wave Separation, Wave Intensity Analysis, Wave Free Period in Diastole, Reservoir Wave approach, Reservoir Pressure, and Windkessel models of the arterial tree. Nico Westerhof of Amsterdam while critical of many of the above, championed the 2nd and 3rd component Windkessel as the best model to represent the pressure waveforms measured in most normal healthy human subjects.
O’Rourke as a clinician with a background in arterial hemodynamics from physiology departments in Sydney and Baltimore, urged a simplified, holistic explanation of arterial dynamics which could be applicable to all clinical situations, and based on the understanding of arterial waves as described from Harvey down to the present and could embrace their applications in modern medical and surgical practice.
O’Rourke pointed out how simple explanations could be given for the contour of ascending aortic pressure waves in animals and humans, as showing a prominent reflected wave in cardiac diastole under normal conditions, with the pattern of a Windkessel model when aortic pulse wave velocity was increased, or when ejection duration increased during bradycardia through infusion of adrenaline. Prominent reflected waves disappear when acetylcholine is infused to create arterial or arteriolar vasodilation (Fig. 4). These changes are seen in clinical practice, particularly when the waveforms are monitored in intensive care wards. Changes can be seen in a sequence of wave tracings when vasoconstrictor or vasodilator drugs are given, when heart rate or blood pressure rises or falls, and sometimes seen easily in sequential pulse waveforms in patients with atrial fibrillation or multiple extra asystoles.
Contour of ascending aortic pressure waves in a rabbit, as showing a prominent reflected wave in cardiac diastole under normal conditions (centre), with the pattern of a Windkessel model when aortic pulse wave velocity was increased (right), or when vasodilation and hypotension were caused by intravenous injection of acetylcholine (left). From Ref. 5, redrawn by O’Rourke.
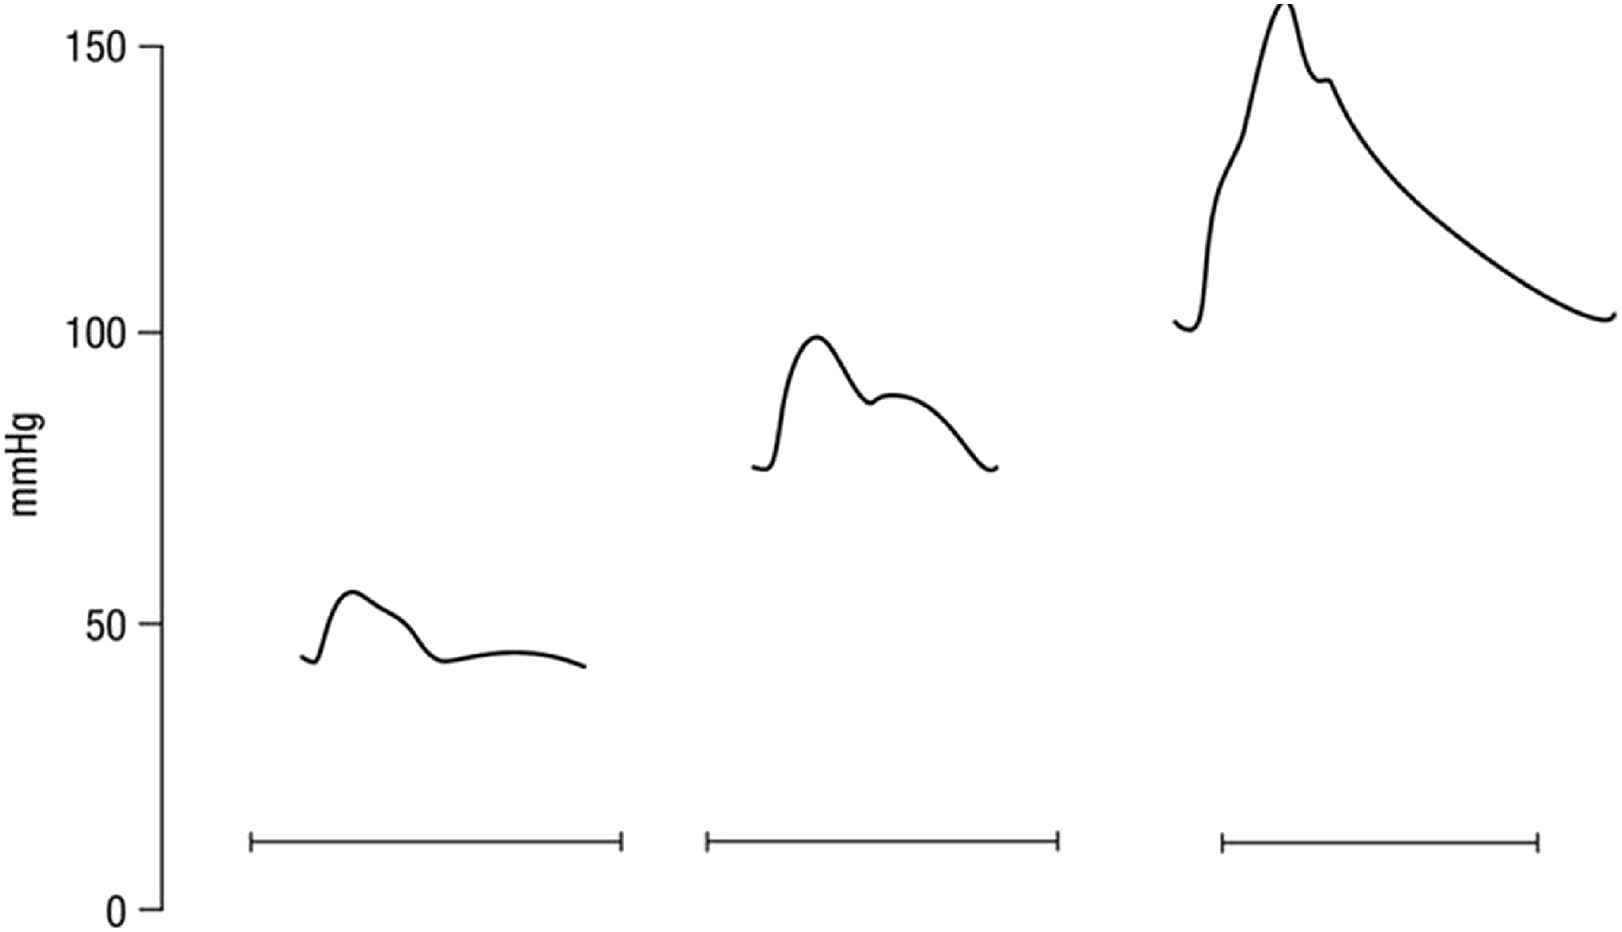
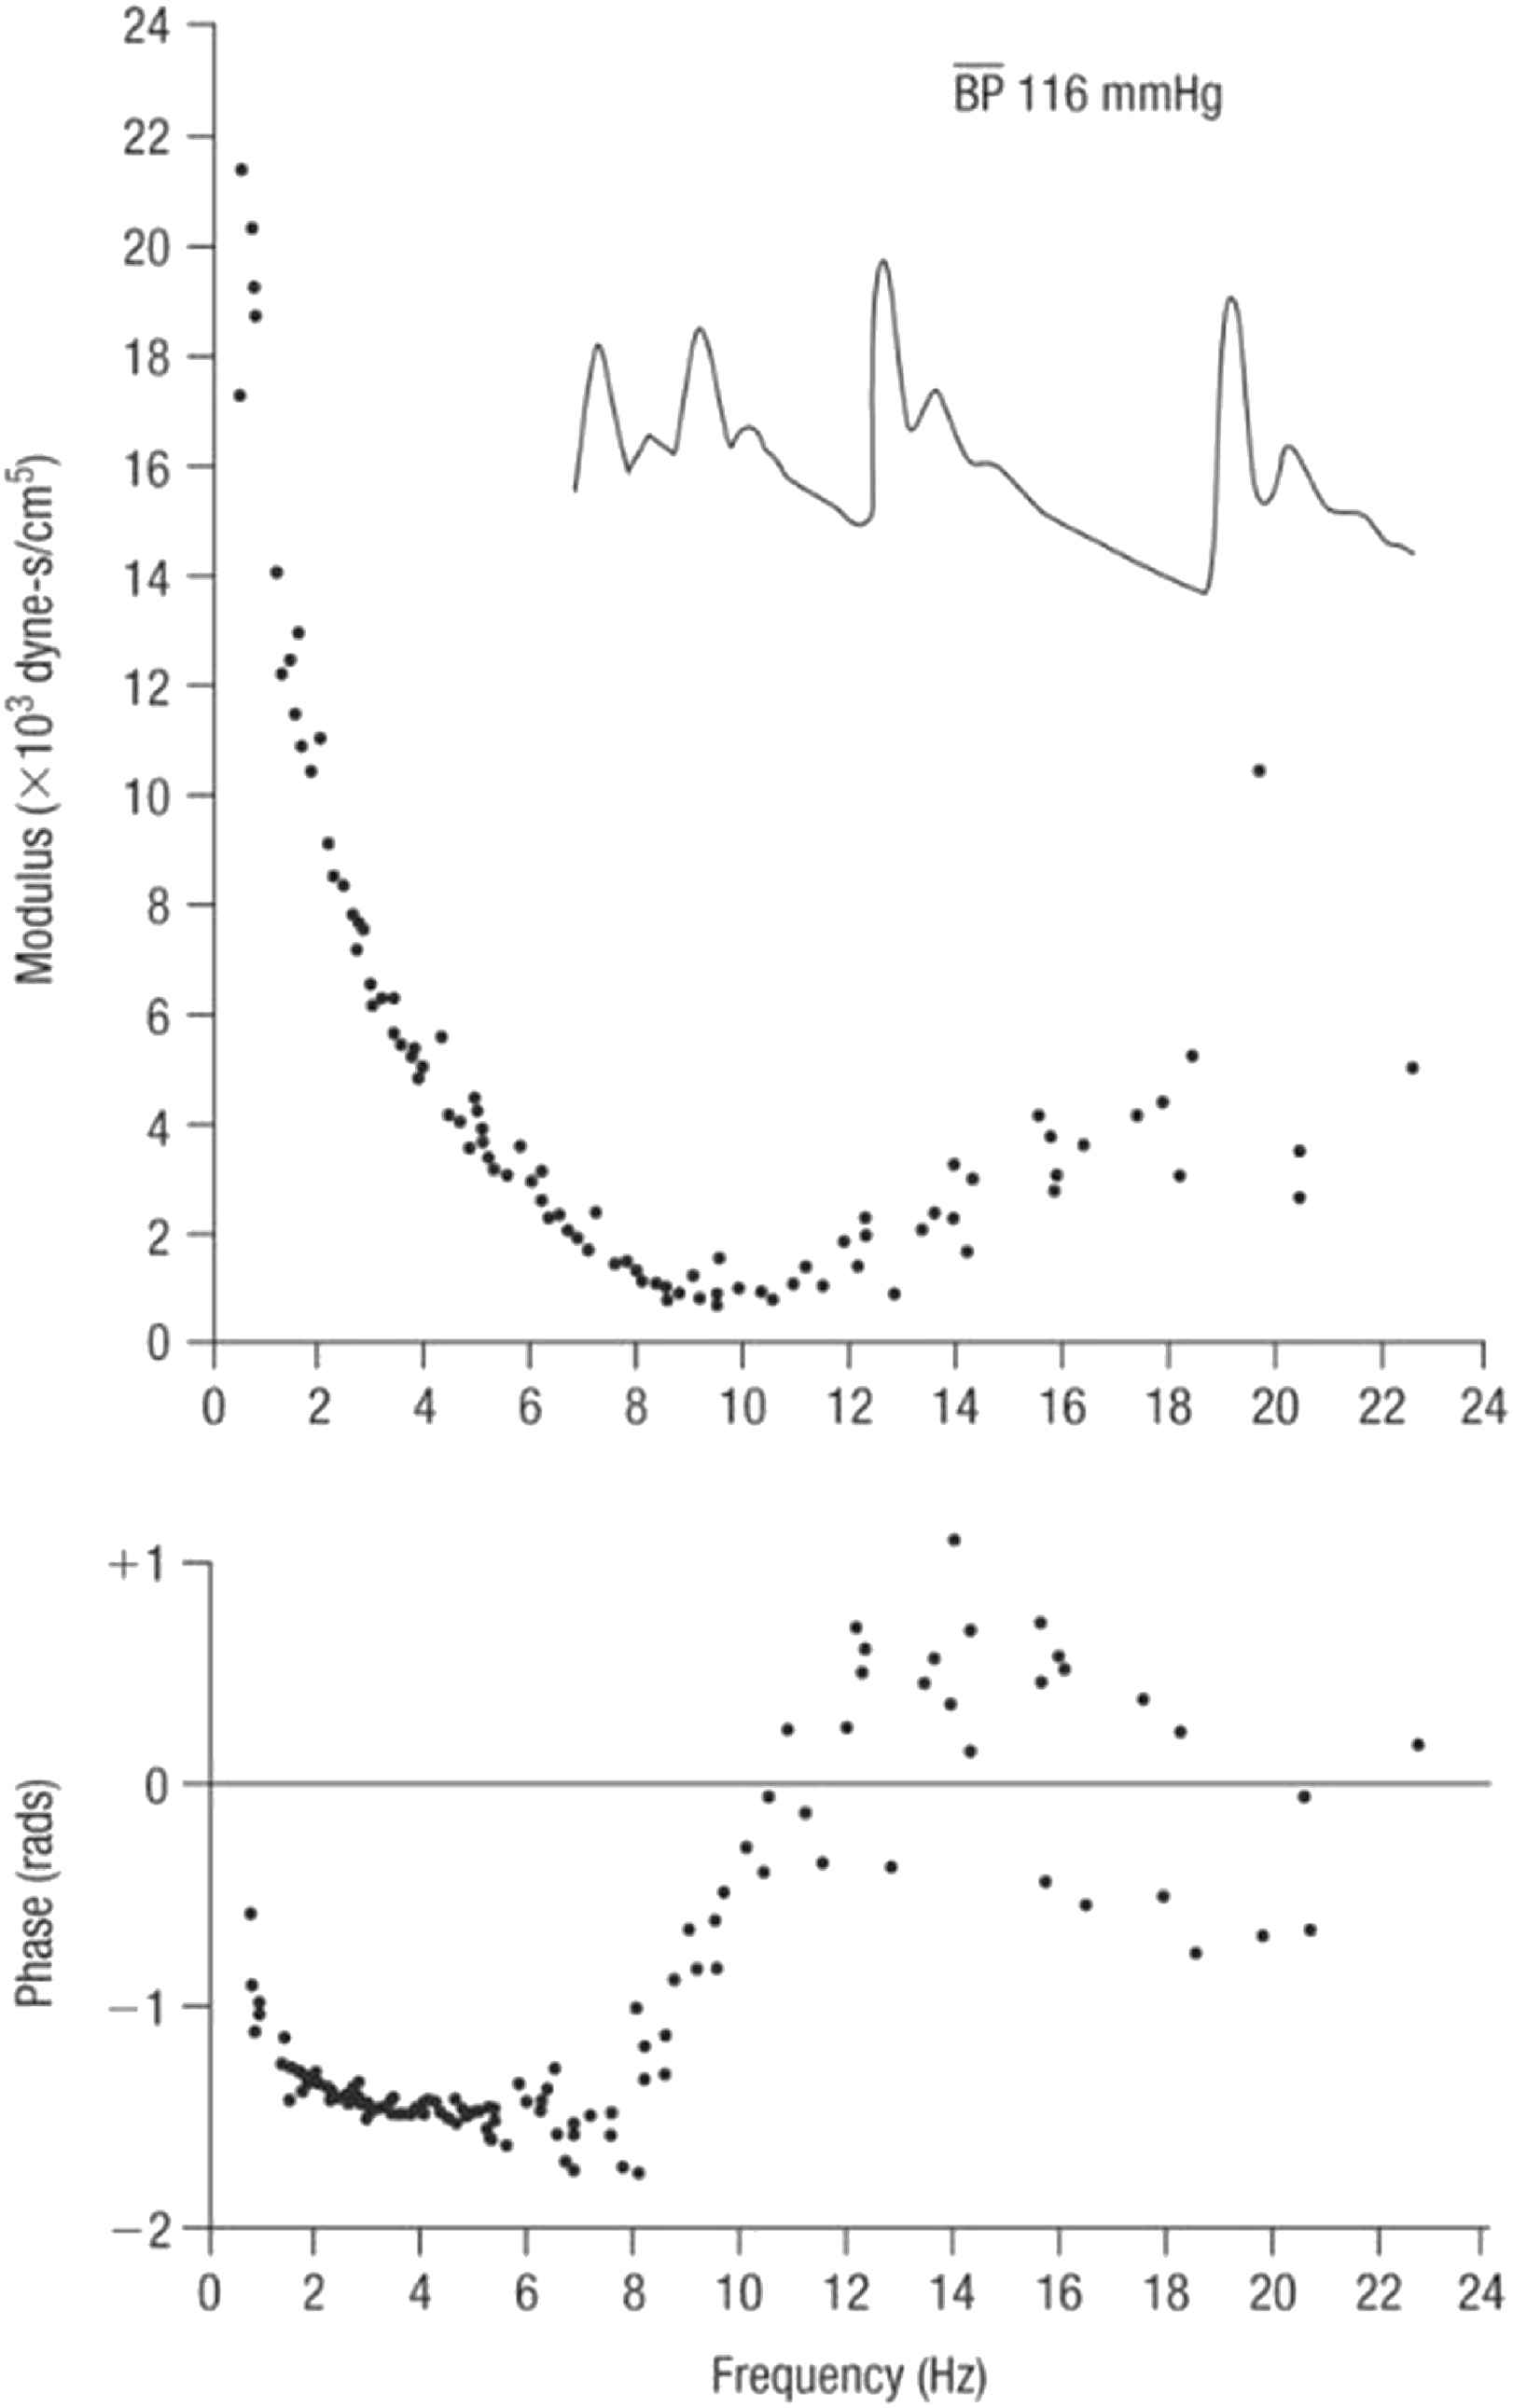
With respect to pulse waveform analysis, the key features on which we now depend are based on the collaboration between physiologist (Donald McDonald) and mathematician (John Womersley) at St. Bartholomew’s Hospital London in the 1950s.14,15 Womersley discovered the striking finding that non-linearities in the pressure/flow relationships of generalised pulsatile pressure/flow are sufficiently small to be neglected to a first approximation – at least in comparison to errors inherent in biological measurements. Key experimental data emerged from studies of impedance in the femoral artery of dogs (Fig. 5) where even with the heart rate irregular, values of impedance modulus and phase fall along the same curve when calculated from the first harmonic of waves with period of 0.333 s, or the third harmonic of waves with period of 1.00 s. Similar results were seen when the intrinsic heart rate was slow and the heart was paced at different frequencies (Fig. 6). These data supported clinical use of impedance and supported McDonald’s findings that there is insignificant carry over of one waveform into the following beat - i.e. reflections are effectively damped out within the cardiac cycle that generates them.
Impedance modulus (top) and phase (bottom) in the femoral artery of a dog with irregular heart rate. Inset are pressure waveforms in the same animal. From Ref. 28.
Impedance modulus (top) and phase (bottom) in the femoral artery of a dog. Impedance was determined from Fourier analysis of a series of waves recorded in this dog with heart block and paced at different frequencies. From Ref. 28.
Other considerations provide confidence in the use of analysis of pressure (and flow) waves in the time and frequency domain as shown by McDonald, confirming the views of prominent US physiologists in the influential 1963 Handbooks of the American Physiological Society.22,23 The main sites of wave reflection in the systemic circulation are the sites where there is the greatest mismatch of resistance – and this is the junction of each low resistance conduit artery with high resistance arteriole. Hales and Poiseuille24 first established this by pointing out that there is just a tiny drop of mean pressure in arteries down to 150μ diameter, with a sudden drop at the origin of arterioles from ∼100 mmHg to 30 mmHg over a distance of < 1 cm. This sudden change of resistance causes reflection of the pressure wave at these sites, and has the simultaneous effect of almost completely excluding flow pulsation from the arterioles, and capillaries. Milnor25 studied the dimensions of systemic circulation components,- with progressive and dramatic increase in total cross-sectional area of blood vessels in arteries of decreasing calibre down to the arterioles and capillaries (Fig. 7), and the relatively minor increase in cross-sectional area with progressive increase in vessel number within the larger distributing arteries. Poiseuille’s later work on peripheral resistance26 was deliberately done on capillary tubes which approximated the dimensions of arterioles.
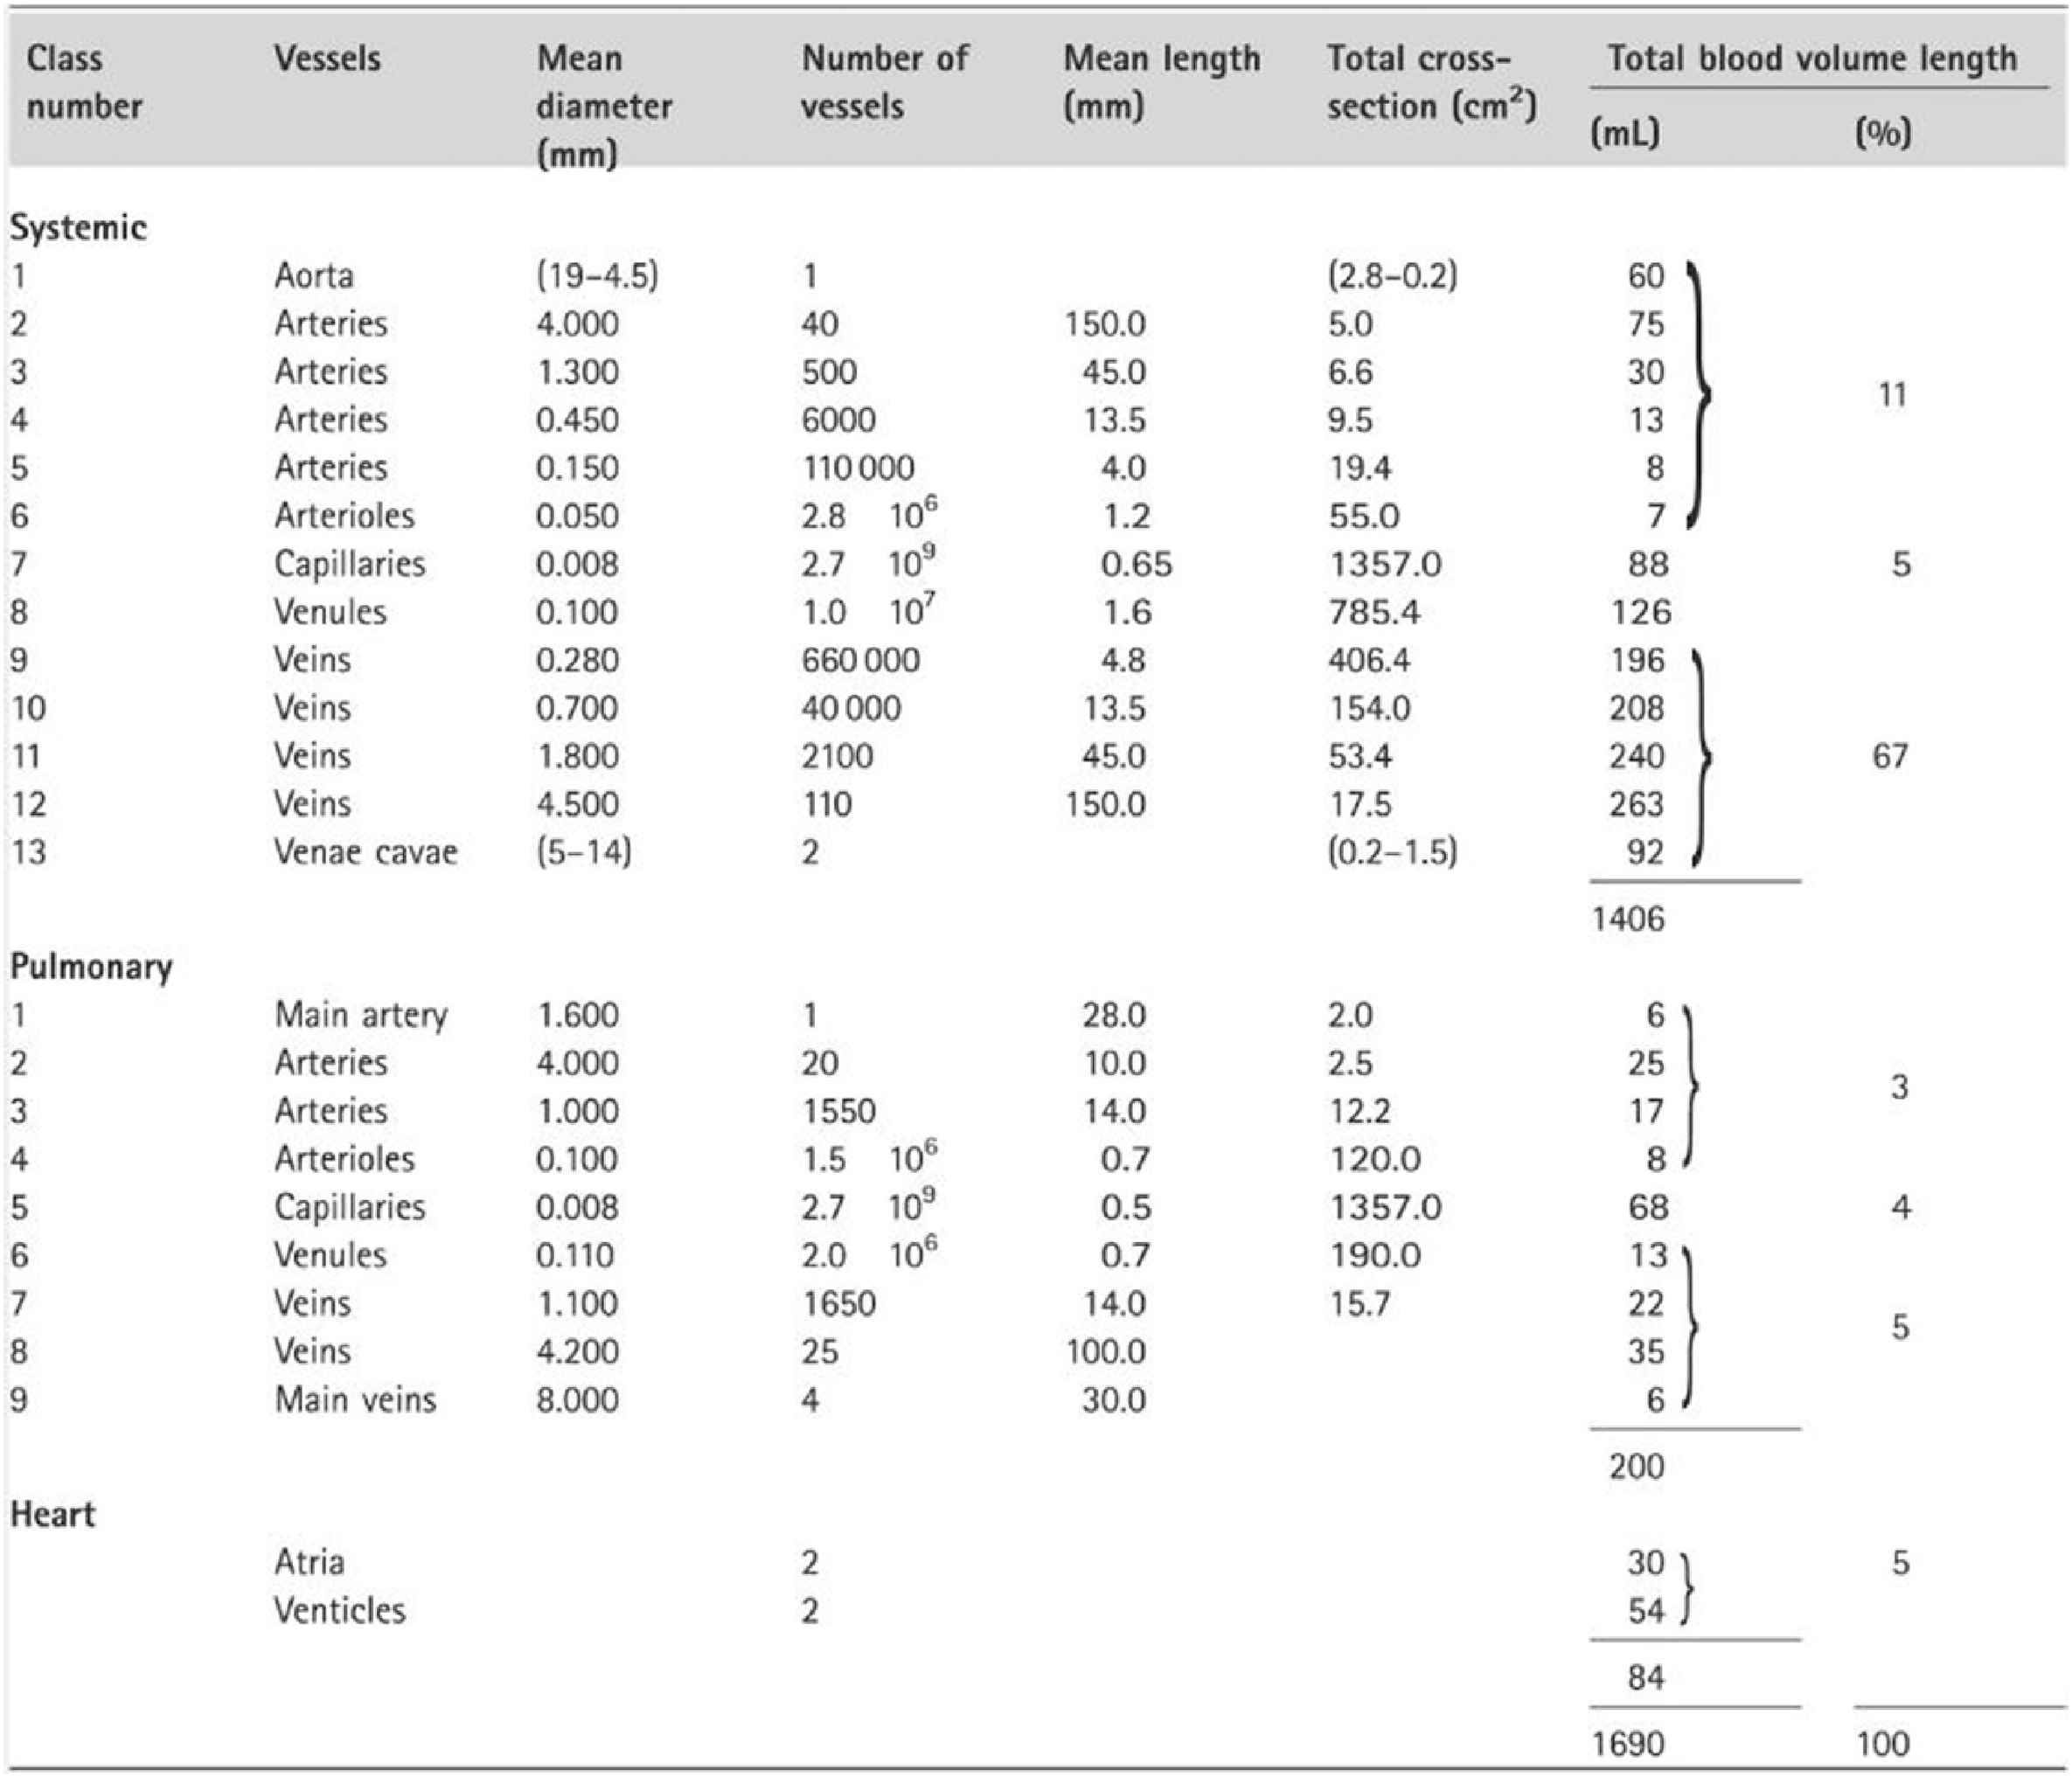
Dimensions of systemic circulation components, with progressive and dramatic increase in total cross-sectional area of blood vessels in arteries of decreasing calibre down to the arterioles and capillaries as published by Milnor.25
No consensus on appropriate usage of methods and models was reached at the London meeting. Views from keynote speakers Michael O’Rourke (this paper), Nico Westerhof and Kim Parker are presented in separate papers. In addition, a series of statements have been posed to participants, and their comments and level of agreement have been summarized in a separate paper. That document also contains our views and answers on these statements, consistent with past, present and likely future views in “McDonald’s Blood Flow in Arteries”.
Conflict of interest
ERE is supported in part by a grant from the USA
MFO is a founding director of AtCor Medical Pty Limited, manufacturer of systems for analysing the arterial pulse and Aortamate Pty Limited, developer of devices to improve aortic distensibility.
Other authors have no disclosure.
References
Cite this article
TY  - JOUR
AU  - Michael F. O’Rourke
AU  - Audrey Adji
AU  - Wilmer W. Nichols
AU  - Charalambos Vlachopoulos
AU  - Elazer R. Edelman
PY  - 2017
DA  - 2017/04/18
TI  - Application of arterial hemodynamics to clinical practice: A testament to medical science in London
JO  - Artery Research
SP  - 81
EP  - 86
VL  - 18
IS  - C
SN  - 1876-4401
UR  - https://doi.org/10.1016/j.artres.2017.03.003
DO  - 10.1016/j.artres.2017.03.003
ID  - O’Rourke2017
ER  -