
Sleep restriction and its influence on blood pressure
- DOI
- 10.1016/j.artres.2017.06.003How to use a DOI?
- Keywords
- Sleep loss; Blood pressure; BMI; Pulse wave analysis
- Abstract
Sleep is a major modulator of cardiovascular function. Since it’s more difficult to maintain adequate sleep duration among night watchmen during their working schedule, so in this study, we hypothesized that, the short sleep duration (<3 h) for 7 days in their night shift schedule, may possibly influence BMI, blood pressure and pulse wave analysis (PWA). In order to test this, we measured, anthropometric variable, heart rate (HR), systolic blood pressure (SBP), diastolic blood pressure (DBP), pulse pressure (PP) and mean arterial pressure (MAP), along with measurement from pulse wave analysis (PWA) such as augmentation pressure (AP), augmentation index (AIx), AIx normalized to a heart rate of 75 beats per minute (Alx@75%) and subendocardial viability ratio (SEVR) in nigh watchmen at 1st day, 4th day and 7th day of restricted sleep periods. We observed, among restricted sleep individuals, sleepiness was significant increase at 4th and 7th day when compare to normal sleep individuals, and apart from DBP, there was significant increase in, HR, SBP, PP and MAP, only at 7th day of restricted sleep period. However, the entire anthropometric variable and PWA analysis such as AP, Alx, Alx@75% and SEVR in sleep restricted individuals was comparable to normal sleep individuals in all restricted sleep periods. In summary, sleep restriction could play a role in the etiology of increased blood pressure and may have an impact to increase cardiovascular risk. This knowledge will be useful, to enabling risk factors and to improve health outcomes among night watchmen with early accomplishment.
- Copyright
- © 2017 Association for Research into Arterial Structure and Physiology. Published by Elsevier B.V. All rights reserved.
- Open Access
- This is an open access article distributed under the CC BY-NC license.
Introduction
In recent years, loss of sleep duration appears to be endemic in modern society, due to in excess of workload. Limitation of the sleep time period is thought to be harmful. Adequate sleep duration are important for the normal functioning of healthy life and however it can be affected by short-sleep duration and disruption of circadian rhythms.1 Sleep restriction occurs when an individual fails to get sufficient sleep. Sleep restriction is limit of sleep for less than 4 h of normal sleep duration (8–10 h).2 There is however, collective suggestion that sleep loss may be harmful not only to neurocognitive functions but also to the cardiovascular system.3,4 Short-sleep may lead to a variety of cardio-metabolic risk factors, such as increased body weight, glucose intolerance and high blood pressure(BP).2,5 The epidemiological studies have interrelated short hours of sleep (5 h) to increased risk of developing hypertension.6,7 Blood pressure (BP) is physiologically regulated by Cardiac contractility (the force of cardiac ejection of blood into the systemic circulation), cardiac output (blood volume pumped in liters per minute), and peripheral vascular resistance. These are under autonomic nervous control and linked to BP via a feedback baroreflex mechanism.8 Endothelial cells are differing in structure and function depending on the vascular tree.9 Therefore, the functional impact of arterial dysfunction associated with partial sleep deprivation, as opposed to the venous dysfunction, is trying to be addressed in this study.
Nowadays, measurement of the elasticity or stiffness of the arteries is part of routine clinical practice. Pulse wave analysis (PWA) is a noninvasive practice, measures peripheral pulse waveforms10 and being used for measuring arterial distensibility to assess cardiovascular health.11 The recording and analysis of the pulse waveform in an artery allow to derives measures of hemodynamic status, enabling derivation of arterial stiffness including, augmentation pressure (AP), augmentation index (AIx), and subendocardial viability ratio (SEVR) which are directly related to vascular elasticity and may allow assessment of cardiovascular risk.12,13 AP is well-defined as the difference between the primary (forward) and reflected systolic peak in central aortic pressures. It is a measure of central aortic pressure wave reflection in the vasculature and is a marker of adverse cardiovascular event.14 AIx, is a composite measure of central arterial stiffness and peripheral wave reflection. The reflected waves cause changes in pulse wave morphology that affects hemodynamic performance and vascular compliance. AIx is the difference between the pulse height of the primary (forward) systolic and reflected peak pressure waves divided by the central pulse pressure and expressed as a percentage.15 The augmentation index is the augmentation pressure expression as a proportion of the pulse pressure (PP).14 SEVR is Buckberg area ratio % of the systolic and diastolic in the aortic root pulse wave and expressed as a ratio of diastolic pressure time interval (DPTI) to systolic pressure time interval (SPTI) [Diastolic area: DPTI ÷ Systolic area: SPTI × 100]. It is a marker of myocardial oxygen supply and demand of subendocardial.16 Since subendocardial among the cardiac muscle is that, ischemic likely to occur compared to upper epicardium. SEVR is an indicator of myocardial ischemia due to arteriosclerosis, and can be correlated with risk factor of ischemic heart disease.16 A higher SEVR is better in terms of cardiovascular health, as lower values (at ∼50%) indicate decreased diastolic perfusion times and reduced coronary perfusion.17
Since it’s more difficult to maintain adequate sleep duration among night watchmen during their working schedule, so in this study, we hypothesized that, the restriction of sleep duration at work, may possibly influence anthropometric variables, measurements of BP and PWA analysis.
Methods
Ethics declaration
The study was approved by the local research advisory committee of People College of Medical Science and Research Center (PCMS/OD/2015/1056). The study was performed in accordance with the Declaration of Helsinki.
Participants
Inclusion and exclusion criteria
All Participants (watchmen) employed in Peoples University and nearby Community were recruited for the study. Participants meeting the following criteria were included; healthy, good sleeper, non-smoker, and free from medications, no history of depression, neurological disease, or chronic pain and underwent a medical interview to ensure that they had a regular sleep/wake schedule. Initially 70 young (age = 18–35 years) participants volunteer to participate, 20 were eliminated due to exclusion criteria or inability to follow schedule. The remaining 50 participants completed the one-week protocol. All selected participants gave written informed consent. The participants were divided into two groups.
Group I-(Normal sleep) (n = 28) – Twenty-eight watchman working in day time and used to have normal sleep in night (≥8 h).
Group II-(Restricted sleep) (n = 22) – Twenty-two watchman working in night time and used to have restricted sleep in night (≤3 h).
Protocol
Sleep schedule assessment
The participants were instructed to maintain a regular sleep–wake schedule and were monitored. No stimulant of any kind was allowed during the study. For the tests obtained in normal rested condition, instructed to participants to maintain normal sleep in night every day. In sleep restriction condition, participants were also instructed to sleep in night less than three hours (<3 h) for one week in their night shift schedule. All the participants were not allowed to sleep in day time. Participants slept at home and completed scheduled sleep diaries, regularly while at home, the duration of sleep was self-monitored. Total time in bed was recorded with a click button by the subject when getting into and out of bed. Participants reported less sleep during study duration which was also confirmed by monitors. After completion of one week study period, participants visited to the laboratory on the morning at 09:00 a.m for assessment. Each participant was tested after a normal sleep night and after a restricted sleep night in random order. The study was conducted in the department of physiology, peoples college of medical science and research center, Bhopal; India. All the measurement was assessed in the normal resting state, with abstinence from alcohol and caffeine at first (1st) day, fourth (4th) day and seventh (7th) day of restricted sleep period. All laboratory assessments were done in triplicate, at the end of study period.
Sleepiness measurement
Participant sleepiness was assessed using a modified version of the Karolinska Sleepiness Scale (KSS).18 The Karolinska Sleepiness Scale (KSS) is a 9-point Likert scale based on a self-reported, subjective assessment of the subject’s level of drowsiness at the time. These descriptors varied from 1 = “very alert” to 9 = “very sleepy, fighting sleep, an effort to keep awake”.
Anthropometric measurements
All measurement was done in the orthostatic position, Weight and height was measured without shoes and with light clothing. The BMI was calculated by dividing the body weight by the squared height.19 Waist circumference (WC) was measured midway between the lower rib and iliac crest; and hip circumference (HC) was measured horizontally over the widest part of the gluteal region at the level of the greater trochanter19 and was used to calculate the waist hip ratio (WHR). Neck circumference (NC) was measured immediately below the laryngeal prominence.20 The WHR and waist-to-height ratio (WHtR) were calculated by dividing WC by HC and by height, respectively.
Blood pressure recording
Systolic blood pressure (SBP) and diastolic blood pressure (DBP) was measured at the arm in a sitting position after a rest for at least 5 min at 1-min intervals between each measurement using an oscillometric digital BP monitor (HEM-7134E, Omron, Japan). The mean of three measurements was calculated and correspondingly used to evaluate pulse pressure (PP) and mean arterial pressure (MAP) [PP = SBP-DBP; MAP = DBP + 1/3PP].
PWA analysis
Pulse wave analysis was performed in a temperature-controlled room (25 °C) at the same time, first (1st) day, fourth (4th) day and seventh (7th) day of restricted sleep period for all participants in order to ensure uniformity in measurements. The measurements were taken by applying a hand-held tonometer attached to the SphygmoCor system (AtCor Medical Ltd). The tonometer consists of a high-fidelity micromanometer-tipped probe and intra-arterial pulse pressure is transmitted through the arterial wall to the sensor. The micromanometer-tipped probe was softly placed to the skin surface at the radial artery of the non-dominant arm in a non-occlusive manner, with the wrist slightly flexed and palm facing upwards. In this manner, radial artery waveforms, were picked up and digitized through the SphygmoCor software linked to a computer.
Radial artery waveforms were standardized from brachial pressures that were measured using an oscillometric digital BP monitor (HEM-7134E, Omron, Japan). A minimum of 20–30 radial waveforms for each participant was required to produce a corresponding ascending aortic pressure waveform based on authenticated mathematical transfer function within the SphygmoCor software (AtCor Medical, Sydney, Australia).10 To make sure quality control, only measurements with a Quality Index ≥90% and signal strength ≥500 units were accepted. The tonometry data acquired were utilized by the SphygmoCor software to derive values for heart rate (HR), AP, AIx, and SEVR. Since HR is one of the main factor affecting Alx. Therefore for the final analysis Alx was normalized to a heart rate of 75 beats per minute (Alx@75%) [Alx@75% = Alx-0.39(75-HR)].21
Sample size calculation
Considering a confidence level of 95% and confidence interval of 10 and the number of individuals in our study should be 66 to achieve statistical significance. This was calculated by Survey System (http://www.surveysystem.com/sscalc.htm#one). The mathematics of probability proves the size of the population is irrelevant unless the size of the sample exceeds a few percent of the total population we are examining. The survey System ignores the population size when it is “large” or unknown.
Statistical analysis
Data are expressed as Mean ± Standard deviation (SD). All data were analyzed with the SPSS for windows statistical package (version 20.0, SPSS Institute Inc., Cary, North Carolina). Statistical significance between the different groups was determined by the independent student ‘t’ test and repeated measured analysis was performed among groups. The significance level was fixed at p ≤ 0.05.
Results
Effect of restricted sleep on sleepiness
The data are summarized in (Table 1) with mean ± SD. Among all normal and restricted sleep individuals, KSS score was comparable on 1st day of restricted sleep period. However at subsequent on 4th day and 7th day of restricted sleep period, there was significant increase in KSS score in restricted sleep individuals when compare to normal sleep individuals, indicating higher levels of sleepiness. In addition to, sleepiness level on 7th day was more significant increase, when compare with 4th day of restricted sleep period.
| KSS | 1st Day | 4th Day | 7th day |
|---|---|---|---|
| Normal sleep | 2.6 ± 0.6 | 2.4 ± 0.6 | 2.5 ± 0.5 |
| Restricted sleep | 2.5 ± 0.4 | 4.4 ± 0.7* | 6.5 ± 0.9*# |
| Anthropometric variable | |||
| Body weight (kg) | |||
| Normal sleep | 64.23 ± 10.34 | 69.39 ± 11.33 | 67.10 ± 12.38 |
| Restricted sleep | 63.27 ± 11.45 | 66.95 ± 9.98 | 70.63 ± 10.52 |
| Body mass index (kg/m2) | |||
| Normal sleep | 21.89 ± 8.24 | 22.52 ± 7.32 | 24.32 ± 5.64 |
| Restricted sleep | 22.45 ± 7.15 | 25.30 ± 6.56 | 27.83 ± 8.67 |
| Neck circumference (cm) | |||
| Normal sleep | 34.23 ± 8.08 | 36.62 ± 9.32 | 35.30 ± 8.90 |
| Restricted sleep | 33.34 ± 9.76 | 35.50 ± 7.35 | 34.87 ± 6.89 |
| Waist circumference (cm) | |||
| Normal sleep | 85.47 ± 9.32 | 89.60 ± 11.42 | 88.32 ± 10.15 |
| Restricted sleep | 86.56 ± 8.98 | 87.49 ± 7.47 | 89.36 ± 9.69 |
| Hip circumference (cm) | |||
| Normal sleep | 73.39 ± 11.24 | 76.65 ± 12.54 | 74.19 ± 10.72 |
| Restricted sleep | 72.45 ± 9.86 | 74.89 ± 10.45 | 75.63 ± 8.79 |
| Waist to hip ratio | |||
| Normal sleep | 0.65 ± 0.07 | 0.66 ± 0.05 | 0.69 ± 0.08 |
| Restricted sleep | 0.66 ± 0.05 | 0.68 ± 0.04 | 0.70 ± 0.06 |
| Waist to height ratio | |||
| Normal sleep | 0.43 ± 0.03 | 0.41 ± 0.05 | 0.42 ± 0.03 |
| Restricted sleep | 0.45 ± 0.04 | 0.42 ± 0.06 | 0.44 ± 0.05 |
Effect of restricted sleep on Karolinska Sleepiness Scale (KSS) and anthropometric variable, Where *significance change (p ≤ 0.05) compared with normal sleep and # – significance change (p ≤ 0.05) compared with 4th day.
Effect of restricted sleep on anthropometric variable
The data are summarized in (Table 1) with mean ± SD. However, all anthropometric variable such as BMI, NC, WC, HC, WHR and WHtR, didn’t show any significant variation among restricted sleep individuals when compare to normal sleep individuals with in this period of restricted sleep.
Effect of restricted sleep on HR and PWA
The data are summarized in (Table 2) with mean ± SD. The HR was comparable in among all normal and restricted sleep individuals on 1st day and 4th day of restricted sleep. However at subsequent on 7th day of restricted sleep period, it was significantly increased in restricted sleep individuals when compare to normal sleep individuals. However, all the variable of pulse wave analysis, such as, AP, AIx, Alx@75% and SEVR, was comparable in both restricted and normal sleep individuals, in all the restricted sleep periods.
| Heart rate (bpm) | 1st Day | 4th Day | 7th day |
|---|---|---|---|
| Normal sleep | 73 ± 8 | 72 ± 10 | 73 ± 9 |
| Restricted sleep | 71 ± 9 | 75 ± 8 | 115 ± 10*# |
| Pulse wave analysis | |||
| AP (mmHg) | |||
| Normal sleep | 6.50 ± 3.35 | 6.92 ± 4.16 | 6.70 ± 3.70 |
| Restricted sleep | 6.75 ± 3.80 | 7.86 ± 2.30 | 9.47 ± 4.43 |
| AIx | |||
| Normal sleep | 12.50 ± 5.80 | 13.27 ± 4.55 | 12.79 ± 4.28 |
| Restricted sleep | 12.28 ± 4.55 | 11.62 ± 3.74 | 10.37 ± 5.16 |
| AIx@75% | |||
| Normal sleep | 12.35 ± 6.75 | 11.80 ± 5.08 | 10.63 ± 4.16 |
| Restricted sleep | 11.72 ± 5.20 | 11.40 ± 4.95 | 10.35 ± 3.80 |
| SEVR | |||
| Normal sleep | 165 ± 11 | 167 ± 12 | 164 ± 10 |
| Restricted sleep | 167 ± 10 | 162 ± 09 | 157 ± 13 |
Effect of restricted sleep on heart rate and pulse wave analysis, Where *significance change (p ≤ 0.05) compared with normal sleep and # – significance change (p ≤ 0.05) compared with 4th day. [AP: Augmentation pressure, Aix: augmentation index, AIx@75%: AIx normalized to a heart rate of 75 beats per minute and SEVR: subendocardial viability ratio].
Effect of restricted sleep on BP
The data are précised in (Fig. 1a–d) with mean ± SD. The blood pressure variable such as SBP, DBP, PP and MAP was comparable in among all normal and restricted sleep individuals on 1st day and 4th day of restricted sleep. However, apart from DBP, variables such as: SBP, PP and MAP were significantly increased in restricted sleep individuals, when compare to normal sleep individuals after subsequent 7th day of restricted sleep period. On top of, this variable was more significant increase, when compare with 4th day of restricted sleep period.
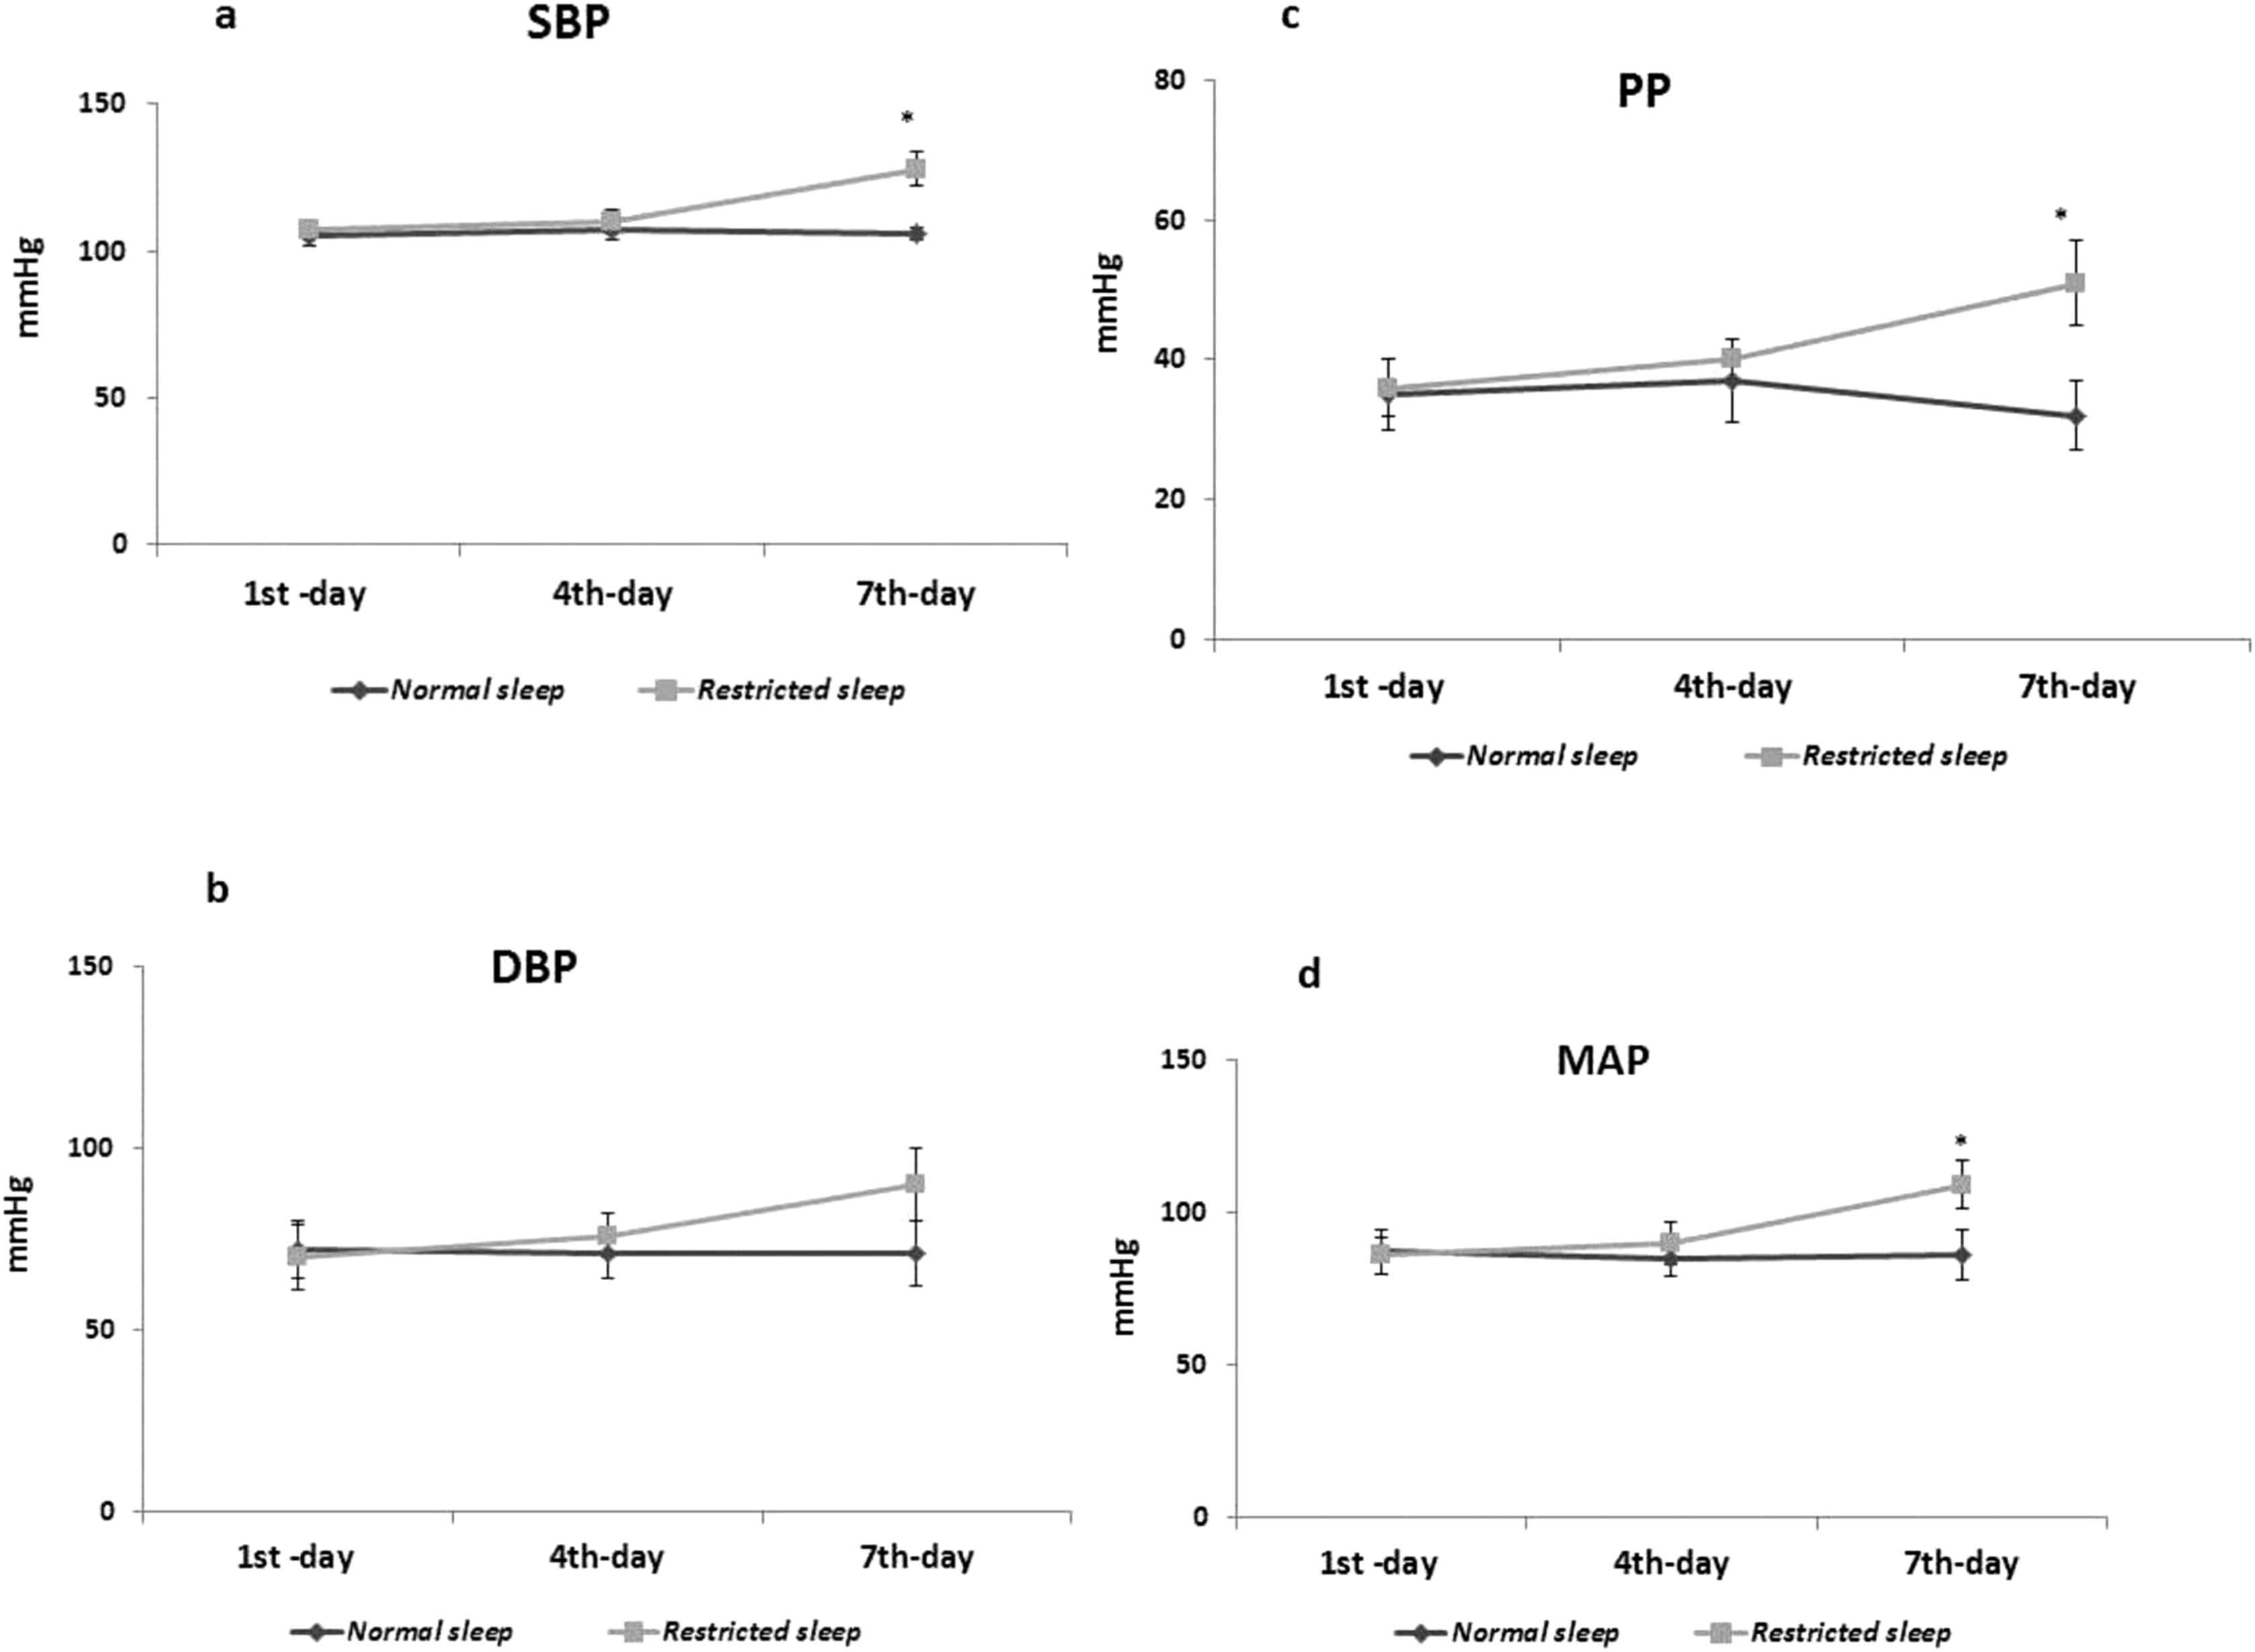
a–d: Effect of restricted sleep on blood pressure variable. Where *significance change (p ≤ 0.05) compared with normal sleep and # – significance change (p ≤ 0.05) compared with 4th day. [SBP: Systolic blood pressure; DBP: Diastolic blood pressure; PP: Pulse pressure and MAP: Mean arterial pressure].
Discussion
Supporting our hypothesis, the major finding in this study is that acute sleep loss, during working schedule among night watchmen, causes a significant increase in blood pressure variable (excluding DBP) and heart rate, devoid of modifying anthropometric measurement and pulse wave analysis. Numerous studies have found total sleep deprivation may leads to increased BP,22,23 in addition to, short sleep duration may also as a risk factor for increase BP and hypertension,6 however, half a night of sleep loss has been reported to increase BP in subjects with hypertension or prehypertension.24 Blood pressure may possibly be increased during sleep loss, because of increased sympathetic outflow to the heart or periphery25 or changes in baroreflex sensitivity.26 Acute sleep restriction has been shown to increase blood pressure and sympathetic nervous system activity.6 When sleep loss was restricted to 3.6–4.5 h in normal healthy individuals, there was a significant increase in blood pressure and sympathetic nervous system activity.27,28 Hence, sleep loss may involve in increased sympathetic cardiac outflow and decreased baroreflex sensitivity; which may be responsible for BP modulation in this study.29
Along with systolic and diastolic blood pressures, the variable relation between, MAP and PP, the steady and pulsatile components of BP respectively, have additional clinical value to determine a more precise evaluation of BP. Physiologically, PP describes the oscillation around the MAP and is influenced by hemodynamic mechanisms that differ from MAP, which reflects steady flow in the aorta and its major arteries during a given cardiac cycle.30 The pulse pressure (PP), also represents blood pressure variation and affected by left ventricular ejection fraction, aortic stiffness, and heart rate.31 The mean arterial pressure (MAP), is a function of left ventricular contractility, heart rate, and vascular resistance.31 Increased PP may be explained by increased ventricular ejection in young individual with systolic hypertension, but more commonly, with increasing age it is likely to be due to a decrease in compliance (elasticity) of the arterial system such as aorta and other large arteries.30 We observed there was significant increase in PP and MAP in restricted sleep individuals, when compare to normal sleep individuals. The rise in SBP, PP and MAP, may lead to prone for prehypertension or hypertension.32 The positive association between SBP, PP and MAP and the risk of cardiovascular complication is well established.31
Short sleep may also prolongs exposure to stress, which has been shown to promote salt appetite and suppress renal salt-fluid excretion and lead to hemodynamic load.33 This Prolonged exposures to elevated hemodynamic load, can lead to structural adaptations, such as arterial and left ventricular hypertrophic remodeling, that gradually entrain the cardiovascular system to operate at elevated blood pressure equilibrium. Hence short sleep duration might be a significant etiological factor for developing prehypertension or hypertension.
The endothelial dysfunction is also may be one of the key factors in, linking sleep disturbances and increased risk of cardiovascular disease and it is associated with impairment of arterial and venous endothelium-dependent dilation.34,35 Endothelial cells are differing in structure and function depending on the vascular tree.9 Previous study has observed that partial sleep deprivation (for 5 nights) is able to linked with vascular dysfunction and observed it cause a decrease in endothelial-dependent vasodilatation induced by acetylcholine and explain the association between short sleep and increased cardiovascular risk.36 Therefore, the functional impact of arterial dysfunction (as opposed to the venous dysfunction) associated with partial sleep deprivation was lacking until now and this was trying to be addressed in this study.
An increase in heart rate shortens the duration of systole. As a result, the reflected wave reaches the advancing wave in diastole (rather than the usual systole), resulting in reduced augmentation of the advancing wave, that is reduced AIx. As there is a linear relationship between heart rate and AIx, hence the AIx was standardized to a heart rate of 75 beats per minute (AIx-75). However, in this study we didn’t find any significant change in Alx, AIx-75 and DBP, in all the restricted sleep periods, when compare to control. However, the exact region it does remain unclear at this stage.
Conversely, pulse wave analysis was comparable in restricted individuals when compare with control individuals. Hence, sleep restriction for 7-days, may not have influence on arterial dysfunction, which may be consistent without any significant alteration observed in DBP in this study. But then again, if sleep restriction continued for longer period, due to excess workload, among nigh watchmen, possibly may promote further for vascular and cardiac complications.
Some of the previous studies have observed; there is a significant positive association between short sleep duration and higher BMI along with obesity.37–39 However, our results are not consistent with higher BMI as well as obesity; since we didn’t observe any significant change in BMI and anthropometric measurements in restricted sleep individuals, when compare to normal sleep individuals, within this period of restricted sleep.
Limitations of the study
Sleep deprivation can sometimes be self-imposed due to a lack of desire to sleep or the habitual use of stimulant drugs. Sleep loss in animal studies are predominantly based on voluntary participation whereas human sleep loss are due to arguably forced and aversive conditions such as social activities, studying, gaming, and workload. Several confounding factors, like together with stress, food intake, and environmental stimulus, were not monitored. Study in animal model has showed that, the difference between the sleep deprivation conditions (voluntary/involuntary) differentially affects sleep phenotypes.40,41 At this stage, we are unclear to figure out this response in our study. Small number of participants and protocol was restricted to males; these results may differ in larger male population and females.
Conclusion
In summary, the results of this present study suggest that short sleep duration could play a role in the etiology of increased blood pressure. Further research is needed to investigate the biological mechanisms that link short sleep duration and high blood pressure. Sleep loss, among night watchmen during their working schedule, may have an impact on increased cardiovascular risk. Therefore, this knowledge will be useful, to enabling risk factors to be modified and the potential to improve health outcomes among night watchmen with early accomplishment. This supports justification for earlier recognition and investigation of such participants where appropriate.
Conflict of interest
The authors declared no conflict of interest.
Acknowledgments
We gratefully acknowledge the financial support provided by the People’s University, Bhopal, India.
References
Cite this article
TY  - JOUR
AU  - Arbind Kumar Choudhary
AU  - Anup Kumar Dadarao Dhanvijay
AU  - Tanwir Alam
AU  - Sadawarte Sahebrao Kishanrao
PY  - 2017
DA  - 2017/07/06
TI  - Sleep restriction and its influence on blood pressure
JO  - Artery Research
SP  - 42
EP  - 48
VL  - 19
IS  - C
SN  - 1876-4401
UR  - https://doi.org/10.1016/j.artres.2017.06.003
DO  - 10.1016/j.artres.2017.06.003
ID  - Choudhary2017
ER  -