
Elevated levels of IL-6 and IL-9 in the sera of patients with AAA do not correspond to their production by peripheral blood mononuclear cells
- DOI
- 10.1016/j.artres.2017.12.007How to use a DOI?
- Keywords
- Abdominal Aortic Aneurysm (AAA); IL-9; IL-10; PBMC; Serum
- Abstract
Background: Abdominal Aortic Aneurysm (AAA) is the stable local dilatation of abdominal aorta. AAA is an inflammatory condition in which cytokines may play a pathogenic role.
Methods: Peripheral Blood Mononuclear cells (PBMCs) were isolated from 5 men, with confirmed diagnosis of AAA and aortic dilation greater than 5.5 cm, and 5 men with normal/insignificant angiography, CT-Scan and Ultrasonography results. The supernatant of PBMCs, rested overnight in RPMI containing 10%-FBS, removed to measure IL-2, IL-4, IL-5, IL-6, IL-9, IL-10, IL-13, IL-17A, IL-17F, IL-21, IL-22, IFN-γ and TNF-α using a commercial fluorescent-labeled bead assay.
Results: The mean serum IL-6 and IL-9 levels were significantly higher in patients than controls (P = 0.007 and P = 0.007, respectively). PBMCs from patients produced lower levels of IL-6 and IL-9 compared to controls but the differences were not significant. While serum TNF-α level was not different between groups, its production by PBMCs of patients was significantly lower than controls (P = 0.047). The mean serum levels of IL-10 and IFN-γ in patients were marginally higher than controls (P = 0.055, P = 0.055, respectively). Mean serum IL-2 level was not different between the groups but its production by PBMCs of patients was significantly higher than the control group (P = 0.047).
Conclusions: Our study showed alteration in the levels of cytokines from inflammatory, Th1, Th2 and Th17 subtypes in the sera of patients with AAA. The production of IL-6, IL-9, IFN-γ and IL-10, however, was not solely attributed to the PBMCs. Therefore, participation of other cells in the tissue or blood should be considered in their production.
- Copyright
- © 2018 Association for Research into Arterial Structure and Physiology. Published by Elsevier B.V. All rights reserved.
- Open Access
- This is an open access article distributed under the CC BY-NC license.
Introduction
Abdominal Aortic Aneurysm (AAA) is one of the most common forms of deadly atherosclerotic events.1 AAA is defined as the stable local dilatation of abdominal aorta with a diameter of more than 3 cm or an increase in diameter of more than 50% relative to normal.2 Smoking, family history, higher age and male gender are other known factors to correlate with the disease incidence.3,4 AAA is often asymptomatic but rupture of aneurysm is a major risk of death with a mortality rate of 85–90%.5,6 Although the prevalence of abdominal aortic aneurysms has been rising until mid 1990s, it seems that in recent years its prevalence has been decreasing. In a recent study in Sweden, ultrasonographic screening for 65-year old men showed a decrease of prevalence from 4–8% to 2.2% over the five years.7 Abdominal aortic aneurysms cause 13,000 deaths annually in the United States.8 Shirani et al. reported that 2.9% of CABG candidates in Iran appear to have abdominal aortic aneurysms.9
Smoking is a major risk factor for AAA where nicotine increases the expression of ICAM-1 and VCAM-1 and induces IL-1β and TNF-α production by macrophages in the aortic wall.10 Also, cigarette smoke components increase the expression of MMP-2 and MMP-9.11 AAA is an inflammatory condition in which inflammatory cells, including T lymphocytes, penetrate into various vascular layers and secrete cytokines and inflammatory chemokines. Infiltration of the vascular wall with lymphocytes and macrophages is followed by destruction of elastin and collagen in the media and adventitia layers by proteases such as matrix metalloproteinases, and smooth muscle cell loss, which decreases the thickness of media associated with new angiogenesis.12 Currently, AAA is known as an sterile inflammatory disease, in which inflammatory response is induced by an internal stimuli such as damage associated molecular patterns (DAMP) or risk signals (such as S100A8/9 and Hmgb1), recognized by receptors on innate immune and other cells.13 Atherosclerosis and high blood pressure are also associated with AAA.14
Excessive accumulation of LDL and cholesterol crystals, and secretion of post-cell death stress proteins such as S100A8/9 and Hmgb1 trigger inflammasome activation and cytokines production by aortic wall macrophages.15,16 The accumulation of inflammatory cells, including CD4+ T cells, B cells and macrophages has been observed in the aortic lesions of AAA.17 The secretion of cytokines can lead to the production of matrix metalloproteinases and cathepsin that through destruction of the aortic wall, inflammation, and loss of smooth muscle cells lead to aneurysm and rupture.18 Despite the close association between aneurysm and atherosclerosis, AAA is now known as a degenerative process that involves all layers of the vascular wall, especially media and adventitia with abundant inflammatory cells in lesions. Another important difference between these two diseases is the predominant Th1 cytokine response in atherosclerosis and Th2 cytokine response in AAA.19 In both diseases cytokines produced by T helper cells determine the outcome of arterial inflammation. Increased levels of IL-1, IL-6, TNF-α and IFN-γ and their role in the pathogenesis of AAA have been shown.20 On the other hand, human studies have shown that Th2 (IL-4, IL-5) cytokines and IL-10 are predominant in AAA lesions, while in the atherosclerotic lesions Th1 (IL-2, IFN-γ) cytokines are abundant.21 Interestingly, both Th1 and Th2 cytokine genes and transcription factors are expressed in AAA22 and both Th1 and Th2 cytokines can induce or stop expression of specific MMPs according to different conditions.23 It is suggested that Th1 cytokines may participate in the formation of atherosclerotic lesion in early stages while Th2 cytokines participate in the further development of aneurysm.24,25
In addition to Th1 and Th2, other immune inflammatory cytokines are reported to play a role in either of the diseases. Previous studies have reported elevated plasma levels of IL-9 in patients with acute coronary syndrome and atherosclerosis.26,27 In AAA, IL-17A seems to have a pathogenic role, since AAA progression significantly decreases in Il-17A−/− and- Il-23−/− rats.28 The IL-10 immunosuppression, however, works against the progression of AAA suggested by more sensitivity of IL-10−/− mice to AngII induced AAA.29 Interestingly, IL-10 shows a significant increase in aneurysm-affected tissue.30
Method and material
Patients with abdominal aortic aneurysm were diagnosed by the collaborator vascular surgeon, based on clinical and paraclinical indices. Five AAA patients were included in this study; all of them were male (100%), with an average age of 70.40 ± 6.76 years, who were listed for surgery due to their acute state. The control group was selected from among the patients referred for angiography and surveying cardiac disorders, which in addition to the normal results of echocardiography, sonography and CT scan, had normal/insignificant angiography results and no signs of AAA were observed. Control group consisted of 5 men with an average age of 71.80 ± 4.65 years. 30 ml blood was collected from both groups after informed consent. Plasma samples were isolated and stored at −80 °C until next used. Lymphodex™ (Inno-Train, Germany) concentration gradient method was used to isolate PBMCs from blood. Then, the PBMCs of the patients and control groups were incubated for 48 h at 37 °C, 5% CO2 and 95% moisture in the RPMI plus 10% FBS culture medium. After incubation, the supernatant was removed to measure the cytokines. Cytokines were measured by LEGENDplex panel (Biolegend, United States) using fluorescent-labeled beads. The panel allowed simultaneous measurement of 13 cytokines from different T helper and inflammatory subtypes. In this assay, beads with different sizes labeled with different antibodies against cytokines were used. Beads are differentiated by size and internal fluorescence intensities. Capture beads were mixed and incubated with a sample containing target cytokines specific to the capture antibodies, then they bound to the specific capture beads. There are reporter fluorochromes (PE and FITC) in this assay that help identify the signal. Since the beads were differentiated by size and internal fluorescence intensity on a flow cytometer, cytokine-specific populations were segregated and PE fluorescent signal quantified. The concentration of a particular analyte was determined using a standard curve generated in the same assay. The measured cytokines included IL-2, IL-4, IL-5, IL-6, IL-9, IL-10, IL-13, IL-17A, IL-17F, IL-21, IL-22, IFN-γ and TNF-α, which are produced by Th1, Th2, Th17, and other T helper subsets, respectively. The serum and PBMC produced cytokines in each patient and control individual is shown in Table 1.
| Cytokines | Group | Mean ± SD | P value |
|---|---|---|---|
| TNF-α | Case | 3.31 ± 0.69 | 0.44 |
| Control | 5.21 ± 3.26 | ||
| IL-6 | Case | 65.35 ± 58.30 | 0.007 |
| Control | 6.23 ± 3.06 | ||
| IL-10 | Case | 13.61 ± 13.96 | 0.055 |
| Control | 2.02 ± 1.00 | ||
| IFN-γ | Case | 71.04 ± 34.24 | 0.09 |
| Control | 32.04 ± 9.34 | ||
| IL-2 | Case | 13.81 ± 9.23 | 0.99 |
| Control | 11.20 ± 3.64 | ||
| IL-13 | Case | 4.89 ± 2.28 | 0.22 |
| Control | 3.46 ± 1.22 | ||
| IL-5 | Case | 2.49 ± 1.15 | 0.055 |
| Control | 1.32 ± 0.50 | ||
| IL-9 | Case | 10.53 ± 7.75 | 0.007 |
| Control | 2.39 ± 0.87 | ||
| IL-4 | Case | 1.25 ± 0.57 | 0.99 |
| Control | 1.00 ± 0.00 | ||
| IL-17A | Case | 38.25 ± 14.80 | 0.28 |
| Control | 29.98 ± 4.47 | ||
| IL-17F | Case | 1.31 ± 0.54 | 0.44 |
| Control | 1.00 ± 0.00 | ||
| IL-21 | Case | 24.22 ± 6.42 | 0.06 |
| Control | 16.11 ± 4.93 | ||
| IL-22 | Case | 40.02 ± 7.90 | 0.84 |
| Control | 34.03 ± 11.75 |
Significant of bold values indicate P < 0.05.
Serum level of cytokines in patients and controls.
To analyze the data, both individual cytokines and group of cytokines based on the subsets were considered. Inflammatory group of cytokines included IL-6 and TNF-α, and anti-inflammatory cytokine was IL-10. Th1 group of cytokines included IL-2, and IFN-γ and Th2 group of cytokines included IL-4, IL-5, IL-9 and IL-13 and Th17 cytokines included IL-17A, IL-17F, IL-21 and IL-22.
SPSS software (version 16) was used to analyze the collected data. Data on age and level of cytokines in patients and controls were reported as mean ± standard deviation. Chi square test (χ2) was used to test the statistical differences of discontinuous variables such as gender between two groups. Mann Whitney U test was used to test the statistical differences between continuous variables such as age and cytokines levels between control and patient groups. The data were also analyzed by One-Way Anova test. In all of the tests, statistical differences less than 0.05 were considered significant.
Results
Comparison of individual serum cytokines between patients and controls
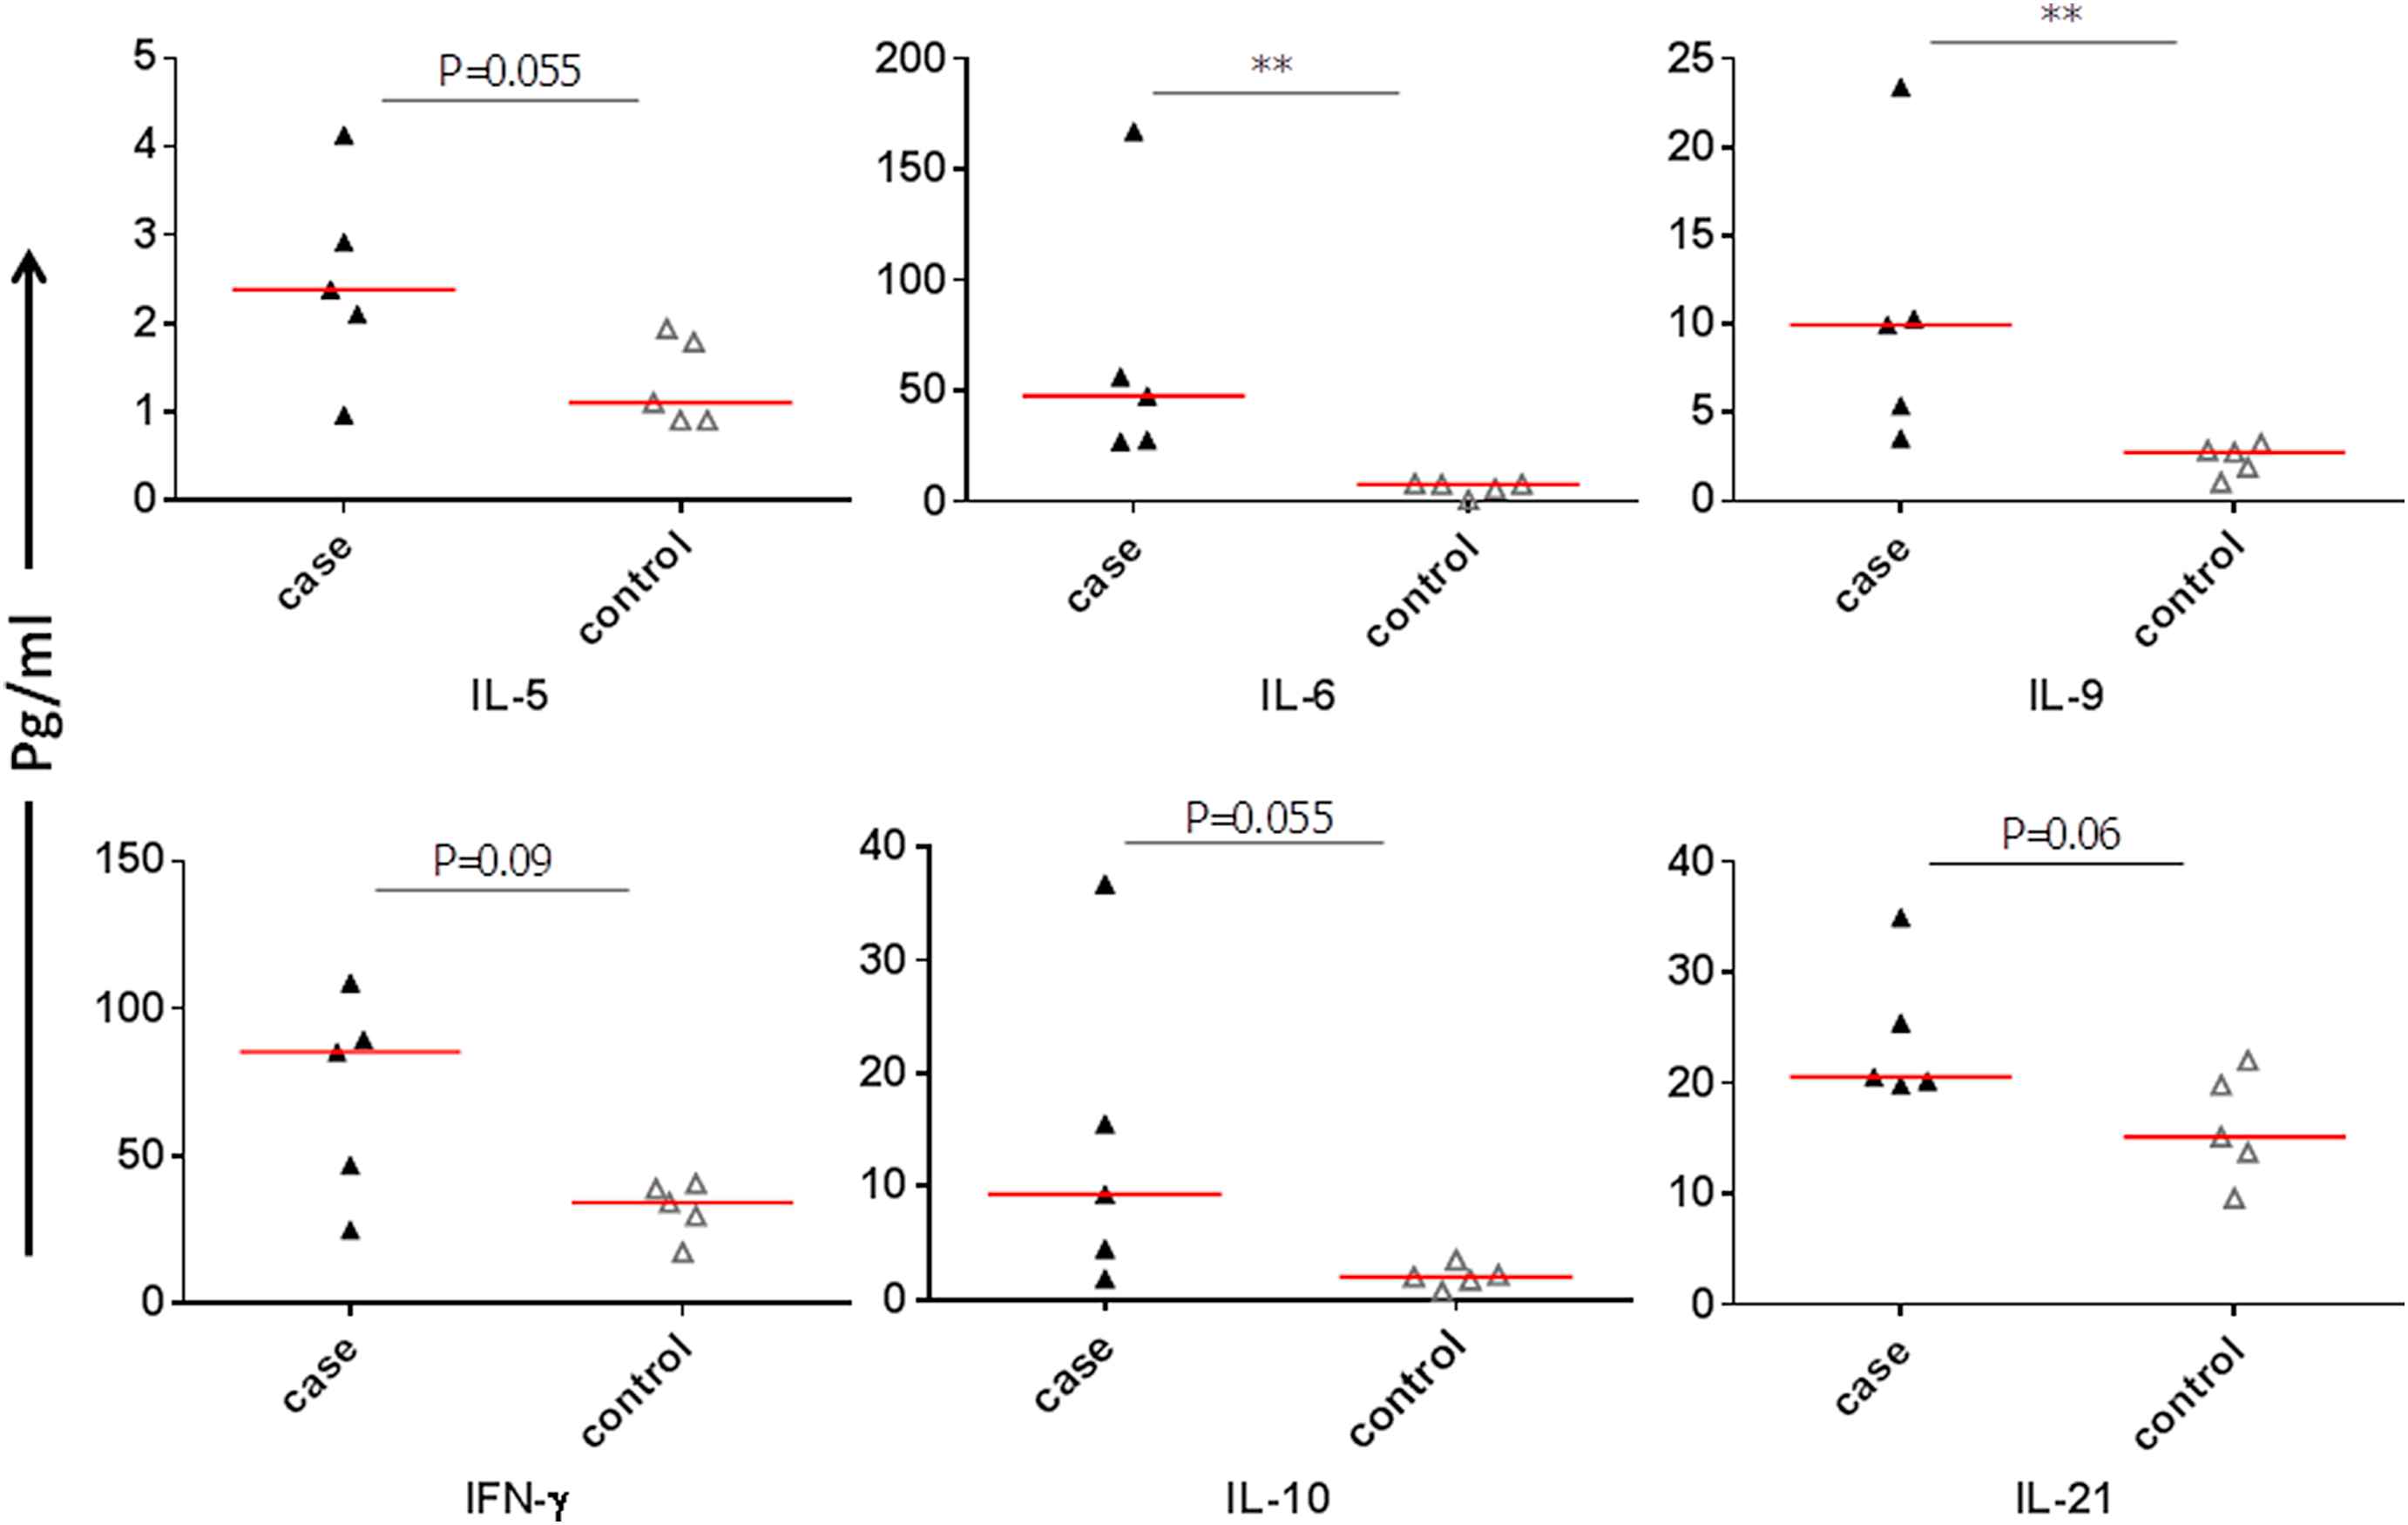
There was no significant difference in mean serum TNF-α level in patients compared to controls (P = 0.44). The mean serum IL-6 and IL-9 levels were significantly higher in patients than controls (P = 0.007 and P = 0.007, respectively; Fig. 1). The mean serum IL-10, IFN-γ, IL-5 and IL-21 levels in patients were marginally higher than controls (P = 0.055, P = 0.055, P = 0.09 and P = 0.06, respectively; Fig. 1). There were no significant differences in mean serum IL-2, IL-13, IL-4, IL-17A, IL-17F and IL-22 levels in patients compared to controls (P = 0.99, P = 0.22, P = 0.99, P = 0.28, P = 0.44, P = 0.84). The mean ± SD of each cytokine is shown in Table 2. One-Way Anova test confirmed that the differences between cases and controls regarding serum IL-9 (P = 0.048) and IFN-γ (P = 0.040) were significant and the differences in IL-6 and IL-21 did not reach the significant level (P = 0.053 and P = 0.056, respectively).
Comparison of individual serum cytokines between patients and controls.
| Cytokines | Case or control | Mean ± SD | P value |
|---|---|---|---|
| TNF-α | Case | 18.47 ± 21.18 | 0.047 |
| Control | 252.34 ± 293.64 | ||
| IL-6 | Case | 7693.84 ± 7602.24 | 0.80 |
| Control | 11,474.20 ± 6412.58 | ||
| IL-10 | Case | 374.91 ± 368.36 | 0.055 |
| Control | 1632.91 ± 1169.48 | ||
| IFN-γ | Case | 96.58 ± 161.63 | 0.08 |
| Control | 499.43 ± 773.79 | ||
| IL-2 | Case | 38.73 ± 56.89 | 0.047 |
| Control | 5.74 ± 2.89 | ||
| IL-13 | Case | 5.96 ± 2.81 | 0.30 |
| Control | 4.59 ± 2.26 | ||
| IL-5 | Case | 1.16 ± 0.36 | 0.99 |
| Control | 1.00 ± 0.00 | ||
| IL-9 | Case | 267.98 ± 273.84 | 0.13 |
| Control | 10,927.50 ± 9649.70 | ||
| IL-4 | Case | 1.00 ± 0.00 | 0.99 |
| Control | 1.00 ± 0.00 | ||
| IL-17A | Case | 16.66 ± 9.98 | 0.99 |
| Control | 14.62 ± 7.86 | ||
| IL-17F | Case | 4.70 ± 8.29 | 0.99 |
| Control | 1.00 ± 0.00 | ||
| IL-21 | Case | 10.84 ± 4.92 | 0.15 |
| Control | 17.27 ± 7.84 | ||
| IL-22 | Case | 50.50 ± 22.39 | 0.99 |
| Control | 50.20 ± 8.72 |
Significant of bold values indicate P < 0.05.
Level of cytokines produced by PBMCs in patients and controls.
Comparison of individual cytokines produced by PBMCs in the absence of antigenic stimulation between patients and controls
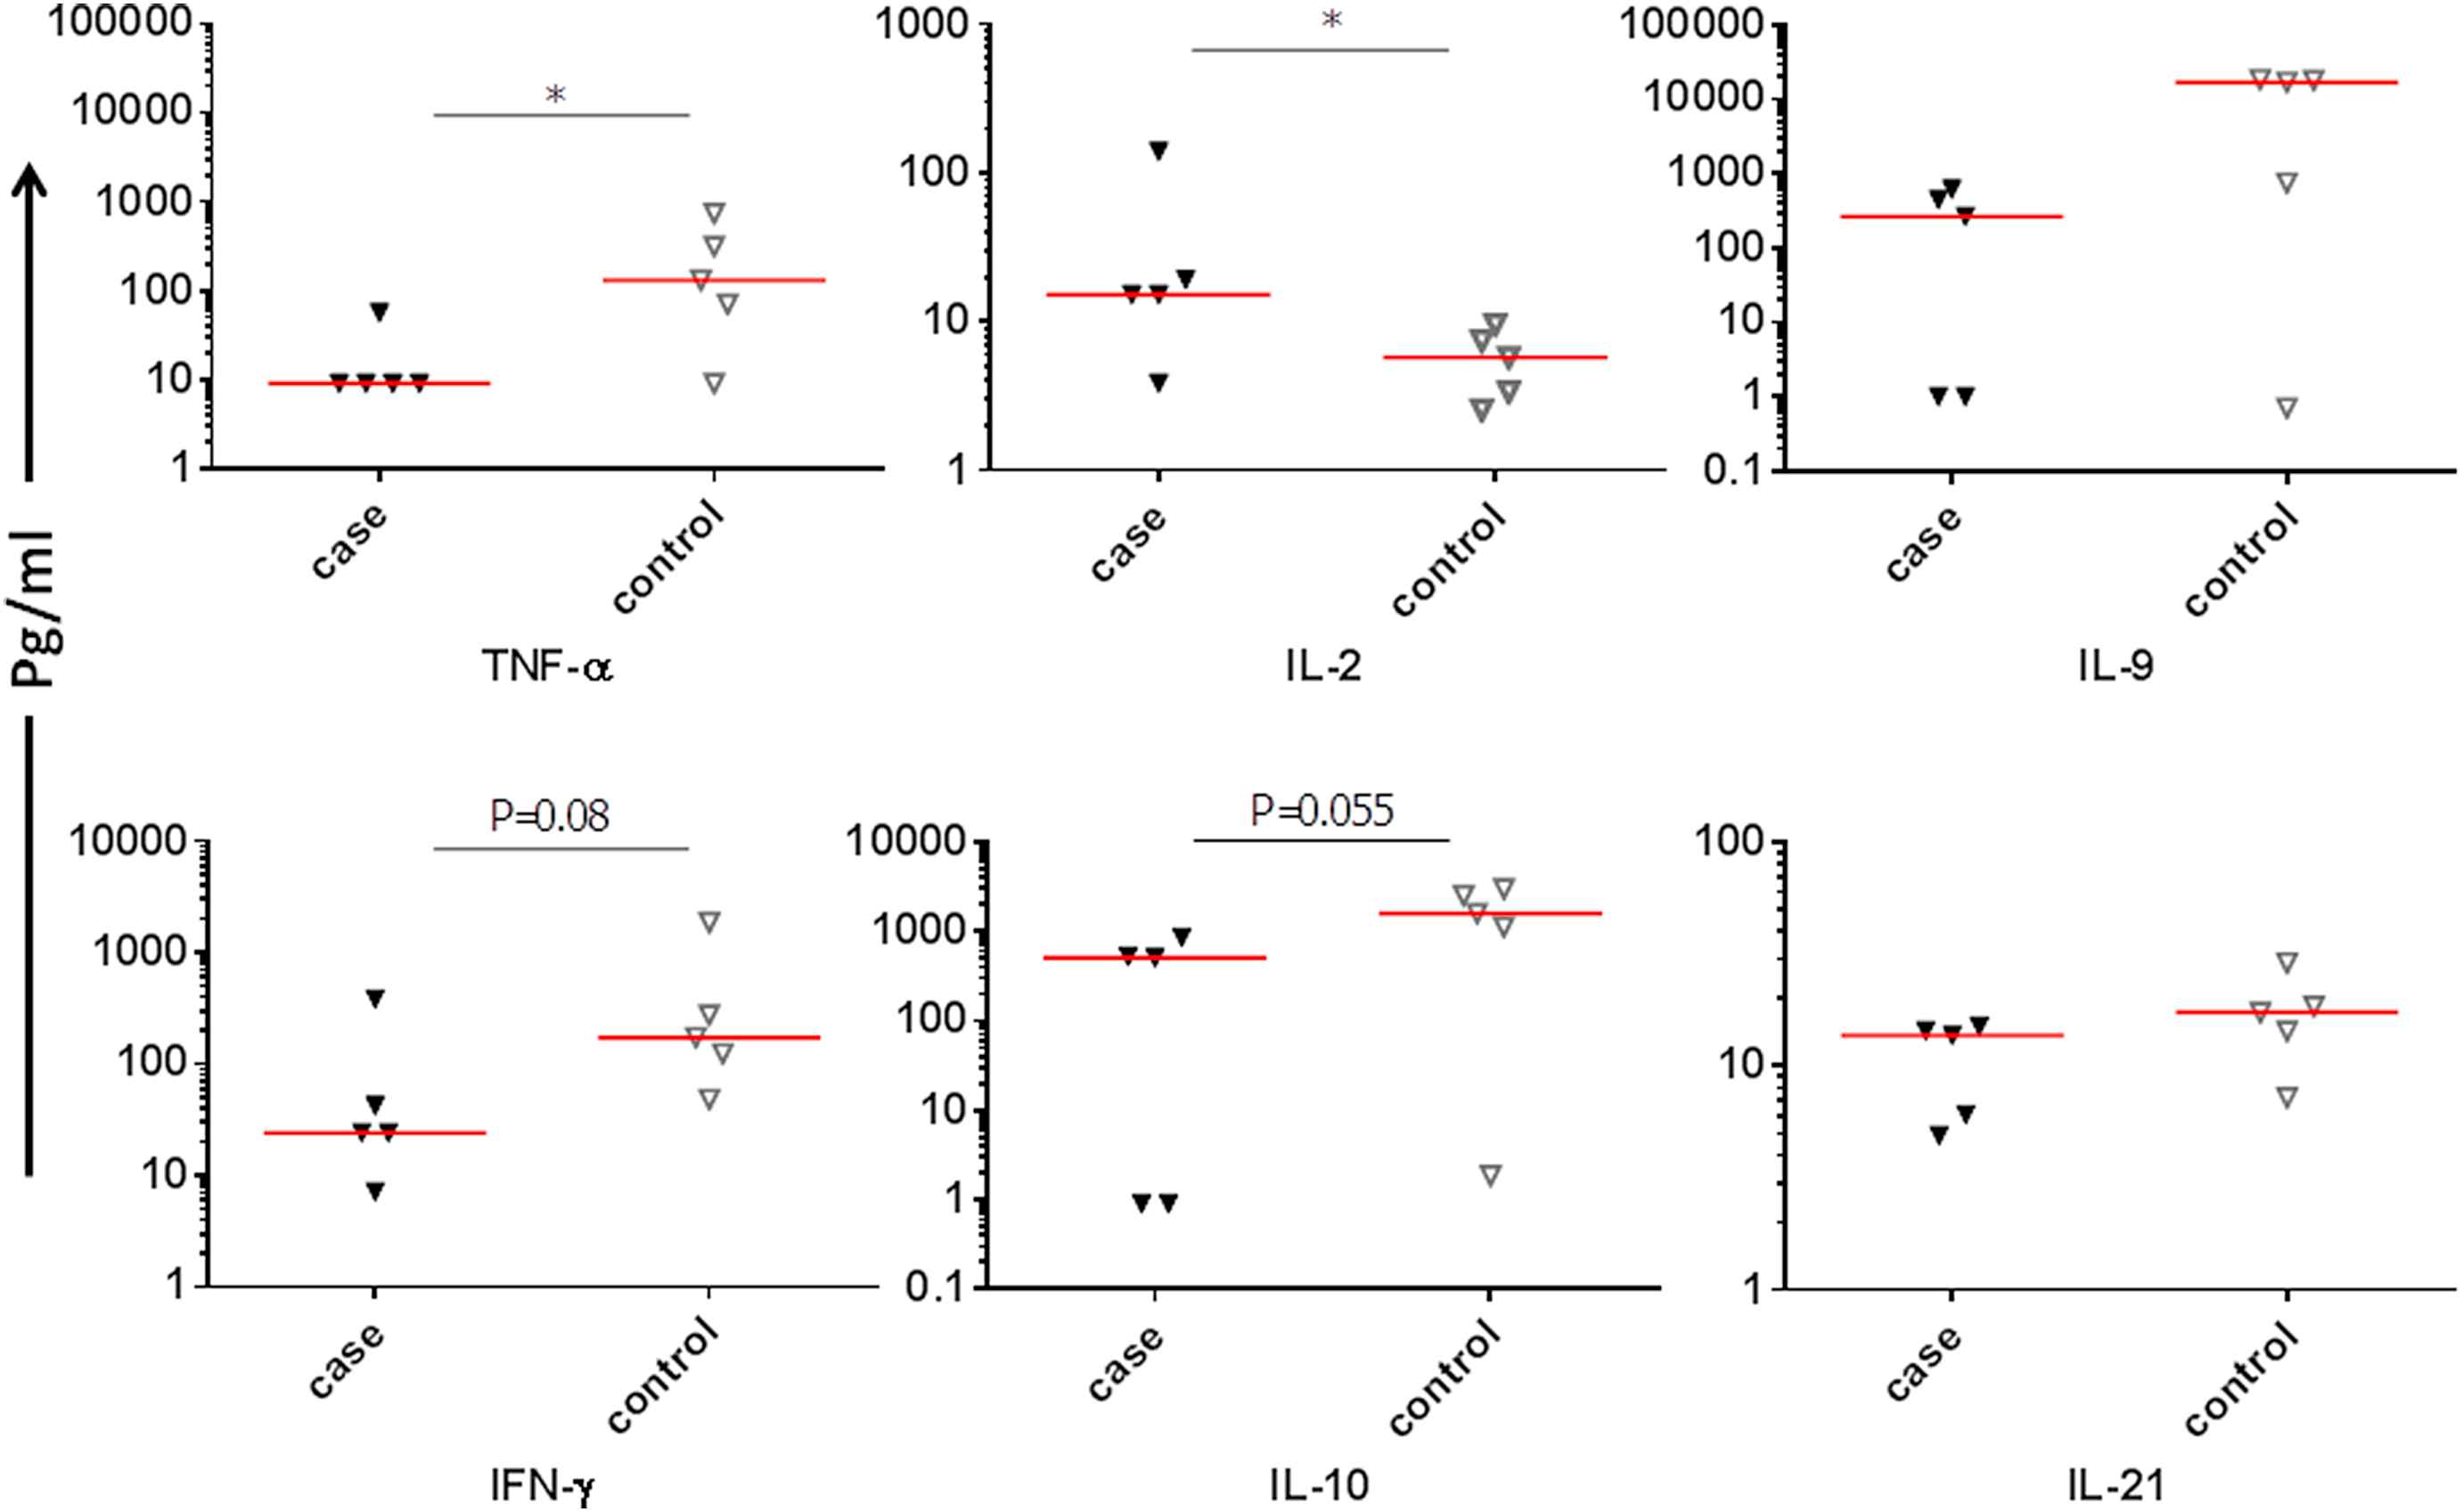
TNF-α production by PBMCs of patients was significantly lower than control group (P = 0.047). IL-2 production by PBMCs of patients was significantly higher than the control group (P = 0.047; Fig. 2). The production of IL-10 IFN-γ and IL-21 by patient PBMCs were non-significantly (P = 0.055, P = 0.08 and P = 0.15, respectively; Fig. 2) less than that of the control group. PBMCs from patients produced lower level of IL-9 while control PBMCs produced large amounts of IL-9 but the difference did not reach the significant level (P = 0.13). IL-6, IL-13, IL-5, IL-4, IL-17A, IL-17F and IL-22 production by PBMCs were not different between the two groups (P = 0.80, P = 0.30, P = 0.99, P = 0.99, P = 0.99, P = 0.99 and P = 0.99, respectively). The mean ± SD of each cytokine is shown in Table 3. Again One-Way Anova test confirmed that the difference between cases and controls regarding serum IL-9 (P = 0.039) was significant.
Comparison of individual cytokines produced by PBMCs from patients and controls.
| C1 | C2 | C3 | C4 | C5 | P1 | P2 | P3 | P4 | P5 | ||
|---|---|---|---|---|---|---|---|---|---|---|---|
| TNF-a | Serum | 10.26 | 6.80 | 3.00 | 3.00 | 3.00 | 3.00 | 3.00 | 3.00 | 3.00 | 4.55 |
| PBMC | 131.85 | 70.65 | 9.00 | 736.49 | 313.73 | 9.00 | 9.00 | 9.00 | 56.37 | 9.00 | |
| IL-6 | Serum | 7.92 | 1.00 | 8.33 | 7.92 | 5.98 | 47.84 | 167.17 | 27.31 | 56.53 | 27.92 |
| PBMC | 14,342.00 | 14,342.00 | 3.03 | 14,342.00 | 14,342.00 | 1.55 | 1.00 | 8113.92 | 15,756.00 | 14,596.74 | |
| IL-10 | Serum | 1.74 | 3.50 | 0.70 | 2.17 | 2.02 | 1.88 | 36.79 | 15.56 | 9.32 | 4.50 |
| PBMC | 1121.53 | 2973.30 | 1.86 | 2497.93 | 1569.93 | 0.90 | 0.90 | 501.51 | 849.77 | 521.51 | |
| IFN-g | Serum | 38.86 | 17.19 | 29.57 | 34.03 | 40.55 | 24.82 | 46.81 | 89.47 | 108.77 | 85.36 |
| PBMC | 275.45 | 124.65 | 48.34 | 1875.77 | 172.94 | 24.21 | 7.16 | 24.21 | 384.85 | 42.48 | |
| IL-2 | Serum | 13.47 | 12.26 | 11.48 | 13.88 | 4.91 | 9.59 | 13.47 | 29.04 | 4.32 | 12.66 |
| PBMC | 2.56 | 7.44 | 5.77 | 9.60 | 3.37 | 15.28 | 3.89 | 15.28 | 19.22 | 139.99 | |
| IL-4 | Serum | 1.00 | 1.00 | 1.00 | 1.00 | 1.00 | 1.00 | 1.00 | 2.28 | 1.00 | 1.00 |
| PBMC | 1.00 | 1.00 | 1.00 | 1.00 | 1.00 | 1.00 | 1.00 | 1.00 | 1.00 | 1.00 | |
| IL-5 | Serum | 1.10 | 0.90 | 1.94 | 0.90 | 1.79 | 2.10 | 0.96 | 4.13 | 2.38 | 2.92 |
| PBMC | 1.00 | 1.00 | 1.00 | 1.00 | 1.00 | 0.91 | 0.90 | 0.90 | 0.90 | 1.81 | |
| IL-9 | Serum | 1.95 | 3.26 | 1.08 | 2.79 | 2.88 | 3.57 | 23.40 | 9.96 | 10.32 | 5.41 |
| PBMC | 750.66 | 18,186.15 | 0.70 | 18,547.74 | 17,152.24 | 1.00 | 1.00 | 449.90 | 620.55 | 267.49 | |
| IL-13 | Serum | 4.10 | 3.99 | 2.33 | 4.88 | 2.04 | 1.31 | 5.35 | 7.58 | 5.59 | 4.66 |
| PBMC | 2.25 | 6.11 | 3.60 | 7.75 | 3.25 | 8.90 | 3.59 | 4.24 | 3.92 | 9.17 | |
| IL-17A | Serum | 32.92 | 23.22 | 29.40 | 34.99 | 29.40 | 19.22 | 30.39 | 54.89 | 35.51 | 51.25 |
| PBMC | 2.71 | 16.19 | 11.78 | 23.24 | 19.19 | 33.35 | 6.93 | 12.91 | 16.81 | 13.33 | |
| IL-17F | Serum | 1.00 | 1.00 | 1.00 | 1.00 | 1.00 | 1.00 | 1.00 | 1.32 | 2.25 | 1.00 |
| PBMC | 1.00 | 1.00 | 1.00 | 1.00 | 1.00 | 1.00 | 1.00 | 1.00 | 19.54 | 1.00 | |
| IL-21 | Serum | 22.08 | 9.66 | 15.18 | 19.86 | 13.78 | 20.59 | 19.86 | 34.97 | 20.22 | 25.47 |
| PBMC | 14.33 | 17.42 | 7.23 | 28.90 | 18.48 | 13.74 | 6.09 | 14.42 | 15.09 | 4.90 | |
| IL-22 | Serum | 45.73 | 42.04 | 20.40 | 39.57 | 22.41 | 38.95 | 30.81 | 40.81 | 52.47 | 37.09 |
| PBMC | 36.06 | 59.54 | 49.50 | 52.02 | 53.90 | 62.79 | 44.07 | 38.99 | 82.19 | 24.49 | |
Serum and PBMC produced cytokines (Pg/ml) in each patient and control individual.
Comparison of serum inflammatory, anti-inflammatory, Th1, Th2 and Th17 cytokines between AAA patients and controls
When cytokines were categorized based on their prototype function, the mean level of IL-6 plus TNF-α as inflammatory cytokines was significantly higher in AAA patients (68.66 ± 58.06 Pg/ml) than in control subjects (11.44 ± 4.03 Pg/ml, P = 0.007) (Fig. 3A).
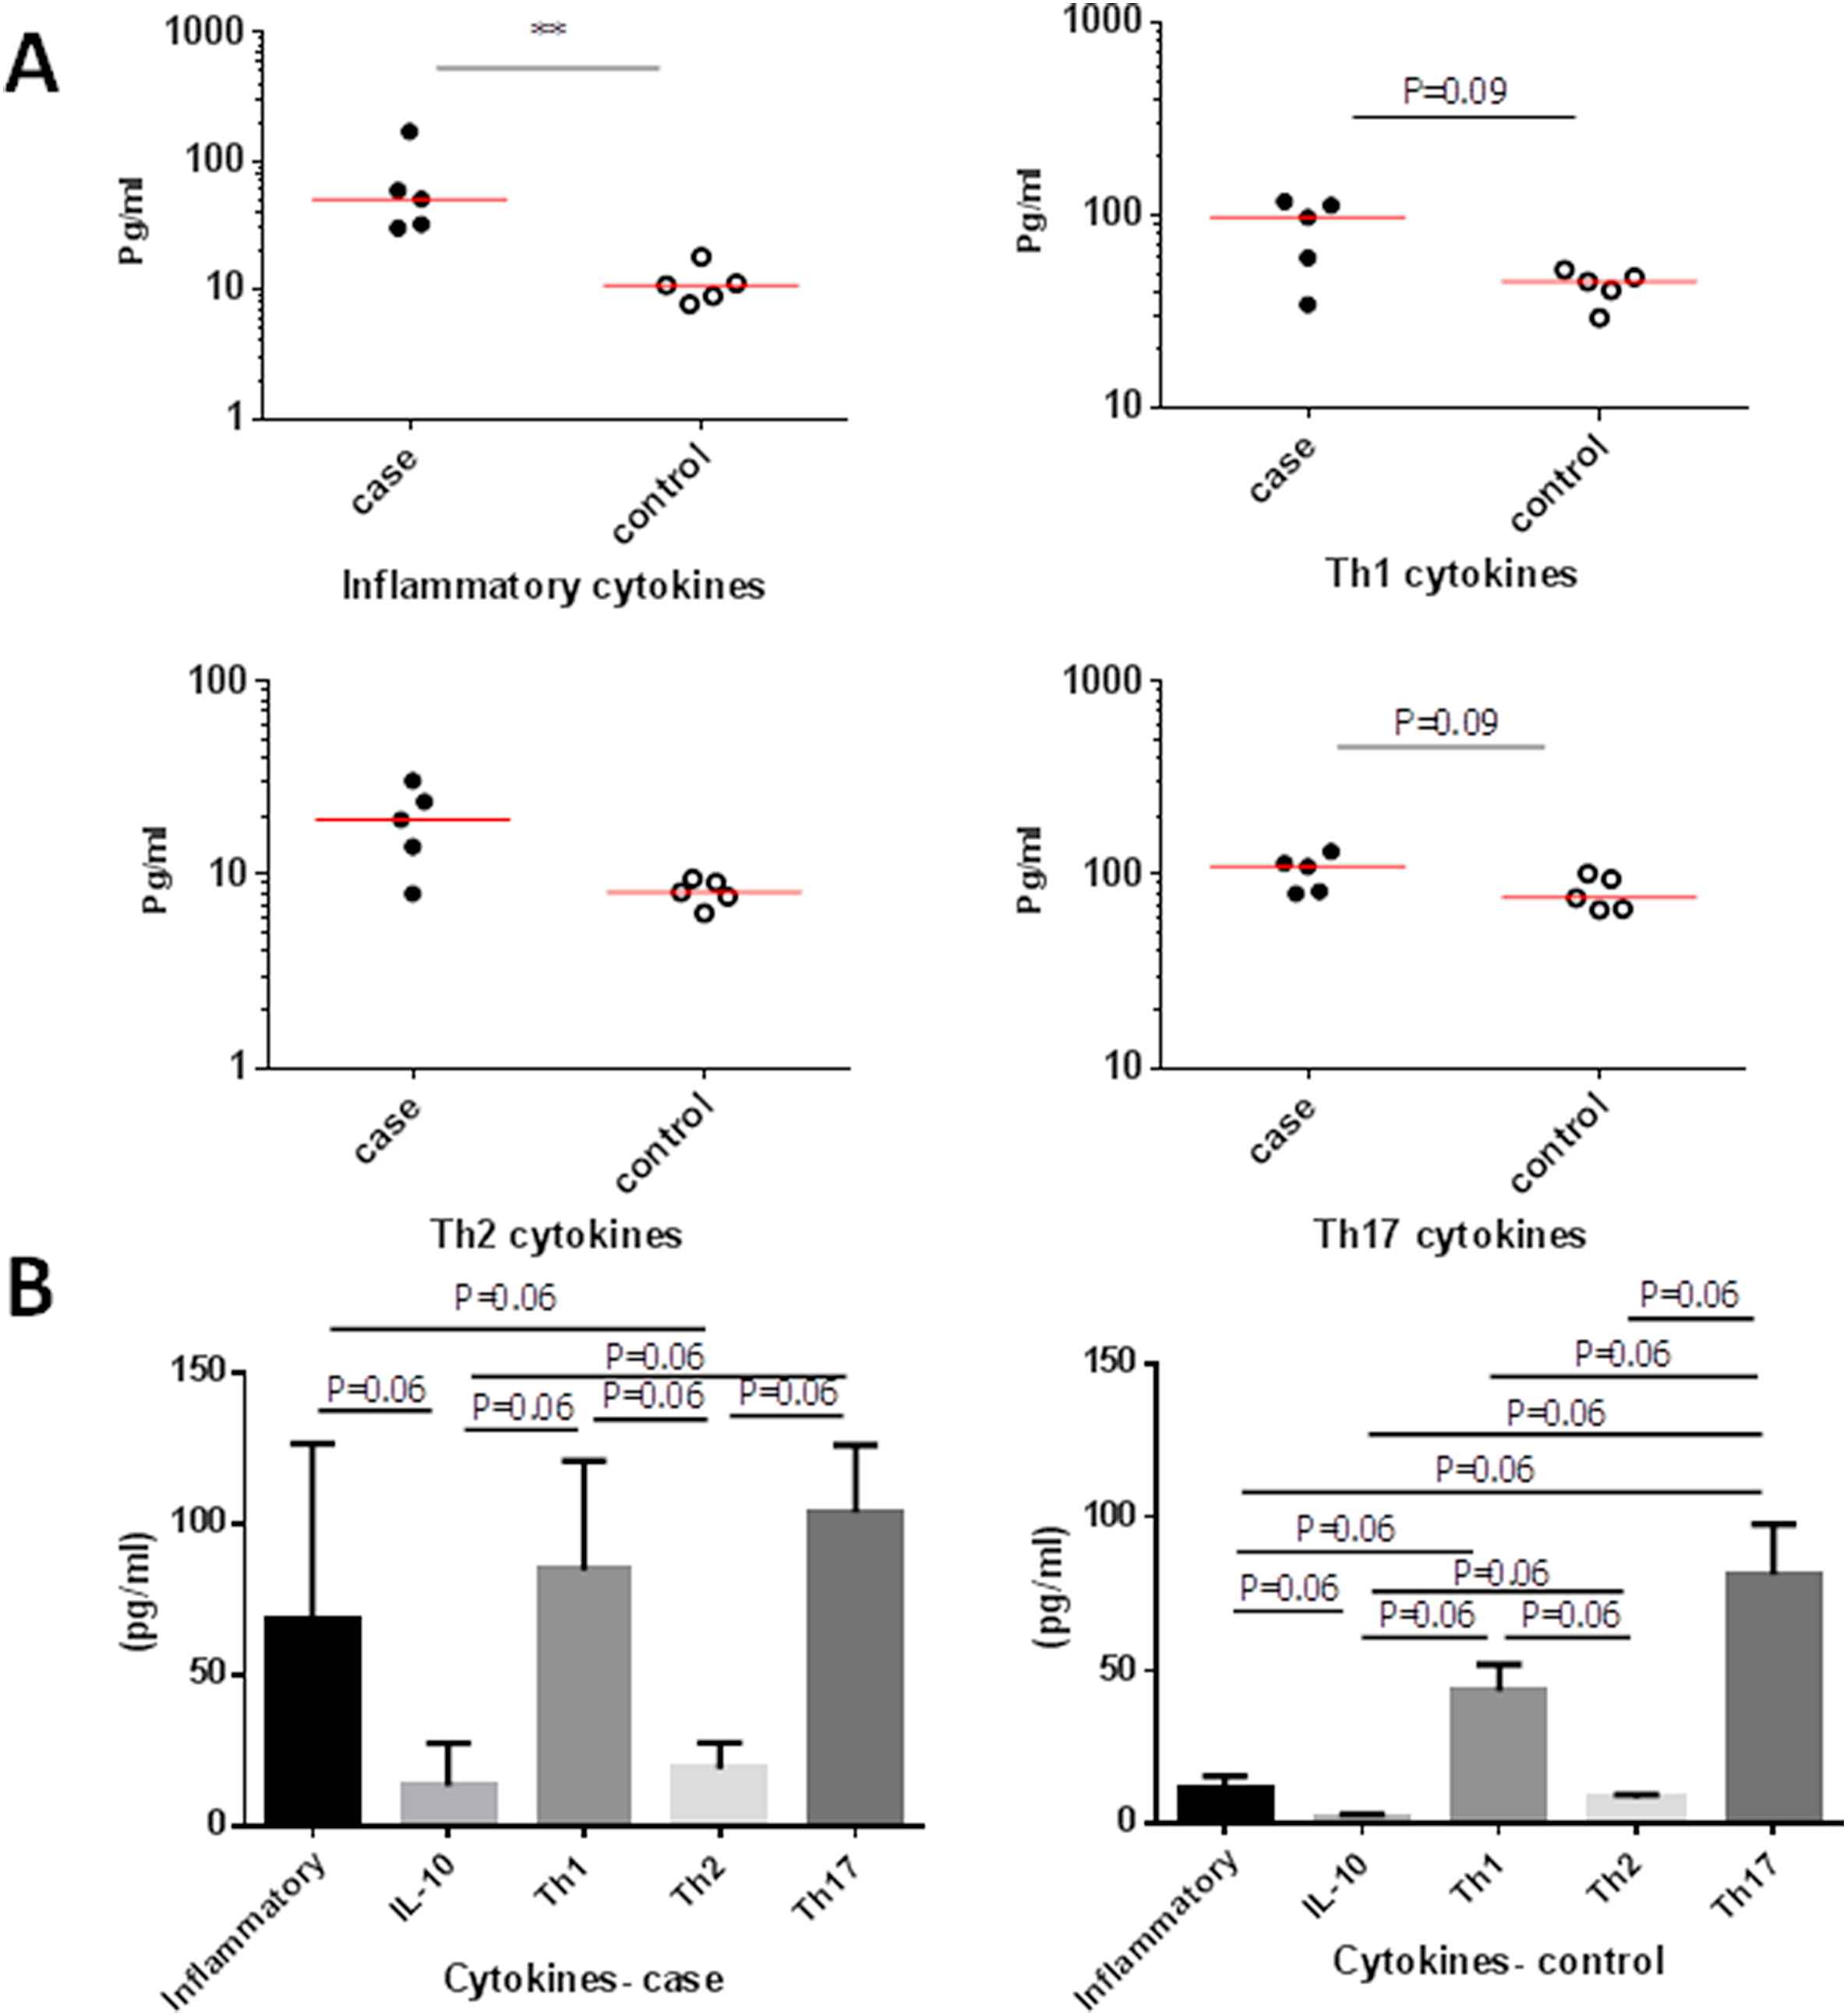
Comparison of serum inflammatory, anti-inflammatory, Th1, Th2 and Th17 cytokines between AAA patients and controls. (A) Comparison between cases and controls. (B) Comparison within cases and controls.
Difference in IL-10 mean level between patients (13.61 ± 13.91 Pg/ml) and controls (2.02 ± 1.00 Pg/ml, P = 0.055) was only marginally significant (Fig. 3A).
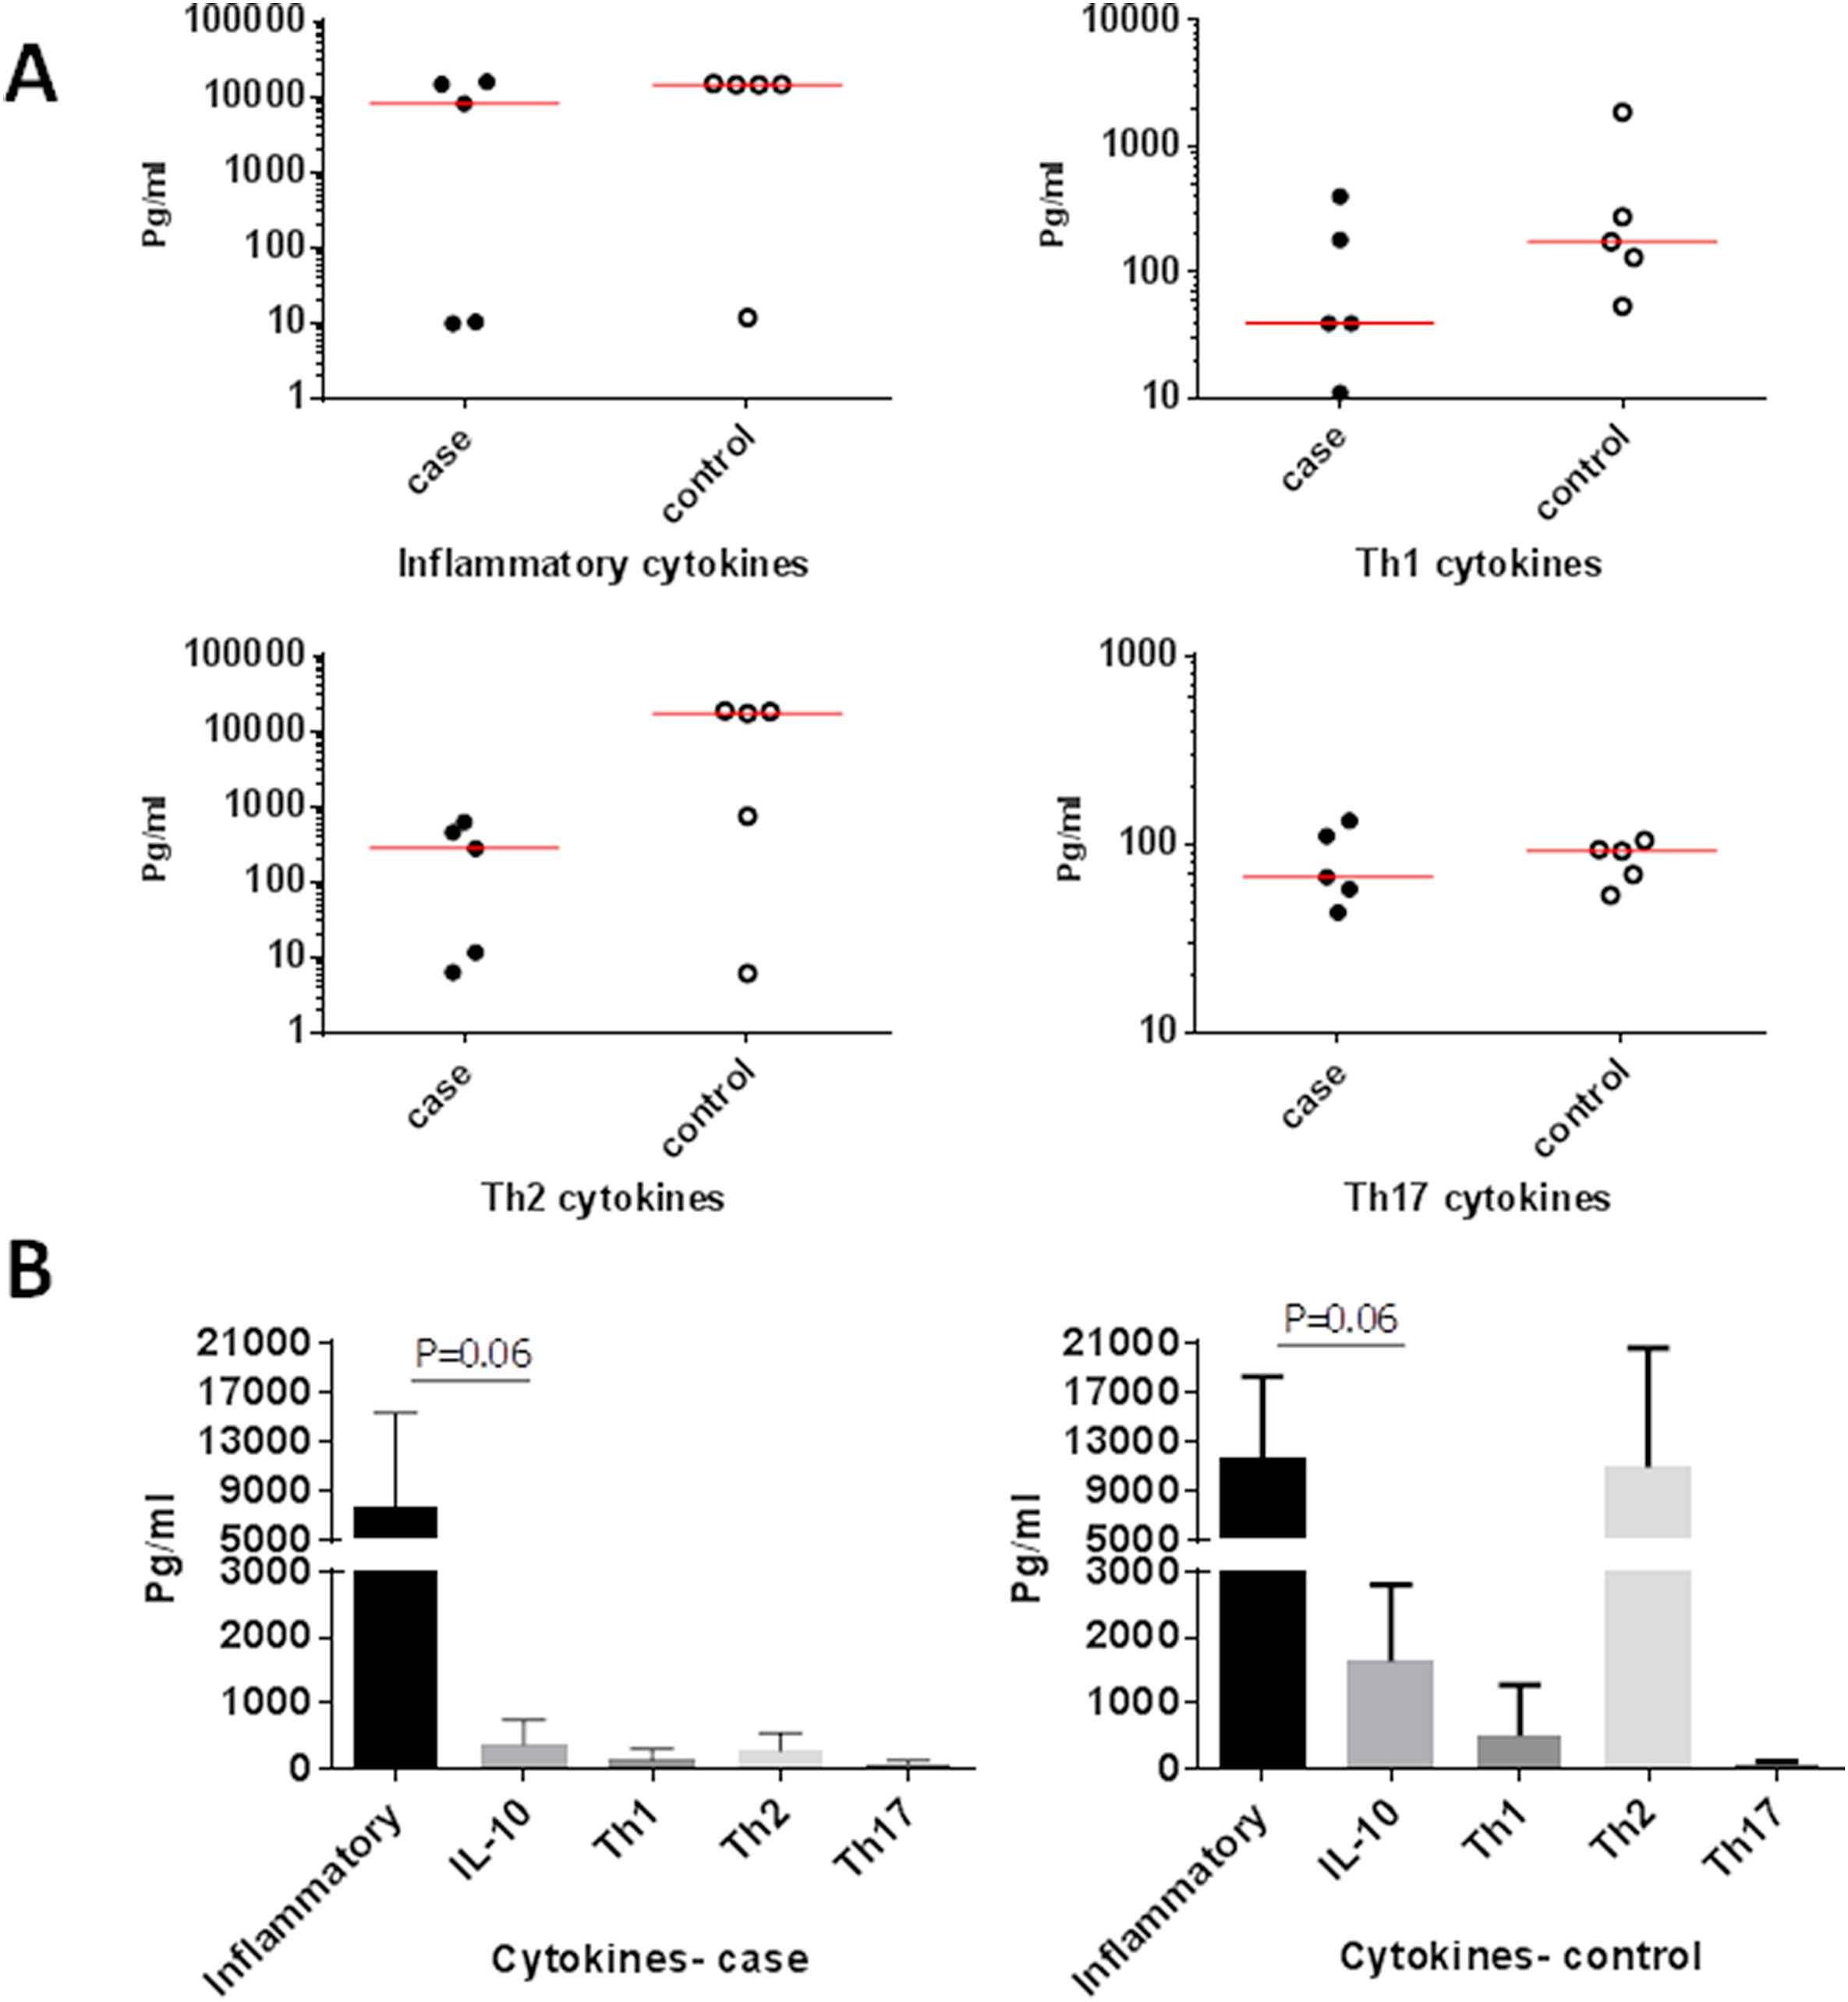
Comparison of the level of inflammatory, anti-inflammatory, Th1, Th2 and Th17 produced cytokines by PBMCs in each of the studied groups. (A) Comparison between cases and controls. (B) Comparison within cases and controls.
Despite the observed increase of total Th1 cytokines in patients, the mean IL-2 and IFN-γ, did not show significant difference between patients (84.86 ± 36.23 Pg/ml) and controls (43.24 ± 8.72 Pg/ml, P = 0.09) (Fig. 3A).
The difference between the mean total of Th2 cytokines including IL-4, IL-5, IL-9 and IL-13 in patients (19.18 ± 8.77 Pg/ml) and controls (8.18 ± 1.26 Pg/ml, P = 0.055) was also marginally significant (Fig. 3A).
In spite of the observed increase in the mean total of Th17 cytokines including IL-17A, IL-17F, IL-21 and IL-22 in patients, the differences between patients (103.80 ± 22.42 Pg/ml) and controls (81.13 ± 16.56 Pg/ml, P = 0.09) did not reach the significant level (Fig. 3A).
Comparison of inflammatory, anti-inflammatory, Th1, Th2 and Th17 levels of serum cytokines in each of the studied groups
The level of inflammatory cytokines (68.06 ± 58.66 Pg/ml) was higher than IL-10 (13.61 ± 13.96 Pg/ml, P = 0.06), less than Th1 cytokines (84.86 ± 36.23 Pg/ml, P = 0.81), more than Th2 cytokines (19.18 ± 8.77 Pg/ml, P = 0.06) and less than Th17 cytokines (103.81 ± 22.42 Pg/ml, P = 0.43) in patients group (Fig. 3B).
The level of IL-10 (13.61 ± 13.96 Pg/ml) was marginally lower than Th1 (84.86 ± 36.23 Pg/ml, P = 0.06), Th2 (19.18 ± 8.77 Pg/ml, P = 0.12) and Th17 cytokines (103.81 ± 22.42, P = 0.06) in patients group (Fig. 3B).
Th1 cytokines (84.86 ± 36.83 Pg/ml) were higher than Th2 (19.18 ± 8.77 Pg/ml, P = 0.06) and less than Th17 cytokines (103.81 ± 22.42 Pg/ml, P = 0.12). The level of Th2 cytokines (19.18 ± 8.77 Pg/ml) was lower than Th17 cytokines (103.81 ± 22.42 Pg/ml, P = 0.06) in patients group.
The level of inflammatory cytokines (11.44 ± 4.03 Pg/ml) was only marginally higher than that of IL-10 (2.02 ± 1.00 Pg/ml, P = 0.06), less than Th1 (43.24 ± 8.72 Pg/ml, P = 0.06), not different than Th2 (8.18 ± 1.26 Pg/ml, P = 0.18) and less than Th17 cytokines (81.12 ± 16.55 Pg/ml, P = 0.06) in controls group (Fig. 3B).
The level of IL-10 (2.02 ± 1.00 Pg/ml) was marginally lower than Th1 (43.24 ± 8.72 Pg/ml, P = 0.06), Th2 (8.18 ± 1.26 Pg/ml, P = 0.06) and Th17 cytokines (81.12 ± 16.55 Pg/ml, P = 0.06) in controls group.
Th1 cytokines (8.72 ± 43.24 Pg/ml) were higher than Th2 (8.18 ± 1.26 Pg/ml, P = 0.06) and less than Th17 cytokines (81.12 ± 16.55 Pg/ml, P = 0.06). The level of Th2 cytokines (8.18 ± 1.26 Pg/ml) was lower than that of Th17 cytokines (81.12 ± 16.55, Pg/ml, P = 0.06).
Comparison of inflammatory, anti-inflammatory, Th1, Th2 and Th17 cytokines produced by PBMCs between AAA patients and controls
The mean total level of IL-6 and TNF-α as inflammatory cytokines was non-significantly higher in controls (11,726.55 ± 6553.78 Pg/ml) than in AAA patients (7712.31 ± 7614.81 Pg/ml, P = 0.54) (Fig. 4A).
Difference in mean IL-10 level between patients (374.91 ± 368.36 Pg/ml) and controls (1632.91 ± 1169.47 Pg/ml, P = 0.055) was only marginally significant (Fig. 4A).
Despite the observed increase of total Th1 cytokines in patients, the mean IL-2 and IFN-γ did not show a significant difference between patients (135.31 ± 164.51 Pg/ml) and controls (505.17 ± 775.78 Pg/ml, P = 0.27) (Fig. 4A).
The difference between the mean total of Th2 cytokines including IL-4, IL-5, IL-9 and IL-13 inpatients (276.03 ± 272.77 Pg/ml) and controls (10,934.09 ± 9651.28 Pg/ml, P = 0.15) did not reach the significant level (Fig. 4A).
There was no difference in the mean total of Th17 cytokines including IL-17A, IL-17F, IL-21 and IL-22 between patients (82.72 ± 37.91 Pg/ml) and controls (83.09 ± 20.76 Pg/ml, P = 0.99) (Fig. 4A).
Comparison of the level of inflammatory, anti-inflammatory, Th1, Th2 and Th17 produced cytokines by PBMCs in each of the studied groups
The level of inflammatory cytokines (7714.31 ± 7614.81 Pg/ml) was marginally higher than IL-10 (374.91 ± 368.36 Pg/ml, P = 0.06), Th1 cytokines (135.31 ± 164.51 Pg/ml, P = 0.31), Th2 (276.03 ± 272.77 Pg/ml, P = 0.12) and Th17 cytokines (82.72 ± 37.91 Pg/ml, P = 0.31) in patients group but none of the differences reached the significant level (Fig. 4B).
The level of IL-10 (374.91 ± 368.36 Pg/ml) was not significantly different than Th1 (135.31 ± 164.51 Pg/ml, P = 0.31), Th2 (276.03 ± 272.77 Pg/ml, P = 0.31) and Th17 cytokines (37.71 ± 82.72 Pg/ml, P = 0.31) in patients group (Fig. 4B).
The level of Th1 cytokines (135.31 ± 164.51 Pg/ml) was not significantly different than Th2 (276.03 ± 272.77 Pg/ml, P = 0.31) and Th17 cytokines (82.72 ± 37.91 Pg/ml, P = 0.81). The level of Th2 cytokines (276.03 ± 272.77 Pg/ml) was not significantly different than Th17 cytokines (37.91 ± 82.72 Pg/ml, P = 0.31) in patients group (Fig. 4B).
The level of inflammatory cytokines (11,725.55 ± 6553.78 Pg/ml) was higher than IL-10 (1632.91 ± 1169.47 Pg/ml, P = 0.06), but not different than Th1 (505.17 ± 775.78 Pg/ml, P = 0.12), Th2 (10,934.09 ± 9651.28 Pg/ml, P = 0.81) and Th17 cytokines (83.09 ± 20.76 Pg/ml, P = 0.12) in controls group (Fig. 4B).
The level of IL-10 (1669.91 ± 1169.47 Pg/ml) was higher than that of Th1 cytokines (775.78 ± 505.17 Pg/ml, P = 0.12), less than Th2 (10,934.09 ± 9651.28 Pg/ml, P = 0.18) and Th17 cytokines (83.09 ± 20.76 Pg/ml, P = 0.12) in controls group but none of the differences reached the significant level (Fig. 4B).
Th1 cytokines levels (505.17 ± 775.78 Pg/ml) were lower than Th2 (10,934.09 ± 9651.28 Pg/ml, P = 0.12) and higher than Th17 cytokines (83.09 ± 20.76, Pg/ml, P = 0.12). The level of Th2 cytokines (10,934.09 ± 9651.28 Pg/ml) was greater than the Th17 cytokines (83.09 ± 20.76 Pg/ml, P = 0.12) in controls group but none of the differences reached the significant level (Fig. 4B).
Discussion
In the current study, contrary to blood, IFN-γ and IL-10 were found to be produced in higher levels by healthy PBMCs than that of patients. The higher concentrations of these cytokines in patients’ sera, therefore, show that the main sources of these cytokines are not peripheral blood mononuclear cells. In the case of IL-10, previous studies have shown that this cytokine is produced in large quantities in AAA.12 Interestingly, IL-10 also shows a significant increase in aneurysm within the tissue.30 Recruitment of neutrophils to the site of aneurysm and release of elastase from neutrophil granules stimulates the expression of IL-10 in the leukocytes.21 Our finding of higher IL-10 levels in the serum but not in PBMCs is in accordance with the possible role of neutrophils and other cells in the production of this cytokine in AAA. Considering the immunosuppressive role of IL-10 it has been suggested that rupture of aneurysm, in advanced disease stages, induces an inflammatory response followed by an IL-10 compensatory response.31
Based on previous reports, IFN-γ is greatly induced in atherosclerosis,30 and it increases the process of plaque formation and its size.32 The results of the various studies are contradictory, and some suggested that IFN-γ has a protective role in AAA.33 However, some studies have also shown an increase in IFN-γ expression in AAA lesions.34 The results of our study showed that IFN-γ levels in the sera of patients were more than controls, but control’s PBMCs produced more IFN-γ. Therefore, it seems that IFN-γ sources in patients were cells other than PBMCs. Based on previous reports35,36 endothelial and smooth muscle cells are alternative sources of these cytokines. Interestingly, the proinflammatory cytokine, TNF-α, was reduced both in patients’ sera and PBMCs. It is well established that TNF-α production at the onset of the endothelial injuries and atherosclerosis process induces macrophages and other leukocytes recruitment, thereby accelerating inflammation and activating MMPs.37 However, a defect in the ability of mononuclear cells to produce TNF-α in chronic inflammatory diseases in elder subjects is already suggested.38 Moreover, it is possible that the role of TNF-α at different stages of AAA is different.39 On a scale of AAA progression, our patients were in the advanced stages and therefore, it is possible that chronic stimulation of innate cells has reduced their potential in producing TNF-α and/or other factors have taken over in the disease inflammatory process.
We observed that patients’ PBMCs produced higher levels of IL-2 compared to controls while the level of this cytokine in the sera of both groups was somewhat similar. This finding is not surprising, as IL-2 is being known to exert its role in autocrine or paracrine manner. Moreover, our finding is in accordance with the results obtained in animal studies where treatment with IL-2 is shown to reduce the severity of AAA in angiotensin II mice models.40
In our study, serum IL-6 levels were higher in patients than controls; however, there was no significant difference in the production of this cytokine by PBMCs between the two groups. It is therefore logical to conclude that cellular sources other than PBMCs are involved in the production of IL-6 during AAA. It is known that aortic explants from AAA patients contribute to a large production of IL-6 and IFN-γ.41 A previous study has also shown the aortic production of IL-6 and recruitment of monocyte to the aortic dissections of AngII C57BL/6J mice by tunica adventitia cells.42 The recruitment of monocytes and their differentiation to macrophages as well as their interaction with fibroblasts in tunica adventitia creates a milieu of inflammatory cytokines and chemokines which are directly involved in vascular inflammation, ECM remodeling, and aortic destabilization.42
IL-6 is a multifunctional inflammatory cytokine which stimulates the production of acute phase reactants from liver cells, activates endothelial cells, increases coagulation, and proliferation and differentiation of lymphocytes, and contributes to the development of atherosclerosis.43 In addition, IL-6 can play a role in the differentiation of Th17 cells and therefore contribute to the pathogenicity of AAA.44 A recent study on IgG4-associated aortic aneurysms showed that IL-6 and CD34 at the level of mRNA were expressed together, resulting in IL-6 being produced by endothelial and mesenchymal cells in the adventitia layer.45
Another cytokine that was increased in the sera of patients was IL-5. This finding is consistent with findings of another study which showed high levels of IL-5 in AAA disease.21 On the other hand, some studies have shown that IL-5 may play a protective role in atherosclerosis through induction of natural antibodies. Natural antibodies bind to oxidized phospholipids and phospholipoproteins, thereby preventing oxLDL absorption by macrophages.46
A remarkable finding of our study was the production of IL-9 in the sera of patients. This was opposed to the huge production of IL-9 by control’s PBMCs. This was accompanied by the great deviation of PBMCs from control individuals towards Th2 subtype. Therefore, we suggest that the source(s) of serum IL-9 are cells other than PBMCs. Therefore, our results can be an indication of the role cells other than Th2 may play in the pathogenesis of AAA. Currently, it is known that mast cells, eosinophils, innate lymphoid cells (ILCs) and NKT cells produce IL-9.47 In previous studies, it is shown that IL-9 increases the expression of VCAM-1 by endothelial cells of the mouse aorta, thereby increasing recruitment and infiltration of inflammatory cells to atherosclerotic lesions which exacerbates atherosclerosis.48 It is also shown that the fibroblast in the AAA lesion upregulate the expression of IL-9 receptor.49 In addition, it has been shown that IL-9 induces inflammatory responses and is involved in the induction of Th17 differentiation and enhancing the function of natural Tregs.50
In contrast to the study by Liao et al. that found reduced cytokines in AAA patients,51 our study showed an elevation of several cytokines from all families of cytokine subsets including inflammatory, Th1, Th2 and Th17 types of cytokines in the sera of patients with AAA. This cytokine storm was not a sole result of peripheral blood mononuclear cells activation and other cellular sources can and may be involved in their production as suggested by our results on the PBMCs cytokine production. It is however necessary to point out that our study is only a preliminary work, which describes new findings to be investigated more thoroughly in larger sample sizes. The limitations of our study were limited sample size and inclusion of patients with dilation of aorta more than 5.5 cm, which should be considered in the following approaches.
Conflict of interest statement
The authors have no conflict of interest.
Acknowledgements
This work was performed as a part of Hamid Aria dissertation as a requirement for graduation as a M.Sc. of Immunology from
Appendix A
Supplementary data
Supplementary data related to this article can be found at
References
Cite this article
TY  - JOUR
AU  - Hamid Aria
AU  - Mehdi Kalani
AU  - Hossein Hodjati
AU  - Mehrnoosh Doroudchi
PY  - 2018
DA  - 2018/01/11
TI  - Elevated levels of IL-6 and IL-9 in the sera of patients with AAA do not correspond to their production by peripheral blood mononuclear cells
JO  - Artery Research
SP  - 43
EP  - 52
VL  - 21
IS  - C
SN  - 1876-4401
UR  - https://doi.org/10.1016/j.artres.2017.12.007
DO  - 10.1016/j.artres.2017.12.007
ID  - Aria2018
ER  -