
Flow-mediated slowing of brachial-radial pulse wave velocity: Methodological aspects and clinical determinants
- DOI
- 10.1016/j.artres.2017.12.001How to use a DOI?
- Keywords
- General population; Endothelial function; Flow-mediated slowing; Pulse wave velocity
- Abstract
Background: Recent studies proposed that deceleration in pulse wave velocity (PWV) following reactive hyperaemia might reflect arterial distensibility and endothelial function. We therefore investigated methodological aspects and clinical determinants of new indexes of flow-mediated slowing (FMS) of PWV in a community-based sample.
Methods: In 71 subjects (mean age, 60.3 years; 50.7% women), we continuously assessed brachial-radial PWV using Vicorder® at baseline and after 3-min or 5-min suprasystolic upper-arm cuff occlusion. We calculated the relative change (Δ) in PWV per each 30 s intervals during 4 min of post-occlusion. We performed stepwise regression analyses to assess determinants of the PWV response.
Results: The peak FMS was detected at the first PWV recording obtained after occlusion. Overall, the decline in PWV during hyperaemia was significantly greater after 5-min of occlusion as compared to 3-min (effect sizes for 0–240 s intervals: −1.83% to −9.63%; P ≤ 0.037). PWV declined significantly less with higher age during the 0–60 s post-occlusion intervals (P ≤ 0.0053). On the other hand, after 120 s of post-occlusion, ΔPWV remained significantly lower in subjects with high diastolic blood pressure and oxidized LDL, and in smokers (P ≤ 0.028). Consequently, as compared to healthy reference group, participants with cardiovascular risk factors exhibited a delay in age-adjusted recovery of PWV after 5-min of occlusion (P ≤ 0.039).
Conclusions: Our findings confirm the use of a 5-min occlusion time for the assessment of vasomotor function by FMS. Whereas the early FMS response might deteriorate with ageing, cardiovascular risk factors such as smoking, oxidative stress and hypertension might affect recovery of PWV after reactive hyperaemia.
- Copyright
- © 2017 Association for Research into Arterial Structure and Physiology. Published by Elsevier B.V. All rights reserved.
- Open Access
- This is an open access article distributed under the CC BY-NC license.
Introduction
The vascular endothelium regulates key processes involving platelet function, inflammation, smooth muscle cell proliferation and vascular tone.1 Endothelial dysfunction, characterized by reduced nitric oxide (NO) bioavailability, contributes to the progression of cardiovascular diseases such as atherosclerosis and hypertension.2,3
The vasodilatory response to increased shear stress during reactive hyperaemia following a brief period of ischaemia is partly triggered by endothelium-dependent release of NO.4 This adaptation in vascular tone could be non-invasively assessed by the flow-mediated dilation (FMD) of large arteries,5,6 or by the changes in digital pulse wave amplitude.4,7–10
Another novel approach to assess the conduit artery vasomotor function is based on changes in brachial-radial pulse wave velocity (PWV) during reactive hyperaemia.11,12 The observed decline in PWV during the vasodilation after ischaemia might be used as a marker of arterial distensibility and endothelial function.11,12 Indeed, PWV is inversely related to arterial distensibility13,14 and reflects in some degree dynamic changes in vascular tone.15 Moreover, the assessment of such flow-mediated slowing (FMS) of PWV has emerged as a user-friendly and reproducible alternative to measurement of FMD.12 The automated FMS measurement protocol requires little training and logistics, favouring its use in large-scale population studies and screening programs.
To date, however, no study assessed the correlates of the newly proposed FMS index. Therefore, we investigated in a random community-based sample to what extent methodological aspects of FMS measurement and clinical characteristics might affect the temporal decline in brachial-radial PWV following reactive hyperaemia.
Materials and methods
Study participants
From August 1985 until December 2005, we randomly recruited a family-based population sample stratified by sex and age from a geographically defined area in northern Belgium, as described previously.10 The initial participation rate was 78.0%. The Flemish Study on Environment, Genes and Health Outcomes (FLEMENGHO) study is an ongoing population study, in which participants are repeatedly examined at a local examination centre.
From February 2016 until January 2017, a scheduled follow-up examination at the field centre included assessment of endothelial function using an automated FMS protocol.12 From 93 invited participants, we obtained informed written consent from 82 subjects (response rate 88.2%). Of these, 6 subjects did not undergo the FMS protocol because of advanced age (>80 years). We also excluded 4 participants with frequent extrasystoles (n = 3) or a pacemaker (n = 1). Furthermore, we discarded one recording of insufficient quality to reliably assess the FMS index. In total, 71 participants were statistically analysed.
FMS protocol
The participants refrained from smoking, heavy exercise, and drinking alcohol or caffeine-containing beverages for at least 3 hours before the test. We studied FMS in an air-conditioned room at constant temperature around 22 °C. To attain a cardiovascular steady-state before starting the test, the subjects had rested for at least 20 min in the supine position.
We implemented an automated FMS protocol using the Vicorder® device (Skidmore Medical, Bristol, UK) (Fig. 1). Participants were lying with their left arm positioned 70–80° to their body. Two oscillometric cuffs connected to the Vicorder® were placed around the upper arm and wrist. We measured the brachial-radial distance (D) as the distance between the midst of both cuffs. Next, subjects underwent an FMS procedure that included a baseline period of 3 min, an occlusion period of 3 min or 5 min in which the brachial cuff was inflated to 200 mm Hg, and a 4 min post-occlusion period. During pre- and post-occlusion periods, both cuffs were inflated mildly (≤65 mm Hg) to simultaneously record brachial and radial pulse wave tracings. The onset-time of upstroke was derived from both the brachial (tbrachial) and radial pulse tracings (tradial) in real-time. The brachial-radial PWV was calculated from these tracing every 3–4 s during the baseline and post-occlusion period as the brachial-radial distance divided by the transit time ΔT (PWV = D/[tradial − tbrachial] = D/ΔT).
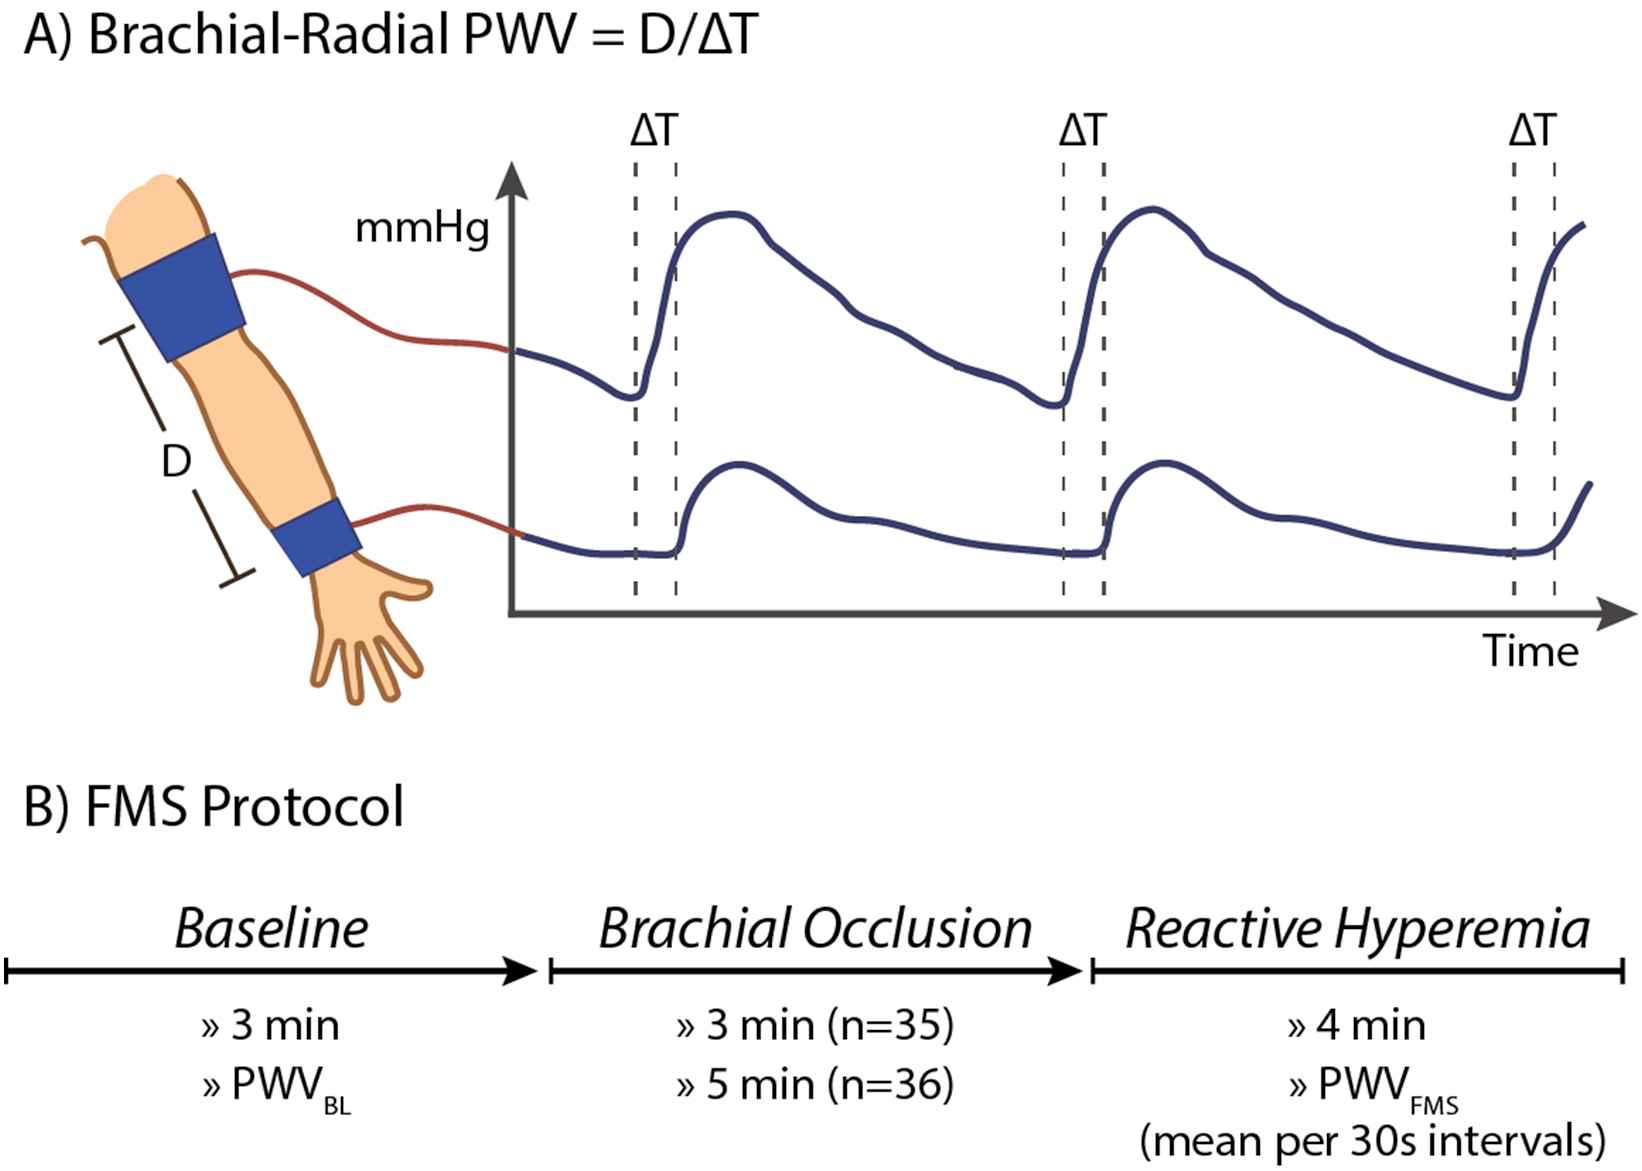
Automated assessment of flow-mediated slowing following reactive hyperaemia. (A) Mild inflation of brachial and radial cuff allow real-time recording of brachial-radial pulse wave velocity. (B) The FMS response equals the relative changes in pulse wave velocity following hyperaemia as induced by suprasystolic brachial occlusion. The FMS response was monitored for 4 min after 3-min or 5-min of occlusion. BL indicates baseline; D, brachial-radial distance; ΔT, time difference between brachial and radial pulse upstroke; FMS, flow-mediated slowing; PWV, pulse wave velocity.
We calculated the mean baseline PWV (PWVBL) and mean post-occlusion PWV for each 30 s interval starting from the first measurement after occlusion (recorded about 15 s after brachial cuff release). We calculated FMS as the relative change (Δ) in PWV following hyperaemia (e.g. FMS0–30 = [PWV0–30 − PWVBL]/PWVBL × 100%).
Other measurements
Trained study nurses administered a standardized questionnaire to collect detailed information on the participant’s medical history, smoking and drinking habits. Hypertension was defined as a blood pressure (BP) of at least 140 mm Hg systolic or 90 mm Hg diastolic (average of 5 consecutive auscultatory readings at the examination centre) or the use of antihypertensive drugs. Body mass index was weight in kilograms divided by the square of height in meters.
Statistical analysis
For database management and statistical analysis, we used SAS software, version 9.4 (SAS Institute, Cary, North Carolina, USA). Normality of distributions was evaluated by Shapiro–Wilk’s and skewness statistics. We compared means and proportions by a sample t-test and chi-square test, respectively. Statistical significance was a two-sided significance level of P < 0.05.
We performed forward stepwise regression to assess the determinants of FMS during each 30 s post-occlusion interval. Covariables considered in the stepwise models were age, occlusion time, heart rate, sex, current smoking, body mass index, systolic BP, diastolic BP, mean arterial pressure, pulse pressure, antihypertensive and lipid-lowering drug treatment, history of diabetes mellitus, triglycerides, total cholesterol, high-density (HDL) and low-density lipoprotein (LDL) and oxidized LDL. We set the P values for variables to enter and to stay in the stepwise multiple regression models at 0.10, but considered a two-sided P value below 0.05 as statistically significant. We assessed the interaction of the FMS response throughout post-occlusion periods with the occlusion time, sex and age groups as implemented in PROC GLM.
Results
Clinical characteristics of participants
The 71 participants included 36 (50.7%) women. Of the 44 (62.0%) hypertensive subjects, 25 (56.8%) were on antihypertensive drug treatment. Table 1 lists the clinical characteristics of the study participants by sex and occlusion time. Compared to women, men had on average higher body mass index, diastolic BP and mean arterial pressure (P ≤ 0.042), but lower heart rate, total cholesterol and HDL (P ≤ 0.018). The prevalence of hypertension was significantly higher in men than in women (P = 0.0020). Clinical characteristics did not differ between subjects who underwent either 3-min or 5-min of upper-arm occlusion (P ≥ 0.089 for all; Table 1).
| Characteristics | Gender | Occlusion Time | ||||
|---|---|---|---|---|---|---|
| Men (n = 35) | Women (n = 36) | P value | 3 min (n = 35) | 5 min (n = 36) | P value | |
| Anthropometrics | ||||||
| Age, y | 60.2 ± 15.3 | 60.3 ± 12.1 | 0.97 | 59.0 ± 13.4 | 61.5 ± 14.0 | 0.45 |
| Female, n (%) | – | – | – | 18 (51.4) | 18 (50.0) | 0.90 |
| Body mass index, kg/m2 | 28.4 ± 3.93 | 26.3 ± 4.58 | 0.042 | 27.5 ± 4.15 | 27.2 ± 4.63 | 0.77 |
| Systolic BP, mm Hg | 133.2 ± 10.6 | 129.9 ± 16.7 | 0.33 | 133.0 ± 11.9 | 130.1 ± 15.9 | 0.39 |
| Diastolic BP, mm Hg | 87.6 ± 9.55 | 80.4 ± 8.22 | 0.0011 | 85.9 ± 9.45 | 82.1 ± 9.38 | 0.089 |
| Pulse pressure, mm Hg | 45.5 ± 10.6 | 49.4 ± 13.0 | 0.17 | 47.0 ± 7.89 | 48.0 ± 15.0 | 0.74 |
| MAP, mm Hg | 102.8 ± 8.57 | 96.9 ± 10.0 | 0.010 | 101.6 ± 9.65 | 98.1 ± 9.63 | 0.13 |
| Heart rate, bpm | 60.8 ± 6.80 | 65.2 ± 8.42 | 0.018 | 63.0 ± 7.13 | 63.1 ± 8.74 | 0.96 |
| Questionnaire data | ||||||
| Current smoking, n (%) | 3 (8.6) | 7 (19.4) | 0.19 | 3 (8.6) | 7 (19.4) | 0.19 |
| Drinking alcohol, n (%) | 11 (31.4) | 8 (22.2) | 0.38 | 7 (20.0) | 12 (33.3) | 0.20 |
| Hypertensive, n (%) | 28 (80.0) | 16 (44.4) | 0.0020 | 21 (60.0) | 23 (63.9) | 0.74 |
| Treated for hypertension, n (%) | 16 (45.7) | 9 (25.0) | 0.068 | 10 (28.6) | 15 (41.7) | 0.25 |
| β-blockers, n (%) | 5 (14.3) | 3 (8.3) | 0.43 | 4 (11.4) | 4 (11.1) | 0.97 |
| ACE, n (%) | 5 (14.3) | 4 (11.1) | 0.69 | 4 (11.4) | 5 (13.9) | 0.76 |
| ARB, n (%) | 4 (11.4) | 0 (0.0) | 0.037 | 3 (8.6) | 1 (2.8) | 0.29 |
| CCB, n (%) | 6 (17.1) | 1 (2.8) | 0.042 | 3 (8.6) | 4 (11.1) | 0.72 |
| Diuretics, n (%) | 8 (22.9) | 4 (11.1) | 0.19 | 5 (14.3) | 7 (19.4) | 0.56 |
| Lipid-lowering drugs | 12 (34.3) | 9 (25.0) | 0.39 | 8 (22.9) | 13 (36.1) | 0.22 |
| History of CHD | 2 (5.71) | 0 (0.0) | 0.15 | 1 (2.86) | 1 (2.78) | 0.98 |
| History of diabetes | 5 (14.3) | 5 (13.9) | 0.96 | 6 (17.1) | 4 (11.1) | 0.47 |
| Biochemical data | ||||||
| Triglycerides, mmol/L | 1.85 ± 0.86 | 1.48 ± 0.64 | 0.051 | 1.70 ± 0.80 | 1.61 ± 0.75 | 0.63 |
| Total cholesterol, mmol/L | 4.52 ± 0.89 | 5.28 ± 1.12 | 0.0027 | 5.02 ± 1.23 | 4.80 ± 0.91 | 0.42 |
| HDL, mmol/L | 1.31 ± 0.34 | 1.78 ± 0.45 | <0.0001 | 1.45 ± 0.41 | 1.66 ± 0.49 | 0.066 |
| LDL, mmol/L | 2.58 ± 0.75 | 3.00 ± 1.08 | 0.066 | 2.99 ± 1.08 | 2.60 ± 0.77 | 0.092 |
| Oxidized LDL, mU/mL | 314.6 (37.0–1003) | 382.2 (37.0–1200) | 0.32 | 309.9 (37.0–1003) | 388.8 (71.0–1164) | 0.15 |
Values are mean (±SD), number of subjects (%) or median (10–90% percentile). ACE indicates angiotensin-converting enzyme; ARB, angiotensin receptor blockers; BP, blood pressure; CCB, calcium channel blockers; CHD, coronary heart disease; HDL, high-density lipoprotein; LDL, low-density lipoprotein; MAP, mean arterial pressure.
Clinical characteristics of 71 participants by sex and occlusion time.
Baseline PWV, its change during reactive hyperaemia and FMS
Table 2 presents the average brachial-radial PWV in absolute values at baseline and by each 30 s post-deflation interval by sex and occlusion time. At baseline, PWV did not differ significantly between both genders (P = 0.080) nor between subjects who underwent the 3-min or 5-min occlusion protocol (P = 0.59). From the first post-occlusion recording of PWV until 210 s thereafter, absolute values of PWV were significantly lower in women as compared to men (P ≤ 0.044 for all; Table 2). Compared to the 3-min occlusion period, subjects who underwent 5-min of occlusion had a significantly lower PWV during the 30–90 s post-occlusion intervals (P ≤ 0.042).
| Component | Gender | Occlusion time | ||||
|---|---|---|---|---|---|---|
| Men (n = 35) | Women (n = 36) | P value | 3 min (n = 35) | 5 min (n = 36) | P value | |
| Baseline PWV (m/s) | 8.37 ± 1.07 | 7.83 ± 1.48 | 0.080 | 8.01 ± 1.20 | 8.18 ± 1.43 | 0.59 |
| PWV (m/s) by time intervals (s)* | ||||||
| First measurement | 7.27 ± 1.20 | 6.61 ± 1.27 | 0.028 | 7.21 ± 1.20 | 6.68 ± 1.30 | 0.080 |
| 0–30 | 7.58 ± 1.19 | 6.88 ± 1.31 | 0.021 | 7.51 ± 1.25 | 6.95 ± 1.29 | 0.065 |
| 30–60 | 7.83 ± 1.28 | 7.13 ± 1.34 | 0.028 | 7.81 ± 1.34 | 7.15 ± 1.30 | 0.037 |
| 60–90 | 7.95 ± 1.06 | 7.03 ± 1.31 | 0.0019 | 7.80 ± 1.28 | 7.18 ± 1.20 | 0.042 |
| 90–120 | 7.97 ± 0.83 | 7.35 ± 1.26 | 0.018 | 7.80 ± 1.15 | 7.52 ± 1.06 | 0.30 |
| 120–150 | 8.06 ± 0.80 | 7.44 ± 1.27 | 0.017 | 7.88 ± 1.19 | 7.62 ± 1.01 | 0.31 |
| 150–180 | 8.06 ± 0.89 | 7.53 ± 1.26 | 0.044 | 7.94 ± 1.19 | 7.66 ± 1.04 | 0.30 |
| 180–210 | 7.95 ± 0.99 | 7.40 ± 1.10 | 0.030 | 7.72 ± 1.20 | 7.63 ± 0.96 | 0.74 |
| 210–240 | 8.06 ± 0.90 | 7.58 ± 1.33 | 0.085 | 7.88 ± 1.20 | 7.76 ± 1.12 | 0.66 |
Values are mean (±SD).
Time intervals were relative to the first PWV recording measured just after cuff deflation. FMS indicates flow-mediated slowing; PWV, pulse wave velocity.
Brachial-radial pulse wave velocity during the FMS protocol by sex and occlusion time.
Figure 2 illustrates the distribution of FMS values by each post-occlusion time interval. Table 3 lists FMS at each time interval during reactive hyperaemia by sex and occlusion time period. Regardless of sex and occlusion time, the peak FMS of PWV was detected at the first PWV recording obtained just after cuff deflation (Table 3; Fig. 3, panel A). In the 0–180s intervals, FMS response was greater in subjects who underwent 5-min of occlusion as compared to 3-min (P ≤ 0.0099; Table 3; Fig. 3, panel A). Throughout the whole post-occlusion period, the relative decrease in PWV did not differ between men and women (P ≥ 0.059; Table 3; Fig. 3, panel B).
| Gender | Occlusion time | |||||
|---|---|---|---|---|---|---|
| Men (n = 35) | Women (n = 36) | P value | 3 min (n = 35) | 5 min (n = 36) | P value | |
| FMS (%) by time intervals (s)* | ||||||
| First measurement | −12.7 ± 12.7 | −14.9 ± 9.78 | 0.41 | −9.96 ± 7.37 | −17.6 ± 13.1 | 0.0038 |
| 0–30 | −9.19 ± 10.8 | −11.6 ± 9.23 | 0.31 | −6.18 ± 7.22 | −14.6 ± 10.8 | 0.0003 |
| 30–60 | −6.32 ± 11.4 | −8.52 ± 8.18 | 0.35 | −2.58 ± 7.27 | −12.2 ± 9.92 | <0.0001 |
| 60–90 | −4.68 ± 9.66 | −8.82 ± 8.33 | 0.059 | −2.67 ± 6.96 | −10.8 ± 9.42 | 0.0001 |
| 90–120 | −4.29 ± 7.60 | −5.45 ± 7.68 | 0.52 | −2.35 ± 7.18 | −7.34 ± 7.28 | 0.0049 |
| 120–150 | −3.08 ± 7.89 | −4.35 ± 7.49 | 0.49 | −1.38 ± 6.57 | −6.01 ± 8.04 | 0.0099 |
| 150–180 | −3.20 ± 8.07 | −3.18 ± 7.12 | 0.99 | −0.72 ± 6.45 | −5.59 ± 7.84 | 0.0056 |
| 180–210 | −4.68 ± 7.57 | −4.56 ± 7.25 | 0.95 | −3.48 ± 5.95 | −5.73 ± 8.44 | 0.20 |
| 210–240 | −3.33 ± 7.22 | −2.80 ± 6.38 | 0.75 | −1.51 ± 4.92 | −4.62 ± 7.99 | 0.054 |
Values are mean (±SD).
Time intervals were relative to the time of the first PWV recording measured just after cuff deflation. FMS indicates flow-mediated slowing; PWV, pulse wave velocity.
FMS per time intervals by sex and occlusion time.
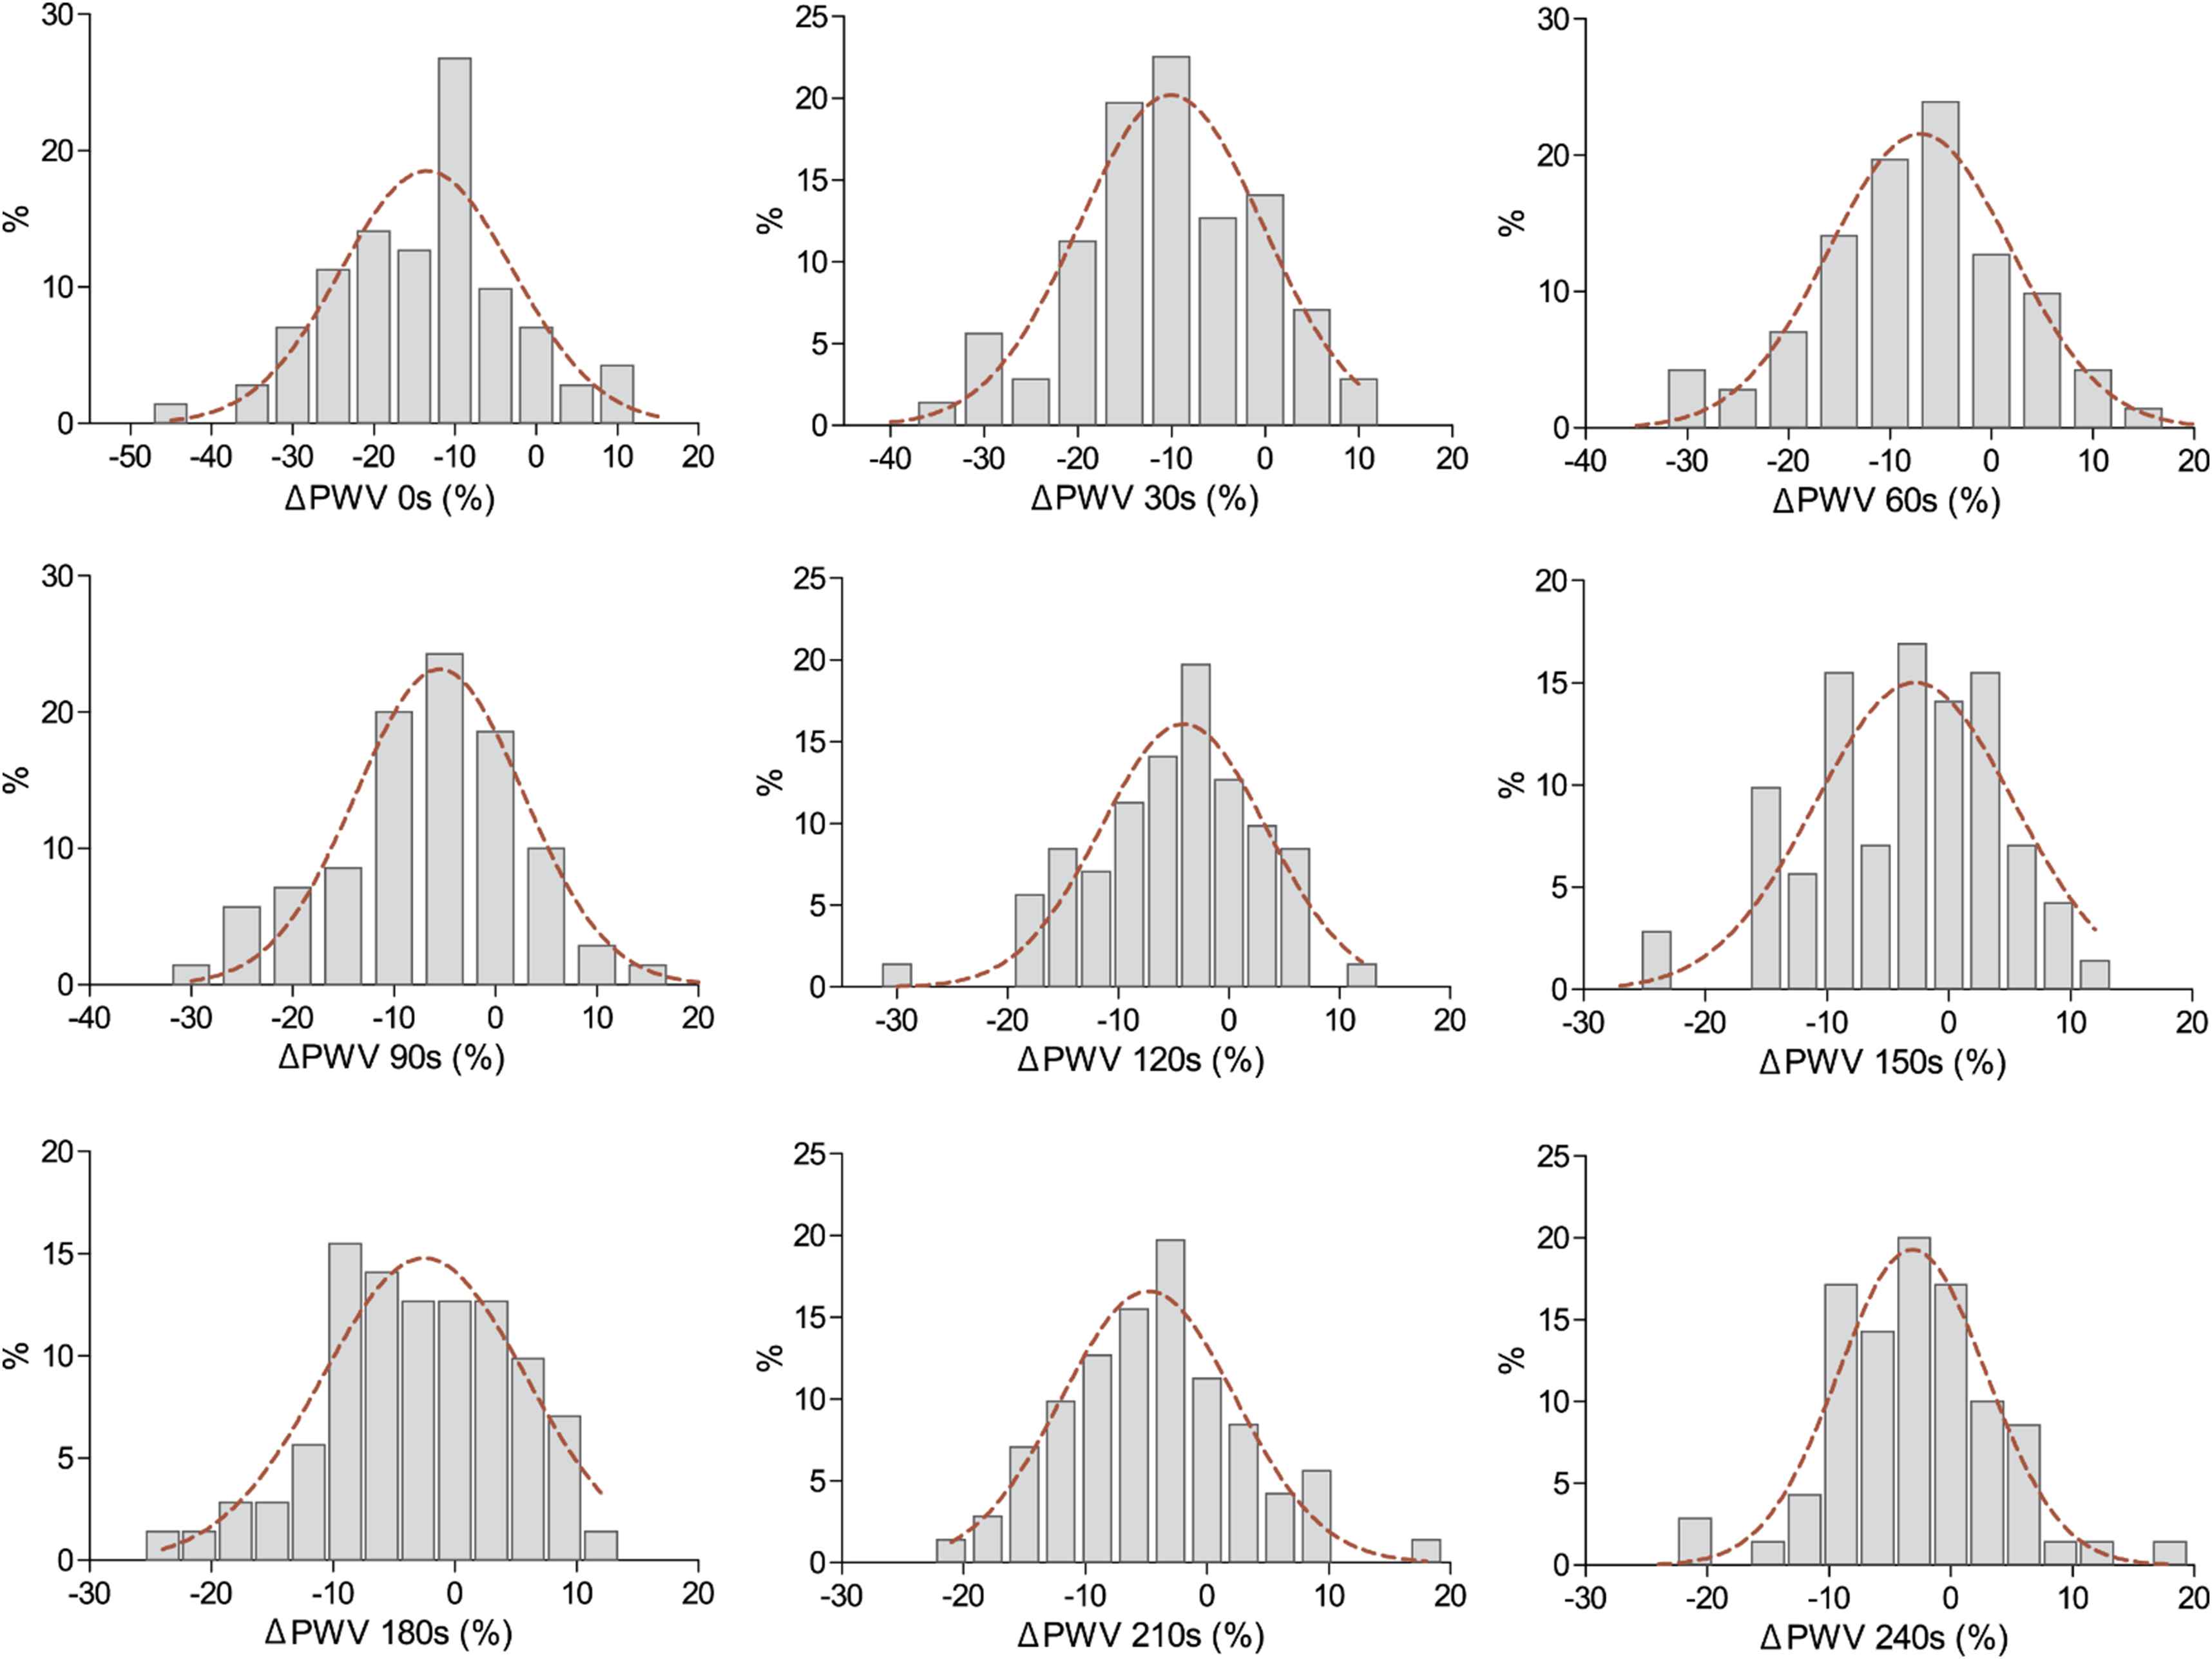
Distributions of hyperaemia-mediated changes in pulse wave velocity (ΔPWV) per 30 s time intervals. Time intervals were relative to the time of the first PWV recording measured just after cuff deflation.
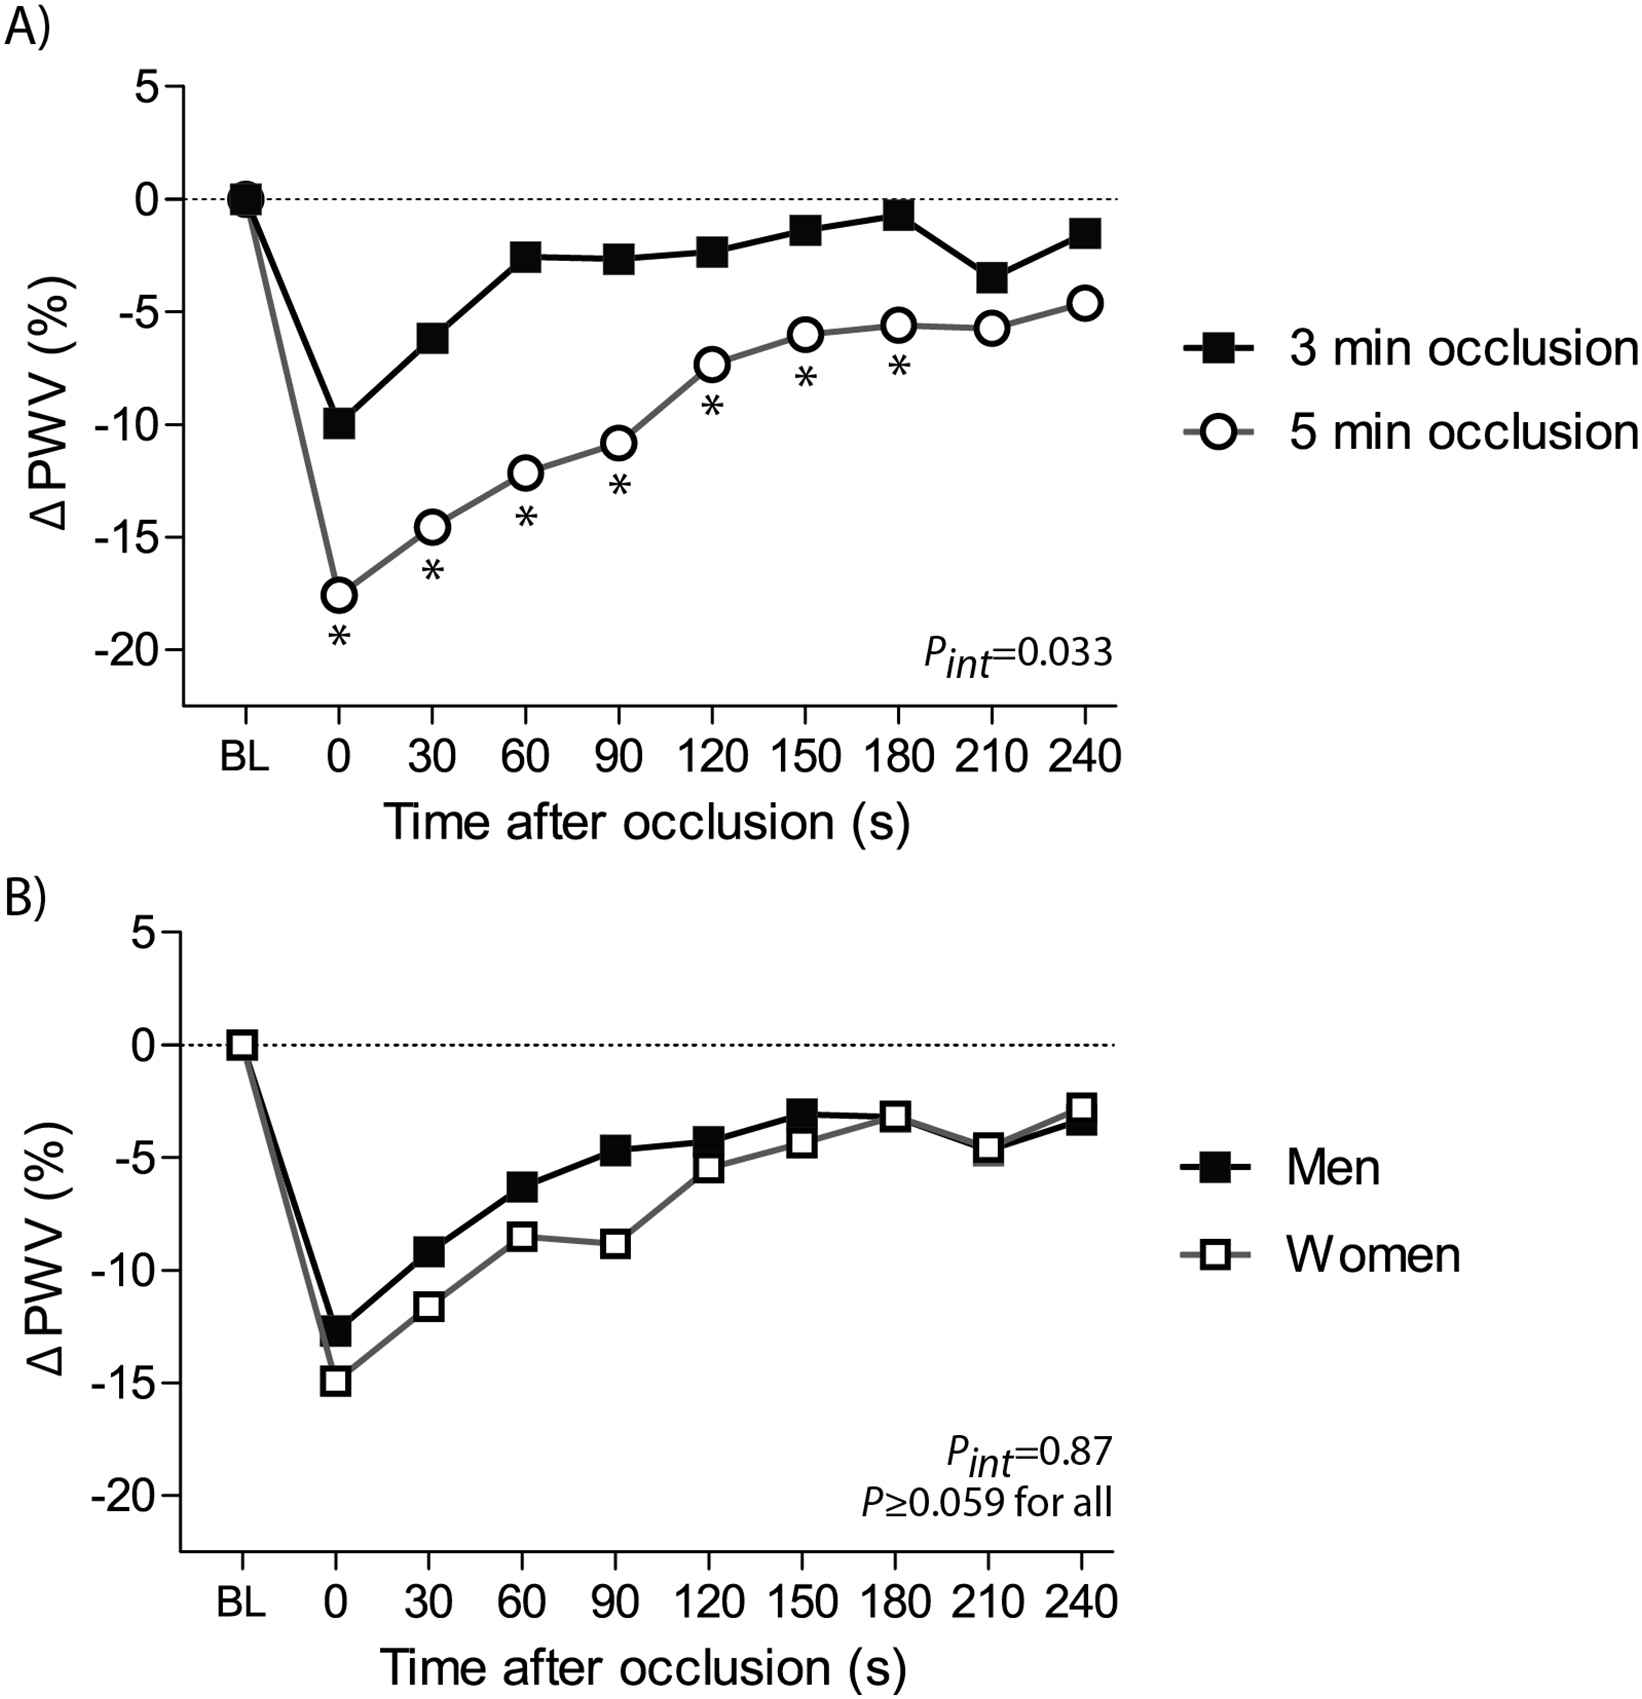
The course of PWV changes by occlusion time (panel A) and sex (panel B). Changes in pulse wave velocity (ΔPWV) following hyperaemia were averaged per 30 s intervals, starting from the first measurement after cuff release. *P < 0.05 for comparison vs 3-min of occlusion. BL indicates baseline; FMS, flow-mediated slowing. Pint for interaction between the FMS response throughout all post-occlusion periods and the occlusion time (panel A) or sex (panel B).
Determinants of FMS
We performed stepwise regression analyses to assess the determinants of FMS recorded immediately after cuff deflation and during each 30 s interval of the post-occlusion period (Table 4). First, we observed that the decline in PWV following reactive hyperaemia was significantly greater after 5-min of occlusion as compared to 3-min (effect sizes for 0–240 s intervals: −1.83% to −9.63%; P ≤ 0.037). While adjusted for occlusion time, PWV declined significantly less with age during the 0–60 s post-occlusion intervals (P ≤ 0.0053; Table 4; Fig. 4). Women showed a greater hyperaemia-mediated decrease in PWV than men only during the 60–90 s interval (−4.00%; P = 0.037).
| Parameters | ΔPWV (%) by time intervals (s)* | ||||||||
|---|---|---|---|---|---|---|---|---|---|
| First measurement | 0–30 s | 30–60 s | 60–90 s | 90–120 s | 120–150 s | 150–180 s | 180–210 s | 210–240 s | |
| Adjusted R2 (%) | 36.8 | 32.7 | 35.4 | 36.4 | 29.1 | 29.3 | 26.8 | 9.40 | 23.8 |
| Occlusion time (5 vs 3 min) | |||||||||
| β ± SE | −9.29 ± 2.10 | −9.32 ± 2.01 | −9.63 ± 1.99 | −7.90 ± 1.92 | −5.32 ± 1.66 | −4.23 ± 1.67 | −4.74 ± 1.66 | −1.83 ± 0.86 | −4.36 ± 1.53 |
| P value | <0.0001 | <0.0001 | <0.0001 | 0.0001 | 0.0022 | 0.014 | 0.0059 | 0.037 | 0.0060 |
| Partial R2 (%) | 19.4 | 21.5 | 27.2 | 23.7 | 15.5 | 12.9 | 13.1 | 6.11 | 7.11 |
| Age (+10 years)** | |||||||||
| β ± SE | 3.68 ± 0.77 | 2.99 ± 0.74 | 2.10 ± 0.73 | 1.23 ± 0.69 | 0.83 ± 0.62 | 0.041 ± 0.60 | −0.084 ± 0.60 | 0.76 ± 0.63 | 0.98 ± 0.57 |
| P value | <0.0001 | 0.0001 | 0.0053 | 0.079 | 0.18 | 0.95 | 0.89 | 0.23 | 0.092 |
| Partial R2 (%) | 17.4 | 11.2 | 4.67 | 3.38 | – | – | – | – | – |
| Female (0,1) | |||||||||
| β ± SE | – | – | – | −4.00 ± 1.88 | – | – | – | – | – |
| P value | 0.037 | ||||||||
| Partial R2 (%) | 7.56 | ||||||||
| DBP, (+10 mm Hg) | |||||||||
| β ± SE | – | – | – | – | −1.56 ± 0.85 | −1.97 ± 0.87 | −2.32 ± 0.85 | −2.04 ± 0.92 | −2.32 ± 0.79 |
| P value | 0.074 | 0.027 | 0.0087 | 0.031 | 0.0048 | ||||
| Partial R2 (%) | 3.41 | 5.44 | 7.35 | 4.61 | 9.03 | ||||
| Smoking (0,1) | |||||||||
| β±SE | – | – | – | −5.36 ± 2.80 | −4.05 ± 2.30 | −7.33 ± 2.34 | −5.81 ± 2.30 | – | −4.76 ± 2.11 |
| P value | 0.060 | 0.083 | 0.0026 | 0.014 | 0.028 | ||||
| Partial R2 (%) | 3.54 | 3.29 | 5.75 | 4.61 | 4.64 | ||||
| oxLDL, per doubling | |||||||||
| β ± SE | – | – | – | −1.31 ± 0.62 | −1.41 ± 0.53 | −1.39 ± 0.53 | −1.30 ± 0.53 | – | – |
| P value | 0.040 | 0.0098 | 0.011 | 0.016 | |||||
| Partial R2 (%) | 2.94 | 7.11 | 6.37 | 6.68 | |||||
| History of DM (0,1) | |||||||||
| β ± SE | – | – | – | – | – | – | – | – | −5.08 ± 2.29 |
| P value | 0.030 | ||||||||
| Partial R2 (%) | 5.70 | ||||||||
Values are mutually adjusted partial regression coefficients (±SE), reflecting the percentage increase or decrease in FMS response for a given change in the independent covariable. The covariables considered in stepwise models included occlusion time, sex, age, current smoking, mean arterial pressure, pulse pressure, heart rate, body mass index and antihypertensive treatment.
Time intervals were relative to the time of the first PWV recording measured just after cuff deflation.
Age was forced into all models. DBP indicates diastolic blood pressure; DM, diabetes mellitus; FMS, flow-mediates slowing; oxLDL, oxidized low-density lipoprotein; PWV, pulse wave velocity.
Correlates of FMS as selected by stepwise regression.
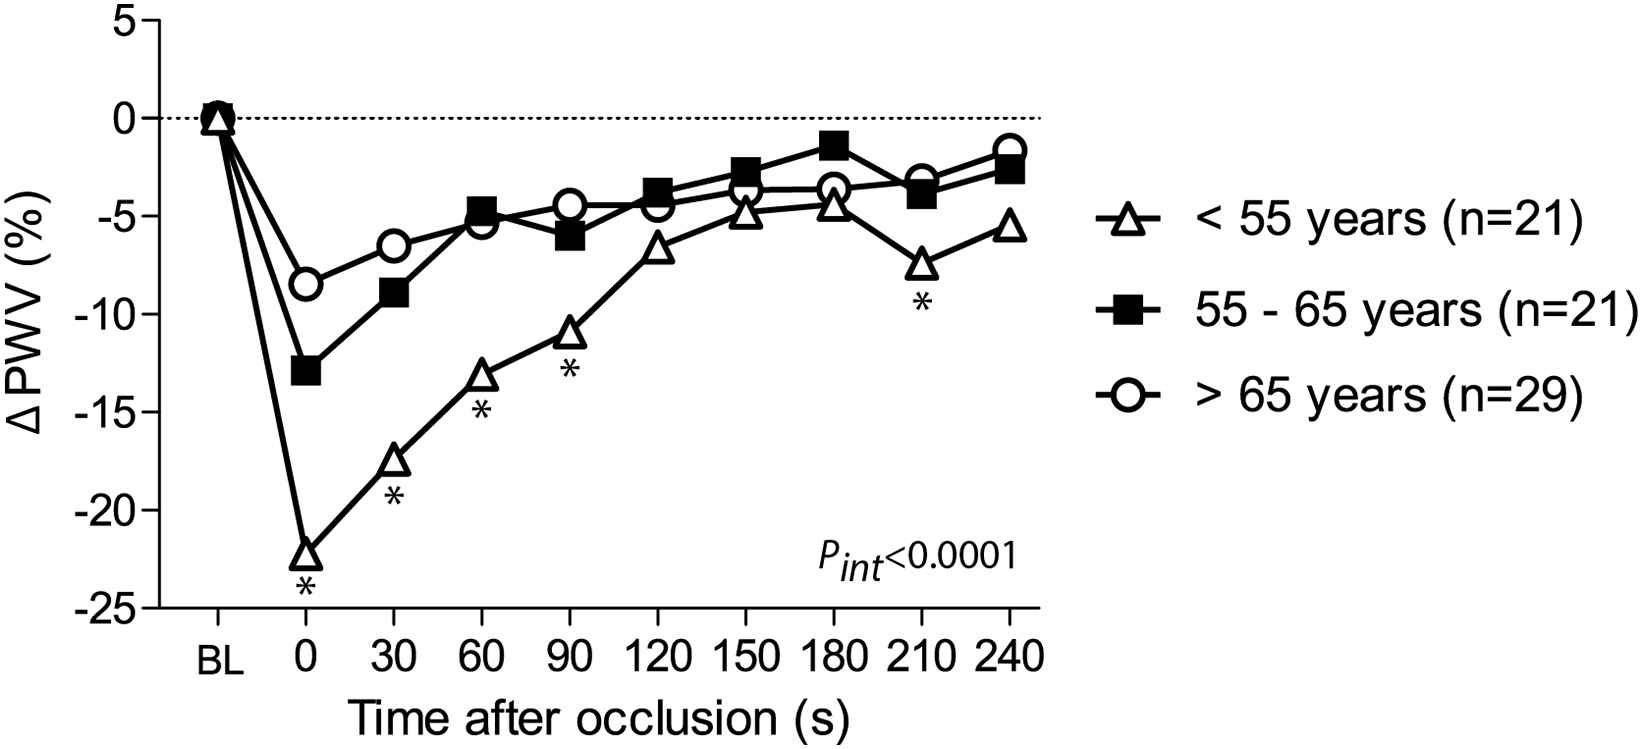
The course of PWV changes by age tertiles. Changes in pulse wave velocity (ΔPWV) following hyperaemia were averaged per 30 s intervals, starting from the first measurement after cuff release. *P < 0.05 for comparison with subjects >55 years of age. BL indicates baseline; FMS, flow-mediated slowing. Pint for interaction between the FMS response throughout all post-occlusion periods and age groups.
We noticed that after 120 s of post-deflation, adjusted ΔPWV remained significantly lower in subjects with high diastolic blood pressure and oxidized LDL, and in smokers (P ≤ 0.028 for all; Table 4).
FMS and cardiovascular risk factors
Figure 5 shows the unadjusted and age-adjusted FMS for each 30 s post-deflation time interval in subjects with cardiovascular risk factors (hypertension, smoking, diabetes and history of coronary heart diseases) and in healthy reference group. After adjustment for age, we did not observe any differences in the peak hyperaemia-mediated FMS of PWV between subjects with and without risk factors. On the other hand, after 5-min of occlusion, 26 subjects with cardiovascular risk factors exhibited a significant delay in recovery of PWV as compared to 10 healthy subjects (P ≤ 0.039 for 150–240 s post-occlusion intervals; Fig. 5). We did not observe any significant difference in FMS between participants with and without CV risk factors who underwent 3-min of occlusion (P ≥ 0.27 for all 30 s post-occlusion intervals; Fig. 5).
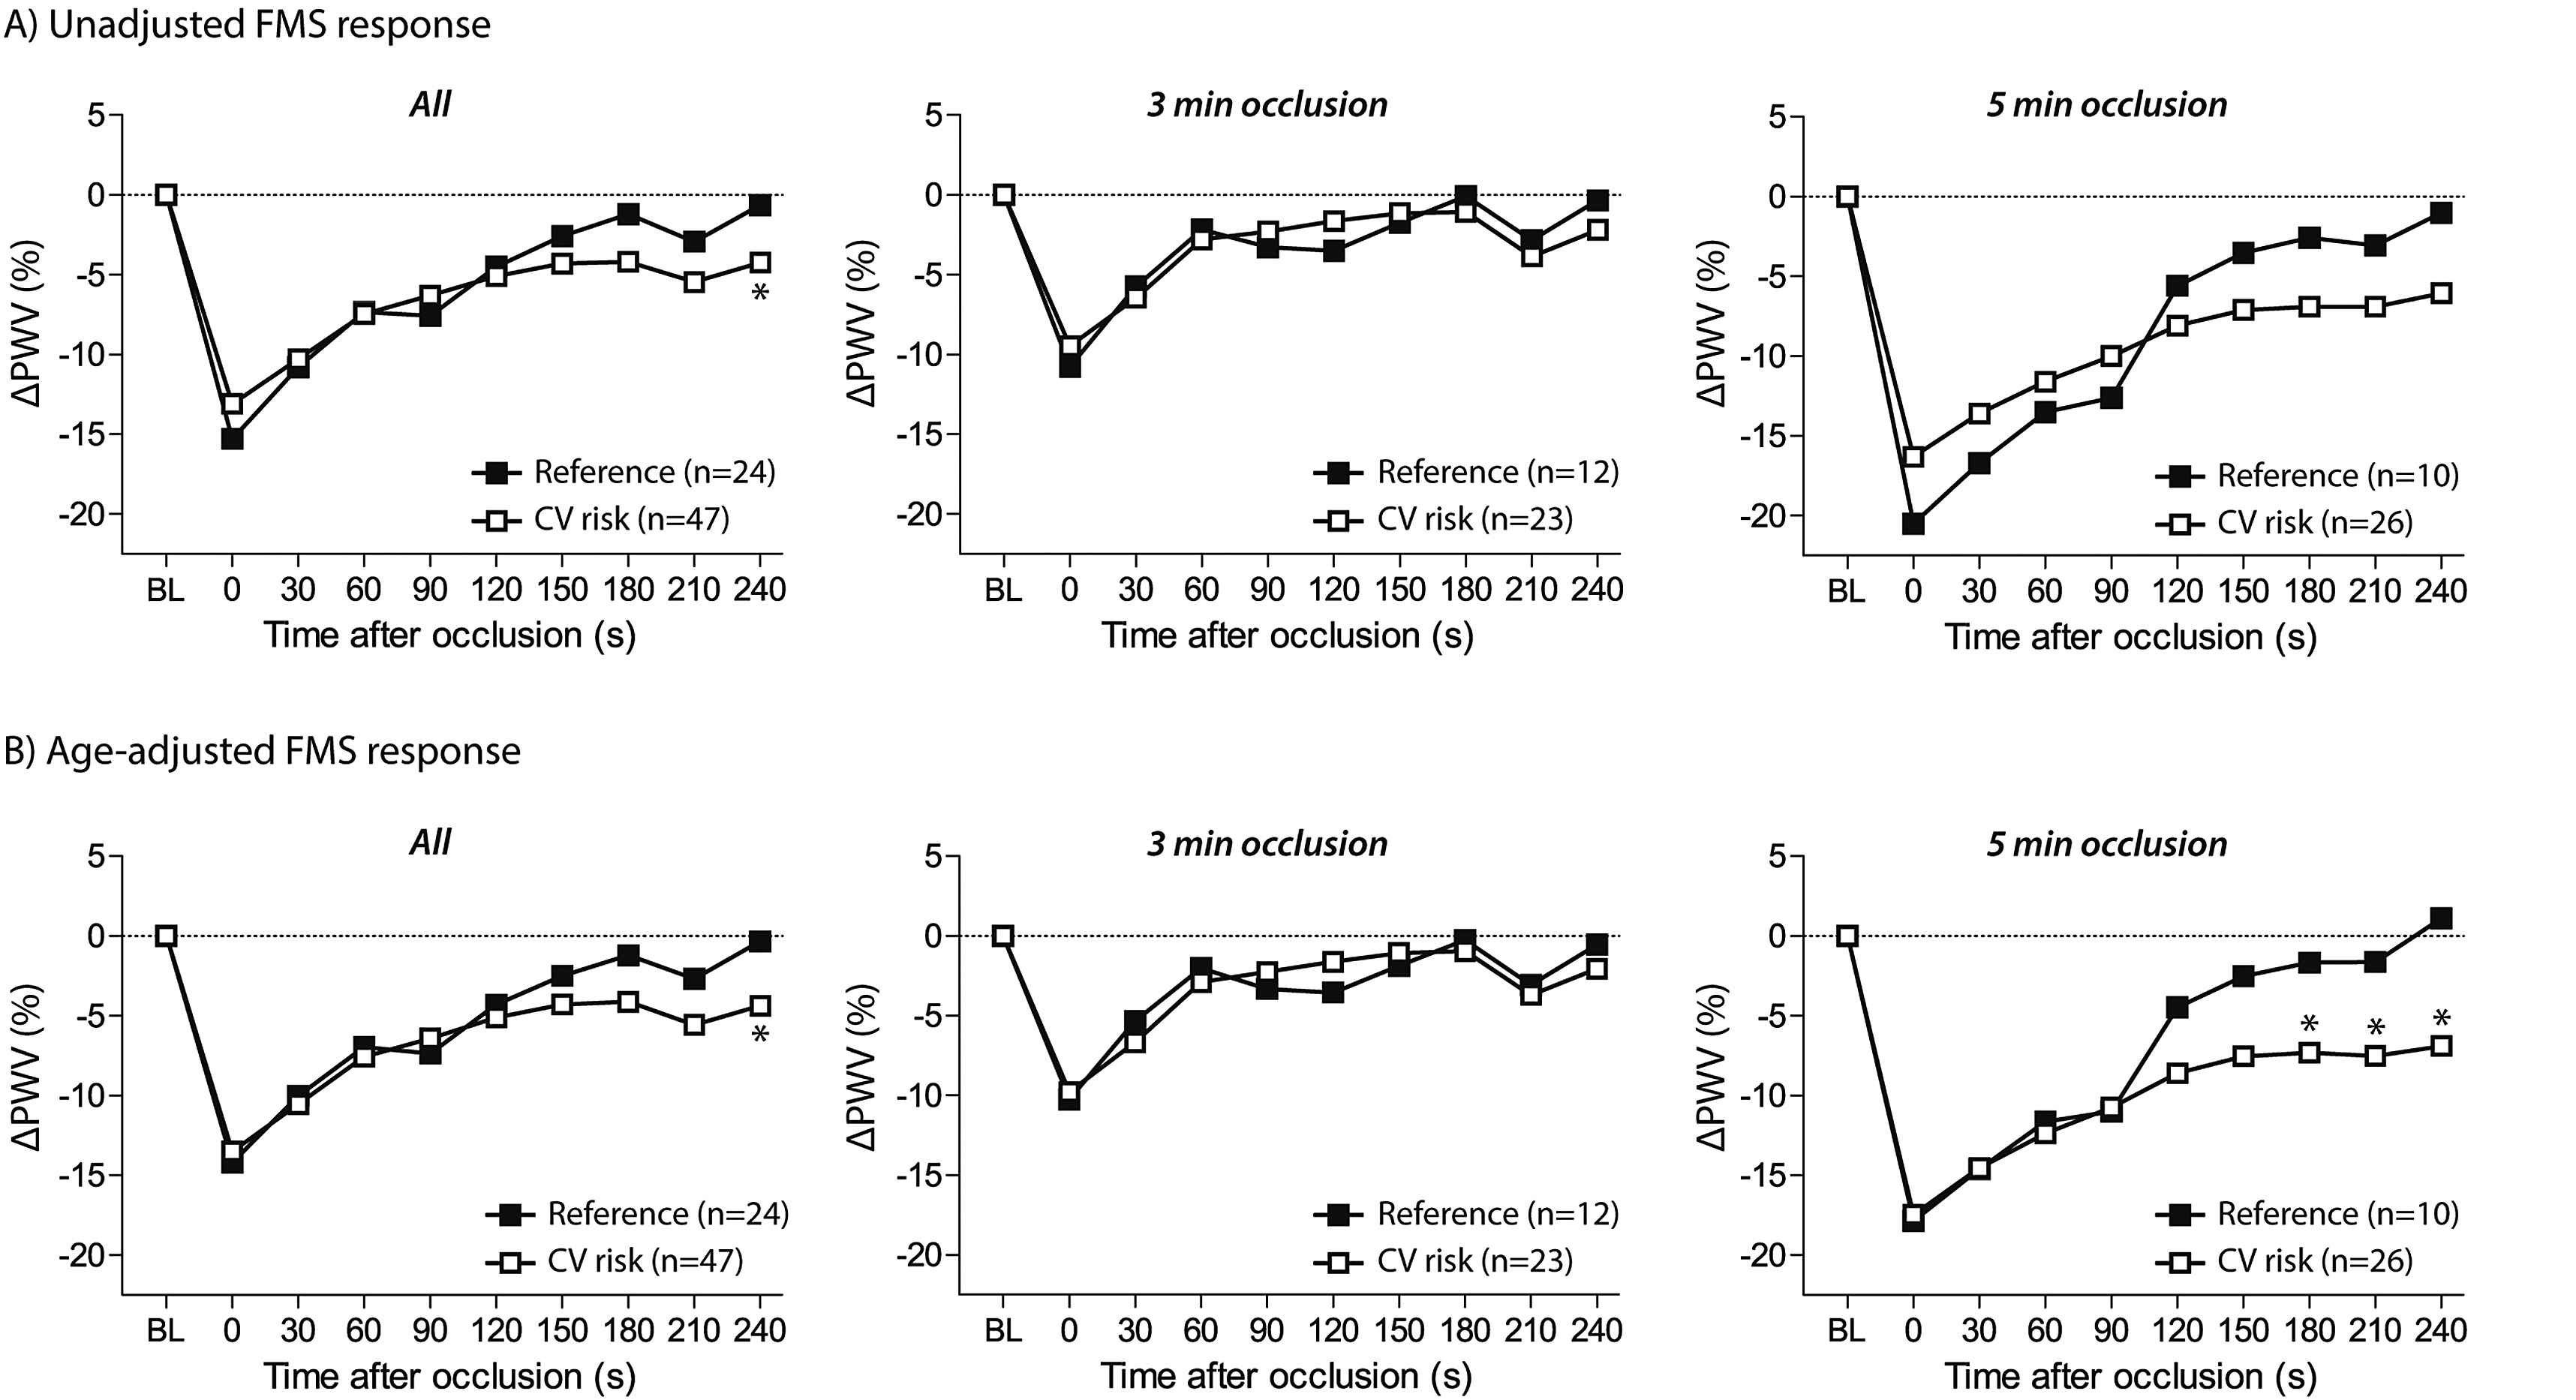
The course of PWV changes by cardiovascular risk pattern. Changes in pulse wave velocity (ΔPWV) following hyperaemia are presented as unadjusted (A) or age-adjusted values (B). *P < 0.05 for comparison with reference group including non-smoking normotensives. BL indicates baseline; FMS, flow-mediated slowing.
Discussion
In this population study, we investigated methodological aspects and clinical determinants of the temporal decline in PWV triggered by reactive hyperaemia. The key findings of our study can be summarized as follows: (i) we detected an overall greater PWV change after a 5-min than after a 3-min occlusion period; (ii) advanced age blunted the peak hyperaemic PWV decline detected after cuff deflation; and (iii) subjects with cardiovascular risk factors exhibited a delay in recovery of PWV as compared to a healthy reference group.
Nitric oxide (NO) is an important endothelium-derived vasodilator with anti-atherosclerotic properties.1 The reduction in NO bioavailability, a key feature of endothelial dysfunction, impairs the capacity of the arterial wall to dampen increased shear stress following hyperaemia.4 Currently, endothelial function can be assessed non-invasively during reactive hyperaemia using the FMD of the brachial artery,5,6 or the change in digital pulse amplitude measured by applanation tonometry4,7,8 or photoplethysmography.9,10 To date, FMD is considered the gold standard for assessment of vasomotor function in the conduit arteries. However, the technically challenging FMD procedure requires extensive training and standardization to guarantee acceptable reproducibility.5,16
Recent studies proposed that flow-mediated changes in PWV during hyperaemic response might be used as a user-friendly, reliable alternative to assess vasomotor function.11,12 As shown by Naka et al., the brachial-radial PWV decreases in parallel to an increase in the brachial artery diameter during reactive hyperaemia.11 Moreover, the authors also demonstrated the impact of NO on PWV changes. Indeed, stimulation of NO release by acetylcholine caused a decrease in PWV along with an increase in the brachial artery diameter, whereas infusion of the NO synthase inhibitor (L-NMMA) caused an increase in PWV and a decrease in the brachial artery diameter.11 This suggests that FMS of PWV during reactive hyperaemia might be used as a marker of arterial distensibility and endothelial function.
In our study, to assess FMS we used paired oscillometric cuffs together with fully automated commercially available software allowing a beat-to-beat assessment of brachial-radial PWV at baseline and during a post-occlusion period. In contrast to FMD, the FMS procedure requires little training, time and logistics, promoting its use in large-scale population studies and screening programs.
In our study we demonstrated that the magnitude of FMS is related to the duration of the occlusion period. Previous studies examined the effect of suprasystolic occlusion time on the vasodilatory response to reactive hyperaemia.5,17 In 11 young healthy subjects, Sinoway et al. did not observe any significant differences in the maximal peak blood flows and changes in the artery diameter following 3-min and 10-min of occlusion.17 In contrast, an FMS study in 43 healthy volunteers demonstrated that longer occlusion times resulted in greater rates of carotid-radial PWV change early after cuff release.18 In line with the latter study, we also observed a significantly greater PWV change after a longer occlusion time (5-min) as compared to a shorter occlusion period (3-min). Thus, similarly to recommendations for FMD testing,5,16 our findings confirm the use of a suprasystolic occlusion period of at least 5-min for vasomotor function assessment by FMS.
Age-associated changes in vascular wall properties are characterised by intima-media thickening, loss of elastic properties, and, therefore, stiffening of the arterial wall.19 Overall, these pathological processes gradually hamper the vasodilatory capacity of the conduit arteries to adapt to increased shear stress. In line with our findings, previous studies showed an age-related deterioration in vasoreactivity as assessed by the FMD of the brachial artery20 or the FMS of carotid-radial PWV.21 In addition, our study explored the association of age with the FMS of PWV of the brachial artery during each 30 s interval of the post-occlusion period. We observed that the FMS of PWV at early post-occlusion periods (30–90 s) was significantly correlated with age, whereas the ΔPWV at the later post-occlusion periods appeared unaffected by age.
It is well known that vasomotor function is affected by cardiovascular factors such as hypertension and smoking.22–24 Indeed, high blood pressure and exposure to cigarette smoke damage the endothelial lining of vascular smooth muscle cells through enhanced oxidative stress.22–24 The Framingham Heart Study showed in 2883 randomly recruited participants that both systolic blood pressure and current smoking were independent determinants of a lower peak FMD.20 In our small community-based sample, however, cardiovascular risk factors were not independently correlated with the early peak FMS of PWV of the brachial artery. On the other hand, we observed that subjects with high level of diastolic blood pressure and oxidized LDL as well as smokers exhibited a delay in recovery of PWV following hyperaemia as compared to a healthy reference group. To our knowledge, our study is the first to report the ΔPWV continuously including the later stage of post-occlusion. In our healthy reference subjects the hyperaemia-mediated PWV returned to baseline PWV values within 3-min after deflation (180 s) which is similar to the time reported previously on FMD recovery in healthy subjects.25 In contrast, in subjects with cardiovascular risk factors the artery might be slower to return to baseline and, therefore, a longer period of time would be required for a full PWV recovery. Future studies should further clarify the mechanisms underlying this observation.
This study has to be interpreted within the context of its potential limitations. First, considering the relative small sample size, our findings should be validated in a larger cohort of randomly recruited subjects. Second, as previous FMS studies did not address our objectives, we could only interpret our findings in the light of FMD studies or reports on hyperaemia-mediated changes in carotid-to-radial PWV. Furthermore, the cross-sectional design of our study did not allow inferring causality. Finally, our study population only included white European participants, limiting the generalizability of our findings to other ethnicities.
In conclusion, in our population study we confirmed the preference of using a 5-min occlusion time for the assessment of vasomotor function by FMS. Whereas the early peak of FMS might deteriorate with ageing, cardiovascular risk factors might affect the time of recovery of PWV following reactive hyperaemia. Our work demonstrates the potential value of continuous measurement of changes in PWV of the brachial artery during post-occlusion period. Future studies should further investigate whether the FMS response might help in risk stratification of patients.
Funding
The Studies Coordinating Centre also received grants from the
Conflict of interest
None.
Appendix A
Supplementary data
Supplementary data related to this article can be found at
References
Cite this article
TY  - JOUR
AU  - Nicholas Cauwenberghs
AU  - Yenthel Heyrman
AU  - Lutgarde Thijs
AU  - Wen-Yi Yang
AU  - Fang-Fei Wei
AU  - Zhen-Yu Zhang
AU  - Jan A. Staessen
AU  - Tatiana Kuznetsova
PY  - 2018
DA  - 2018/01/09
TI  - Flow-mediated slowing of brachial-radial pulse wave velocity: Methodological aspects and clinical determinants
JO  - Artery Research
SP  - 29
EP  - 37
VL  - 21
IS  - C
SN  - 1876-4401
UR  - https://doi.org/10.1016/j.artres.2017.12.001
DO  - 10.1016/j.artres.2017.12.001
ID  - Cauwenberghs2018
ER  -