
Generalized Exponential Estimator for the Estimation of Clustered Population Variance in Adaptive Cluster Sampling
- DOI
- 10.2991/jsta.d.191204.001How to use a DOI?
- Keywords
- Adaptive cluster sampling; Auxiliary information; Exponential estimators; Hansen-Hurwitz estimation; Simulated population and Poisson clustered process
- Abstract
In this paper, we proposed a generalized exponential estimator with two auxiliary variables for the estimation of highly clumped population variance under adaptive cluster sampling design. The expressions of approximate bias and minimum mean square error are derived. A family of exponential ratio and exponential product estimator is obtained by using different values of generalized and optimized constants. A numerical study is carried out on real and artificial populations to examine the performance of the proposed estimator over the competing estimators. Related results show that the proposed generalized exponential estimator is able to provide considerably better results over the competing estimators for the estimation of rare and highly clustered population variance.
- Copyright
- © 2019 The Authors. Published by Atlantis Press SARL.
- Open Access
- This is an open access article distributed under the CC BY-NC 4.0 license (http://creativecommons.org/licenses/by-nc/4.0/).
1. INTRODUCTION
Adaptive cluster sampling (ACS), first proposed by Thompson [1] is considered to be the most capable design for providing summary information on occurrence, structure and abundance of rare and clustered populations. The main feature of ACS is that it can select more meaningful samples and provide more efficient estimates for the field investigators to estimate the rare and clustered population parameters (total, mean, variance, proportion) as compare to the other conventional sampling designs. Auxiliary information is commonly used to improve the efficiency of the estimators. In many environmental surveys, the presence of rare species in some communities is always associated with some other community densities which are more readily observable than the presence of a rare species. So the presence of such community abundance can be used as an auxiliary variable to inform sampling of rare species.
Various authors used ACS at design stage and estimation stage in the past and applied it in many real life situations. Thompson [1–3] introduced different techniques of ACS design in which the initial sample is selected by some classical sampling designs (such as stratified sampling, strip and systematic sampling) and proposed the standard ACS estimators based on the modification of Horvitz-Thompson (HT) [4] and Hansen-Hurwitz (HH) [5] type estimators. Chao [6,7] is considered to be the first, who utilized auxiliary information to propose the ratio and regression estimators based on the modification of HT estimator and discussed the confidence interval as well. Dryver and Chao [8] suggested a ratio estimator based on the modification of HH type estimators in ACS and concluded that the adaptive estimators perform considerably better than traditional ratio estimator if the variability of the survey variable is proportional to the within-network means level of the auxiliary variable.
In this article, we proposed a generalized exponential estimator having two auxiliary variables for the estimation of rare and highly clustered population variance under ACS design. The methodology of ACS design along with some existing estimators in SRS and ACS are presented in Section 2. The expressions of approximate bias and minimum mean square error (MSE) of the proposed estimator are derived in Section 3. Some special cases are also discussed in the same section in which the proposed estimator reduces to the several exponential ratio and exponential product-type estimators for different values of generalize and optimize constants. A numerical study is conducted in Section 4 based on the real data application taken from Smith et al. [9] together with the artificial clustered populations generated by Poisson cluster process (Diggle [10]) at different level of rarity and aggregation. Final summary and remarks on the paper are given in Section 5.
2. METHODOLOGY OF ACS
The ACS design typically starts with random sample of size n, which can be taken by simple random sampling (Thompson [1]), stratified sampling (Thompson [3]; Brown [11]), strip or systematic sampling (Thompson [2]; Acharya et al. [12]) method and extended it straightforwardly to the ACS.
Prior to the ACS procedure, a threshold value is chosen, say C, and if any of the initially selected sample meet or exceed this threshold, i.e., yi ≥ C, the spatially surrounding (denoted as north
Figure 1 illustrates the idea of ACS with condition {y; y ≥ 1}. The total study region is divided into 5 × 10 = 50 quadrants in which the population is divided into three clusters that satisfying C. The units having star (*) are initially selected units and all the shaded units are adapted units that satisfied C. The bold units are known as edge units that does not meet the threshold. There are 37 networks of size one including edge units. Each cluster is based on a network (shaded) and its associated edge units (bold). Thus the first network based 5 units and 8 edge units. Second network has also 5 units but 7 edge units. Network 3 has 3 units and 5 edge units.
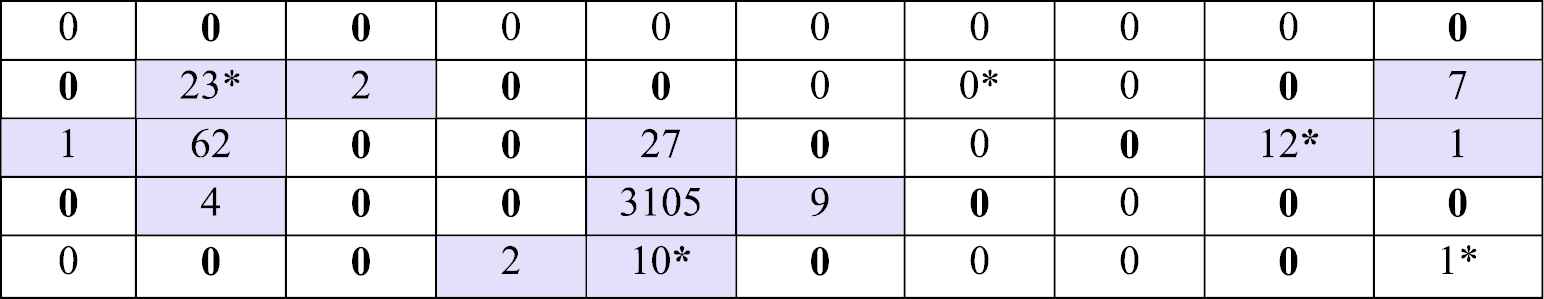
The example of 3 clusters according to the condition.
As in the usual finite population sampling situation, the population is considered to consist of N units that labeled from 1 to N, denoted as u = {1, 2, 3, …, N}. Associated with each unit i, the values of survey variable together with the auxiliary variables are denoted as
In ACS the initial sample of size n units is selected with simple random sampling without replacement (SRSWOR). Let
ACS can be considered as SRSWOR if the average values of the networks are used instead of original values (Thompson [13]; Dryver and Chao [8]). Consider the notations of
In ACS, we consider the following notations to obtain the expressions of bias and MSE of the proposed estimators. Let us define
The traditional sample variance estimator of the population variance in SRS is defined as
3. GENERALIZED EXPONENTIAL ESTIMATOR
In this section, motivated by Khan [14], we proposed a generalized exponential type estimator for the estimation of rare and highly clustered population variance in ACS. The exponential estimator with two auxiliary variables is
In order to obtain the expression of approximate bias, we may re-write (2) using the notations given in (1) as
Simplifying and applying Taylor series and taking expectation on both sides, we have
The final expression of approximate bias of the proposed generalized exponential estimator is
In order to obtain the expression of MSE, we may re-write the (2) using first-order approximation as
Simplifying, squaring and taking expectation on both sides, we have
The expression of MSE of the proposed generalized exponential type estimator is
In order to obtain the expression of minimum MSE, differentiating (3) with respect to
Final expression of the minimum MSE of the proposed generalized exponential type estimator is
It is noticed that we may get various forms of exponential ratio and exponential product-type estimators for different values of a, b, α and β as new family of the proposed estimator summarized in Appendix A. Here we consider only two special cases of the proposed estimator.
a = 2, b = 2, α = 1 and β = 1.
a = 1, b = 1, α = 1 and β = 1.
4. PERFORMANCE EVALUATION
In this section, we set up a numerical study to examine the performance of the proposed estimator over the competing estimators on different initial and their corresponding expected sample sizes. The threshold value is chosen as 1 with the same ACS process in which the immediate first-order neighboring units added to the sample. In ACS, the expected sample size is usually depends on the initial sample size and varies according to the adaptation of neighboring units of the initial sample size. The expected sample size denoted by “E(v)” is the sum of the probabilities of inclusion of all the quadrates (Thompson [13]) define as
Note that:
The general expression for the computation of absolute relative bias (ARB) and MSE of all the estimators are given as
The evaluation of the proposed estimators over the sample variance estimator under SRS is based on the relative efficiency (RE), denoted as
4.1. Simulation Study
Two rarely clustered artificial populations were generated as a realization of the Poisson cluster process over a study region partitioned into
In this simulation study, we generated the values of the survey variable using ecodist-package in R in such a way that the variability of the survey variable is exponentially proportional to the auxiliary variables (x and z). Figure 2 illustrates the behavior of the initial clustered populations of both auxiliary variables x and z. One hundred thousand Monte Carlo simulated ACS and SRSWOR samples were generated to compute the values of the estimators considered in this paper. The population size is 400 and the initial sample varies from 5 to 100. The amount of ARBs and REs of all the estimators considered in this paper are summarized in Tables 1 and 2 on different initial and their corresponding expected sample sizes.
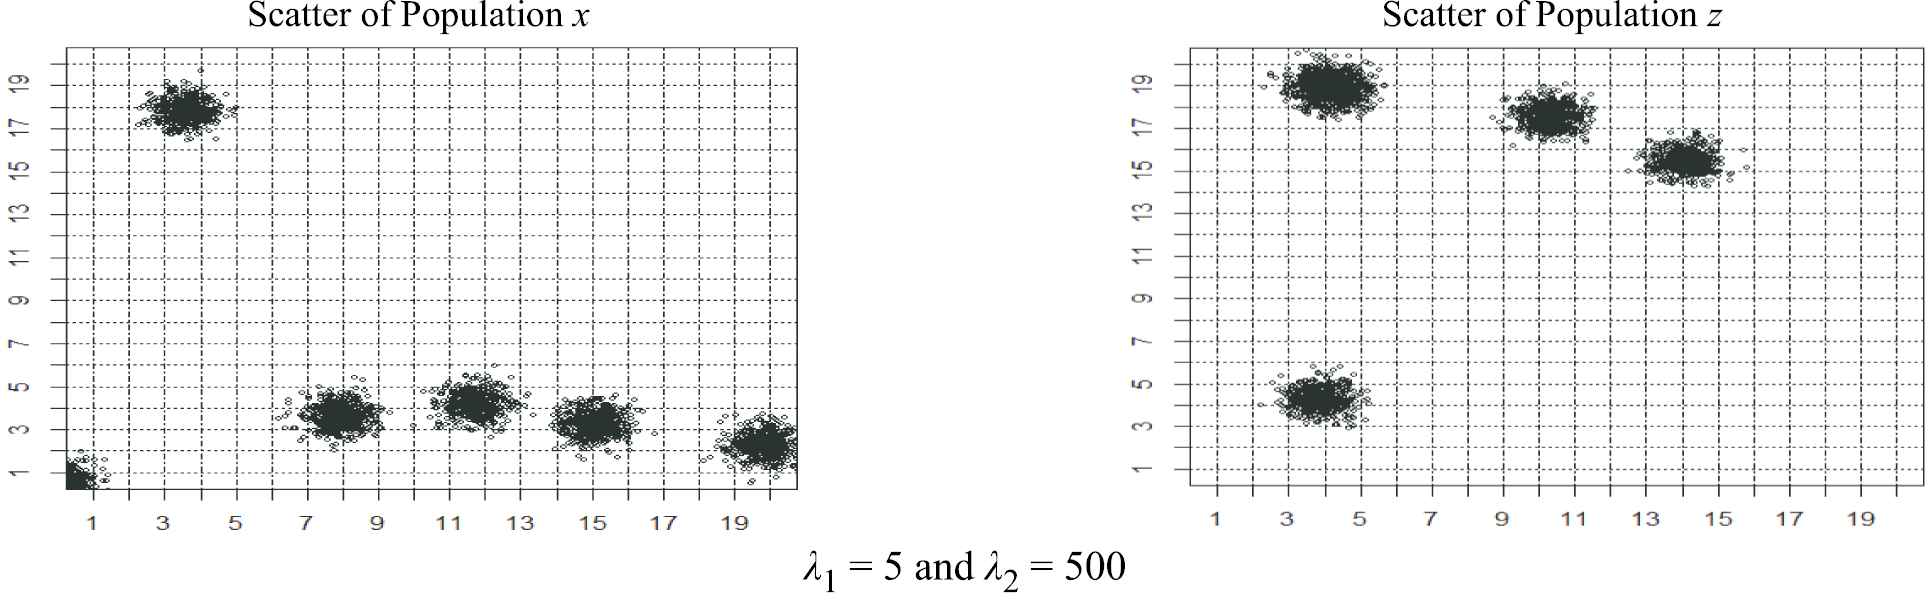
Clustered populations for x and z generated by Poisson cluster process.
| 5 | 26.76 | 1.01 | 0.61 | 0.42 | 0.01 | 0.29 | 1.24 | 1.08 | 0.84 |
| 10 | 57.70 | 0.76 | 0.40 | 0.33 | 0.00 | 0.19 | 0.36 | 0.29 | 0.21 |
| 20 | 92.86 | 0.51 | 0.25 | 0.21 | 0.00 | 0.12 | 0.16 | 0.12 | 0.10 |
| 50 | 144.43 | 0.32 | 0.22 | 0.11 | 0.00 | 0.09 | 0.08 | 0.06 | 0.04 |
| 75 | 166.98 | 0.21 | 0.27 | 0.07 | 0.00 | 0.06 | 0.05 | 0.03 | 0.02 |
| 100 | 187.17 | 0.14 | 0.30 | 0.06 | 0.00 | 0.04 | 0.03 | 0.02 | 0.01 |
ARB, absolute relative bias; SRS, simple random sampling; ACS, adaptive cluster sampling.
Amount of ARB's of SRS and ACS estimators for
| 5 | 26.76 | 0.01 | 0.58 | 0.72 | 0.87 | 0.97 | 1.87 | 1.98 | 2.21 |
| 10 | 57.70 | 0.01 | 0.78 | 0.89 | 1.20 | 1.23 | 2.26 | 2.41 | 2.86 |
| 20 | 92.86 | 0.02 | 0.94 | 1.00 | 1.91 | 2.11 | 3.56 | 3.88 | 4.56 |
| 50 | 144.43 | 0.04 | 0.96 | 1.39 | 2.56 | 2.72 | 5.11 | 5.91 | 6.43 |
| 75 | 166.98 | 0.07 | 0.91 | 1.62 | 2.76 | 2.98 | 7.01 | 7.63 | 8.98 |
| 100 | 187.17 | 0.11 | 0.92 | 1.41 | 3.26 | 3.51 | 8.11 | 8.97 | 10.55 |
RE, relative efficiency; SRS, simple random sampling; ACS, adaptive cluster sampling.
Amount of RE's of SRS and ACS estimators for λ1 = 5 and λ2 = 50.
The results summarized in Tables 1 and 2 indicates that the ACS estimators perform considerably better than the conventional sample variance, ratio and exponential ratio estimators in SRS design. The generalized exponential estimator performs considerably better than all the adaptive and non-adaptive estimators in term of RE. The classical ratio and exponential ratio estimators under SRS did not perform well even for the large sample due to the highly clustered behavior of populations. The amount of ARBs for all the estimators converges to zero by increasing the sample size.
4.2. Real Data Application
Two real data of waterfowl species has been taken from Smith et al. [9] to examine the performance of the proposed estimator over the sample variance estimator under conventional sampling design. The total area under study covered a region of 200 25-km2 quadrates in Central Florida. The counts of Blue-winged teal (x) and Ring-necked teal (z) as shown in Figures 3 and 4 are considered to be the auxiliary variables.
Blue-winged teal population (x).
Green-winged teal population (z).
In this simulation, we generate the values of the survey variable using the linear combination of the auxiliary variables, as
The variability of the survey variable is directly proportional to the sum of the linear combination of the auxiliary variables.
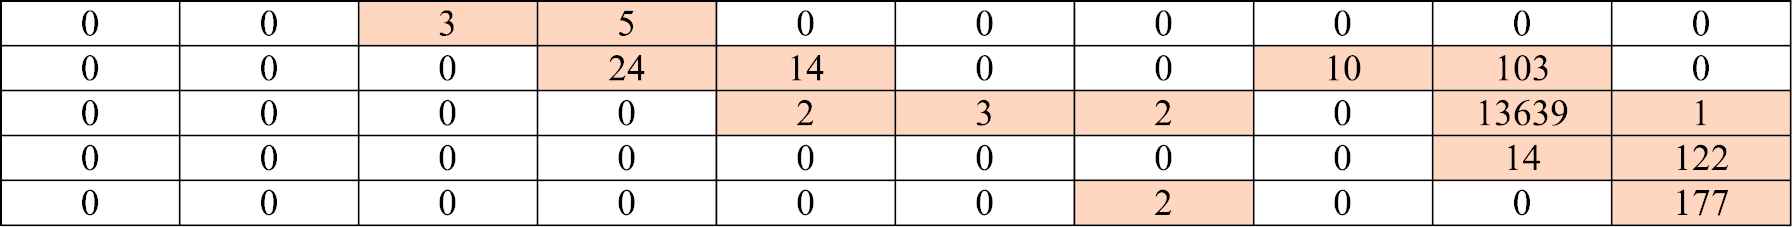
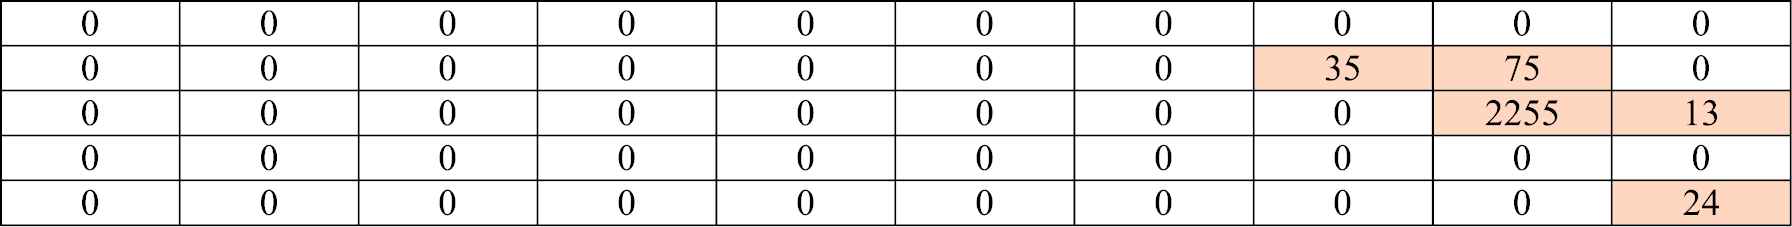
It is found that there are only 2 networks that satisfying C as shown in Figure 5. The overall variance of the survey variable is 81231457 and the two networks consisting of size 7 contains the within-network variances 1042.286 and 574239554.1 respectively. The within-network variances accounting a large portion of the overall variance indicating that the ACS estimators will perform better than the estimators under conventional sampling design. The transformed populations of survey and auxiliary variables are summarized in Figures 6–8.

Simulated y-values using model (3).
Transformed population of blue-winged teal
Transformed population of green-winged teal
Transformed population of survey variable
Due to the high variability in the data, one hundred thousand iterations have been looped for all the estimators on various initial and their corresponding expected sample sizes. The amount of ARB and REs of all the adaptive and non-adaptive estimators are given in Tables 3 and 4.
| 2 | 9.80 | 28.61 | 17.34 | 0.08 | 2.82 | 2.41 | 2.23 | 2.10 | 2.04 |
| 5 | 18.90 | 22.44 | 12.67 | 0.06 | 2.26 | 1.82 | 1.63 | 1.23 | 1.23 |
| 10 | 28.76 | 19.65 | 8.43 | 0.07 | 1.87 | 1.22 | 1.17 | 1.08 | 1.00 |
| 15 | 34.13 | 13.40 | 5.84 | 0.06 | 1.42 | 1.17 | 1.10 | 0.87 | 0.79 |
| 20 | 37.44 | 8.80 | 4.69 | 0.02 | 1.21 | 1.09 | 1.03 | 0.70 | 0.64 |
| 25 | 39.91 | 6.49 | 3.20 | 0.03 | 1.01 | 0.83 | 0.77 | 0.49 | 0.41 |
ACS, adaptive cluster sampling.
Amount of absolute relative bias conventional and ACS estimators.
| 2 | 9.80 | 0.00 | 1.42 | 90.76 | 107.10 | 153.23 | 287.54 | 359.54 | 383.18 |
| 5 | 18.90 | 0.03 | 1.73 | 103.75 | 116.27 | 173.61 | 316.89 | 611.20 | 636.52 |
| 10 | 28.76 | 0.04 | 2.03 | 105.21 | 130.07 | 186.77 | 667.43 | 926.54 | 987.38 |
| 15 | 34.13 | 0.03 | 3.33 | 106.63 | 173.45 | 237.15 | 915.93 | 1533.76 | 1611.65 |
| 20 | 37.44 | 0.04 | 5.57 | 116.04 | 194.43 | 248.12 | 1209.65 | 1746.02 | 1804.44 |
| 25 | 39.91 | 0.03 | 5.63 | 125.23 | 210.43 | 264.64 | 1506.06 | 1896.32 | 2151.65 |
ACS, adaptive cluster sampling.
Amount of relative efficiency conventional and ACS estimators.
The simulation results of ARBs and REs summarized in Tables 3 and 4 support the findings obtained from the artificial populations. The REs of the estimators,
5. CONCLUSION
As the numerical study illustrated in Section 4, we infer that the proposed generalized exponential estimator is able to provide better results for the estimation of rare and clustered population variance at different level of rarity and aggregation. The performance of the proposed estimator is better than all the adaptive and non-adaptive estimators considered in this paper. In simulation study performed on artificial populations, it is observed that the estimators,
CONFLICT OF INTEREST
The author declares that there is no conflict of interests regarding the publication of this paper.
Funding Statement
The authors received no financial support for the research, authorship, and/or publication of this article.
ACKNOWLEDGMENTS
The first author is thankful to the Higher Education Commission of Pakistan for awarding International Research Support Fellowship. The authors are grateful to the Editor in Chief and anonymous referees for their careful reading and constructive suggestions.
APPENDIX A
| Estimators | Estimators | ||||||||
|---|---|---|---|---|---|---|---|---|---|
| 0 | 0 | 1 | 1 | 1 | 2 | ||||
| 1 | 0 | 1 | 1 | 2 | 1 | ||||
| 1 | 0 | 1 | 1 | 1 | 2 | 2 | |||
| 1 | 0 | 2 | 1 | −1 | 1 | 1 | |||
| −1 | 0 | 1 | −1 | 1 | 2 | ||||
| −1 | 0 | 1 | 1 | −1 | 2 | 1 | |||
| −1 | 0 | 2 | 1 | −1 | 2 | 2 | |||
| 0 | 1 | −1 | 1 | 1 | 1 | ||||
| 0 | 1 | 1 | −1 | 1 | 1 | 2 | |||
| 0 | 1 | 2 | −1 | 1 | 2 | 1 | |||
| 0 | 1 | −1 | 1 | 2 | 2 | ||||
| 0 | 1 | 1 | −1 | −1 | 1 | 1 | |||
| 0 | 1 | 2 | −1 | −1 | 1 | 2 | |||
| 1 | 1 | −1 | −1 | 2 | 1 | ||||
| 1 | 1 | 1 | 1 | −1 | −1 | 2 | 2 |
Family of the proposed generalized exponential estimator
REFERENCES
Cite this article
TY  - JOUR
AU  - Muhammad Nouman Qureshi
AU  - Ayesha Iftikhar
AU  - Muhammad Hanif
PY  - 2019
DA  - 2019/12/09
TI  - Generalized Exponential Estimator for the Estimation of Clustered Population Variance in Adaptive Cluster Sampling
JO  - Journal of Statistical Theory and Applications
SP  - 416
EP  - 424
VL  - 18
IS  - 4
SN  - 2214-1766
UR  - https://doi.org/10.2991/jsta.d.191204.001
DO  - 10.2991/jsta.d.191204.001
ID  - Qureshi2019
ER  -