
Anomaly Detection Using Convolutional Adversarial Autoencoder and One-class SVM for Landslide Area Detection from Synthetic Aperture Radar Images
- DOI
- 10.2991/jrnal.k.210713.014How to use a DOI?
- Keywords
- Anomaly detection; adversarial autoencoder; one-class SVM; synthetic aperture radar
- Abstract
An anomaly detection model using deep learning for detecting disaster-stricken (landslide) areas in synthetic aperture radar images is proposed. Since it is difficult to obtain a large number of training images, especially disaster area images, with annotations, we design an anomaly detection model that only uses normal area images for the training, where the proposed model combines a convolutional adversarial autoencoder, principal component analysis, and one-class support vector machine. In the experiments, the ability in detecting normal and abnormal areas is evaluated.
- Copyright
- © 2021 The Authors. Published by Atlantis Press International B.V.
- Open Access
- This is an open access article distributed under the CC BY-NC 4.0 license (http://creativecommons.org/licenses/by-nc/4.0/).
1. INTRODUCTION
In Japan, typhoons often approach and pass from July to September every year because of the effects of westerly winds and high atmospheric pressures. Landslide disasters frequently occur due to heavy rains caused by typhoons, which leads to major accidents related to transportation and human life. Until now, observation of the disaster areas, e.g., landslides, has been mainly conducted by aircraft [1]. However, in recent years, remote sensing using satellite images has attracted attention as a method for observing a wide area [2]. In satellite remote sensing, a sensor is mounted on an artificial satellite to observe the ground surface of the earth, and the obtained image is analyzed. Therefore, we can see the damages without going directly to the disaster areas. Typical satellite images include optical images that are obtained from sunlight reflection, and Synthetic Aperture Radar (SAR) images that are obtained by sensors that emit microwaves to the ground surface. It is easy for human eyes to interpret optical images, but they cannot be observed at night or in bad weather. On the other hand, SAR can observe the surface of the earth regardless of time and weather; thus, SAR images are useful for rapid rescue activities at night and in bad weather conditions. However, it is difficult for human eyes to interpret SAR images, unlike optical images. Therefore, many methods that analyze SAR images have been proposed to detect disaster areas rapidly [3,4], and machine learning techniques, especially deep learning, have also been applied to landslide area detection [5].
When deep learning is applied to disaster area detection, a large number of training samples are necessary. However, shooting conditions of SAR images are different time by time, e.g., seasons, and it is also difficult to obtain a sufficient number of training samples with annotation (correct class labels) immediately after a disaster occurs. To overcome this problem, we propose an anomaly detection system that detects abnormal images that deviate from normal images. The proposed method uses only normal images for the training without using abnormal (disaster) images. Normal images are relatively easy to obtain compared with abnormal images; thus anomaly detection is useful in a practical situation of disaster area detection. The proposed method consists of a feature extraction part and a detection part. The feature extraction is realized by Convolutional Adversarial Autoencoder (CAAE) [6,7] and Principal Component Analysis (PCA). CAAE is an extension of Adversarial Autoencoder (AAE) [8], where the layers of AAE are replaced with convolution and deconvolution layers. CAAE is trained with unsupervised learning; thus the cost of the annotation is not necessary. The detection part is realized by One-Class Support Vector Machine (OCSVM) [9–11] that detects outliers that deviate from the normal region.
This paper is organized as follows. In Section 2, the mechanism and features of SAR are introduced. In Section 3, the proposed method that combines CAAE, PCA, and OCSVM is explained. In Section 4, the experimental conditions and results are described. Finally, Section 5 is devoted to conclusion.
2. SYNTHETIC APERTURE RADAR
Synthetic aperture radar is an active image radar that synthesizes small antennas mounted on a platform, such as an aircraft or satellite, to realize large virtual antennas and generates high-resolution radar images [12–14]. Because SAR is an active sensor that emits microwaves, it is possible to observe the surface of the earth regardless of the presence or absence of sunlight and clouds. SAR images are applied to the research fields of agriculture, disaster, oceans, earth science, and so on [15,16]. SAR emits microwaves and receives the reflected microwaves from the ground surface (Figure 1). When a microwave emitted from the SAR antenna enters a conductor or dielectric, a current is induced, and the microwave is reemitted from the induced current. This is called scattering and scattering in the opposite direction of the incident wave is called backscattering. Because backscattering is the diffuse reflection caused by scattering, backscattering is different from specular reflection.
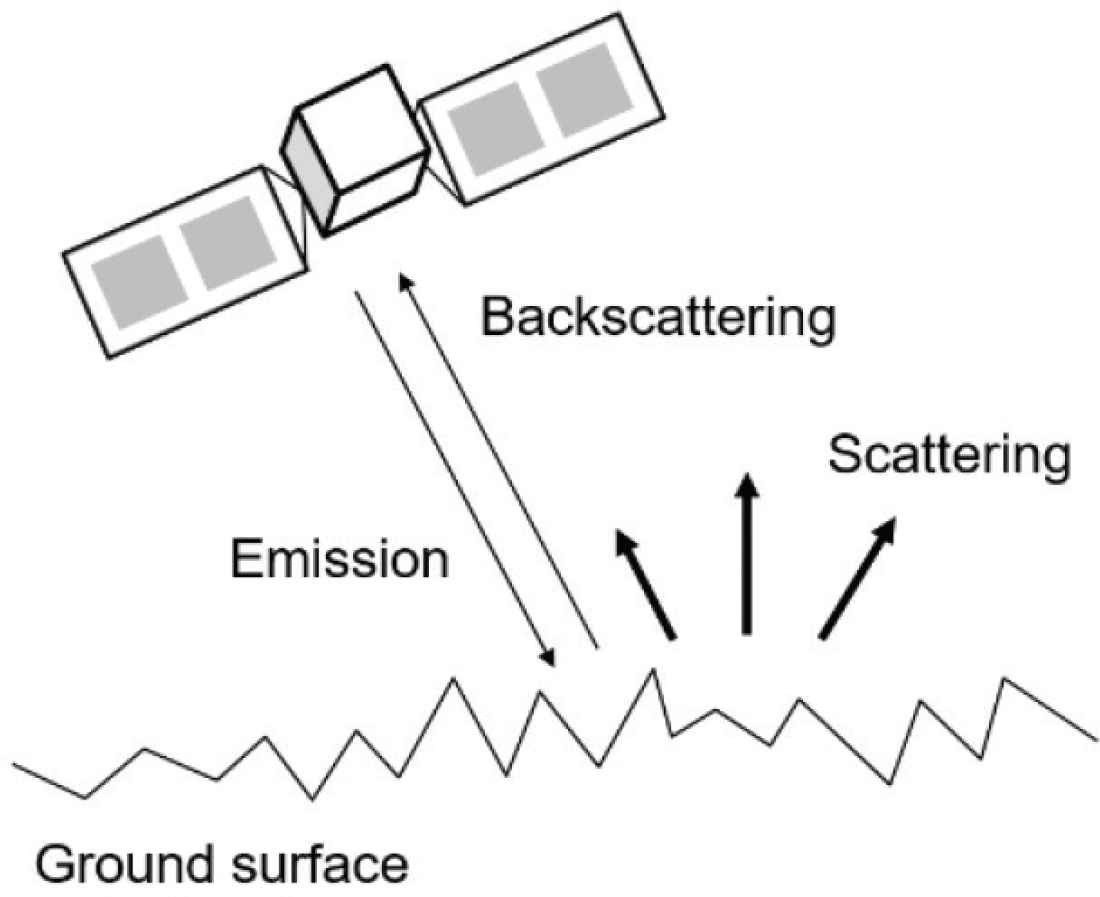
Microwave emission, scattering, and backscattering of SAR [14]
Synthetic aperture radar receives the backscattering and executes image reproduction. The scattering intensity of the microwaves strongly depends on the frequency, wavelength, and electric characteristics (dielectric constant, etc.) of the scatterer. Therefore, for example, seawater or cars made of metal strongly reflect microwaves because a current is easily induced. On the other hand, sand and trees have low reflectivity because hardly any current is induced. In each pixel of SAR images, the intensity of the received microwave is recorded. A SAR image used in this paper was taken by Advanced Land Observing Satellite No. 2 (ALOS-2). ALOS-2 is used in a variety of fields such as disaster monitoring, observation of forest distribution, and crustal movement measurement. In particular, ALOS-2 can detect changes in the distance from the satellite to the ground of the earth with an accuracy of centimeters, which contributes to detailed understandings of earthquakes, volcanic activities, and heavy rains. The main purpose of ALOS-2 is to ensure the safety of our daily lives and to solve global environmental problems [17].
3. MATERIALS AND METHODS
3.1. Dataset
A SAR image used in this paper is shown in Figure 2. It shows the northern Kyushu area in Japan on July 7, 2017, where large-scale landslides, due to the torrential rain from July 5 to 6, 2017, occurred in this area. The red areas in Figure 2 shows the locations of the landslide that were annotated based on the information provided by the Geospatial Information Authority of Japan [18]. The size of the image is 6648 × 4360 [pixels] and the resolution per pixel is about 3 m2.
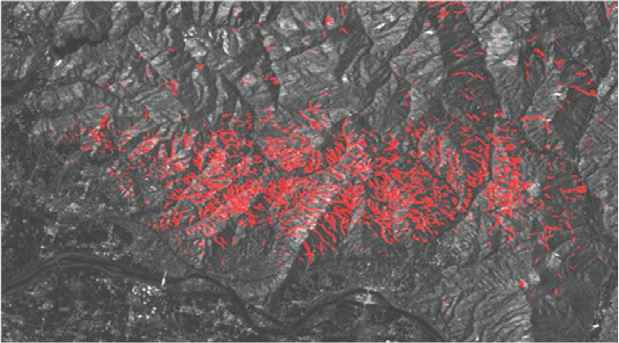
SAR image and landslide areas (red areas).
In this paper, Region of Interest (ROI)-based anomaly detection was carried out, that is, we first divided the whole SAR image into 128 × 128 [pixels] ROI images. Figure 3 shows examples of normal and abnormal ROI images. Note that the target area for the detection of normal and abnormal is the central 32 × 32 [pixels] area of each ROI as shown in Figure 4. The surrounding area of the target area is used as a piece of supporting information (context) for the detection. The ROI images were split into training data including normal only, testing data of normal, and testing data of abnormal.
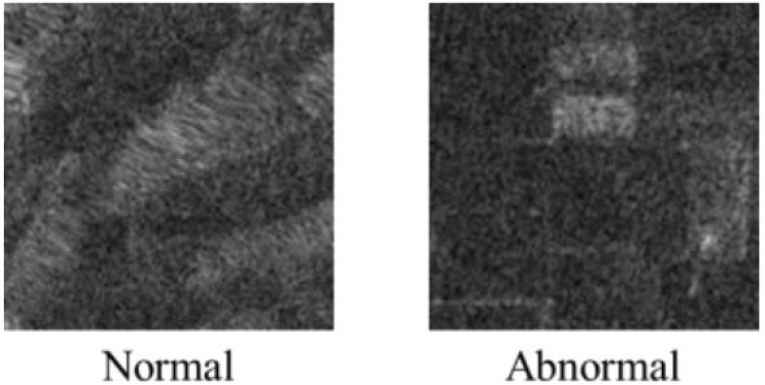
Examples of 128 × 128 [pixels] ROI images.
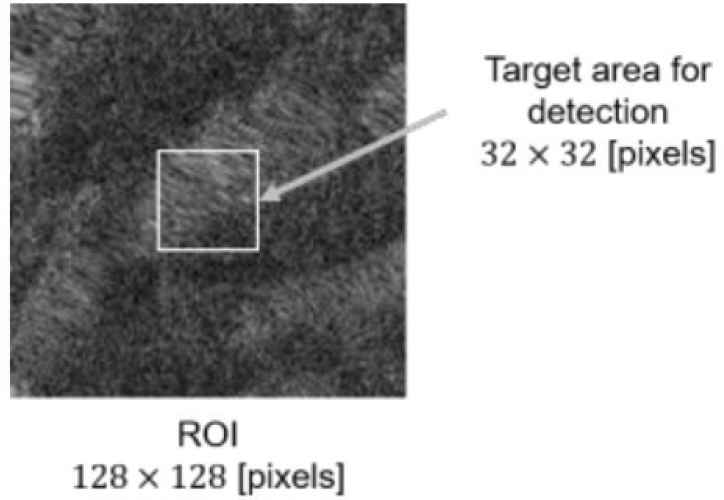
ROI and a target area for detection.
3.2. Method
The overview of the anomaly detection model designed in this paper is shown in Figure 5. The feature extraction from SAR images are realized by CAAE that transforms input image x to feature vector z. Then, z is transformed to z′ by PCA for dimensionality reduction, and finally OCSVM classifies z′ as normal or abnormal.
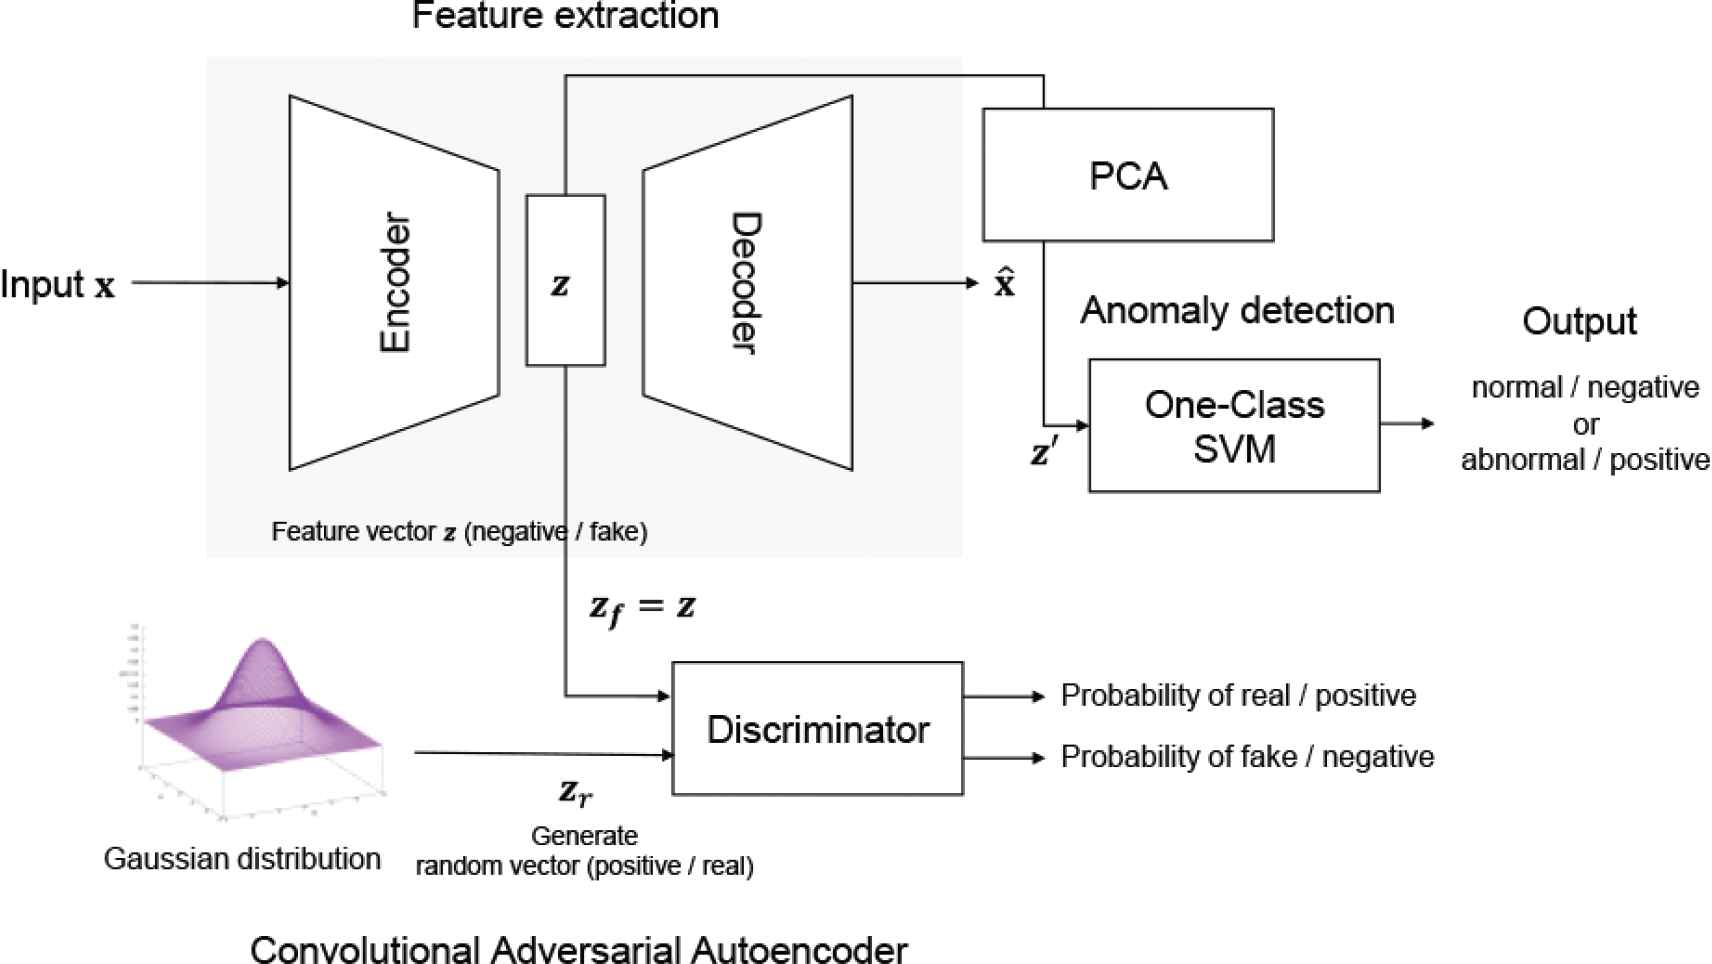
Overview of the proposed method.
3.2.1. Feature extraction using convolutional adversarial autoencoder
In this paper, the extended model of AAE, named CAAE, is used for the feature extraction. Figure 6 shows the detailed structure of CAAE that extracts feature vectors from ROI images. The upper part of Figure 6 is a CAE that contains an encoder and a decoder. The encoder outputs a 128-dimensional feature vector z, and the decoder outputs a reconstructed ROI image. The encoder consists of some Block1 and fully-connected layers, where a Block1 contains convolution and max-pooling layers along with batch normalization [19] and Rectified Linear Unit (ReLU) [20]. The decoder consists of some Block2, fully-connected and deconvolution layers, where a Block2 contains a deconvolution layer along with batch normalization and ReLU. The loss function (LOSS1 in Figure 6) is the mean squared error between the input and output images, and the weights of the encoder and decoder are updated by error backpropagation with Adam [21] to minimize LOSS1. As the learning of minimizing LOSS1 proceeds, the images generated by the decoder gradually match the input images and feature z can contain important information that is necessary to reconstruct the input images. The encoder and discriminator at the lower part of Figure 6 are adversarial networks, where the discriminator distinguishes vectors generated by Gaussian distribution (regarded as positive or real samples) zr from feature vector z inputted from the encoder (regarded as negative or fake samples). The loss function (LOSS2 in Figure 6) is the softmax cross-entropy based on the positive and negative probabilities outputted by the discriminator. The discriminator updates the weights to minimize LOSS2, while the encoder updates the weights to maximize LOSS2. Here, we explain the meaning of learning with LOSS2. Maximizing LOSS2 means that the encoder aims to cheat the discriminator so that the discriminator misclassifies the negative samples as positive samples. On the other hand, minimizing LOSS2 means that the discriminator aims to correctly classify positive and negative samples. As a result of the above adversarial learning, the distribution of feature vector z gradually follows Gaussian distribution. This adversarial learning is a kind of regularization to avoid overfitting by imposing a constraint on the feature distribution.
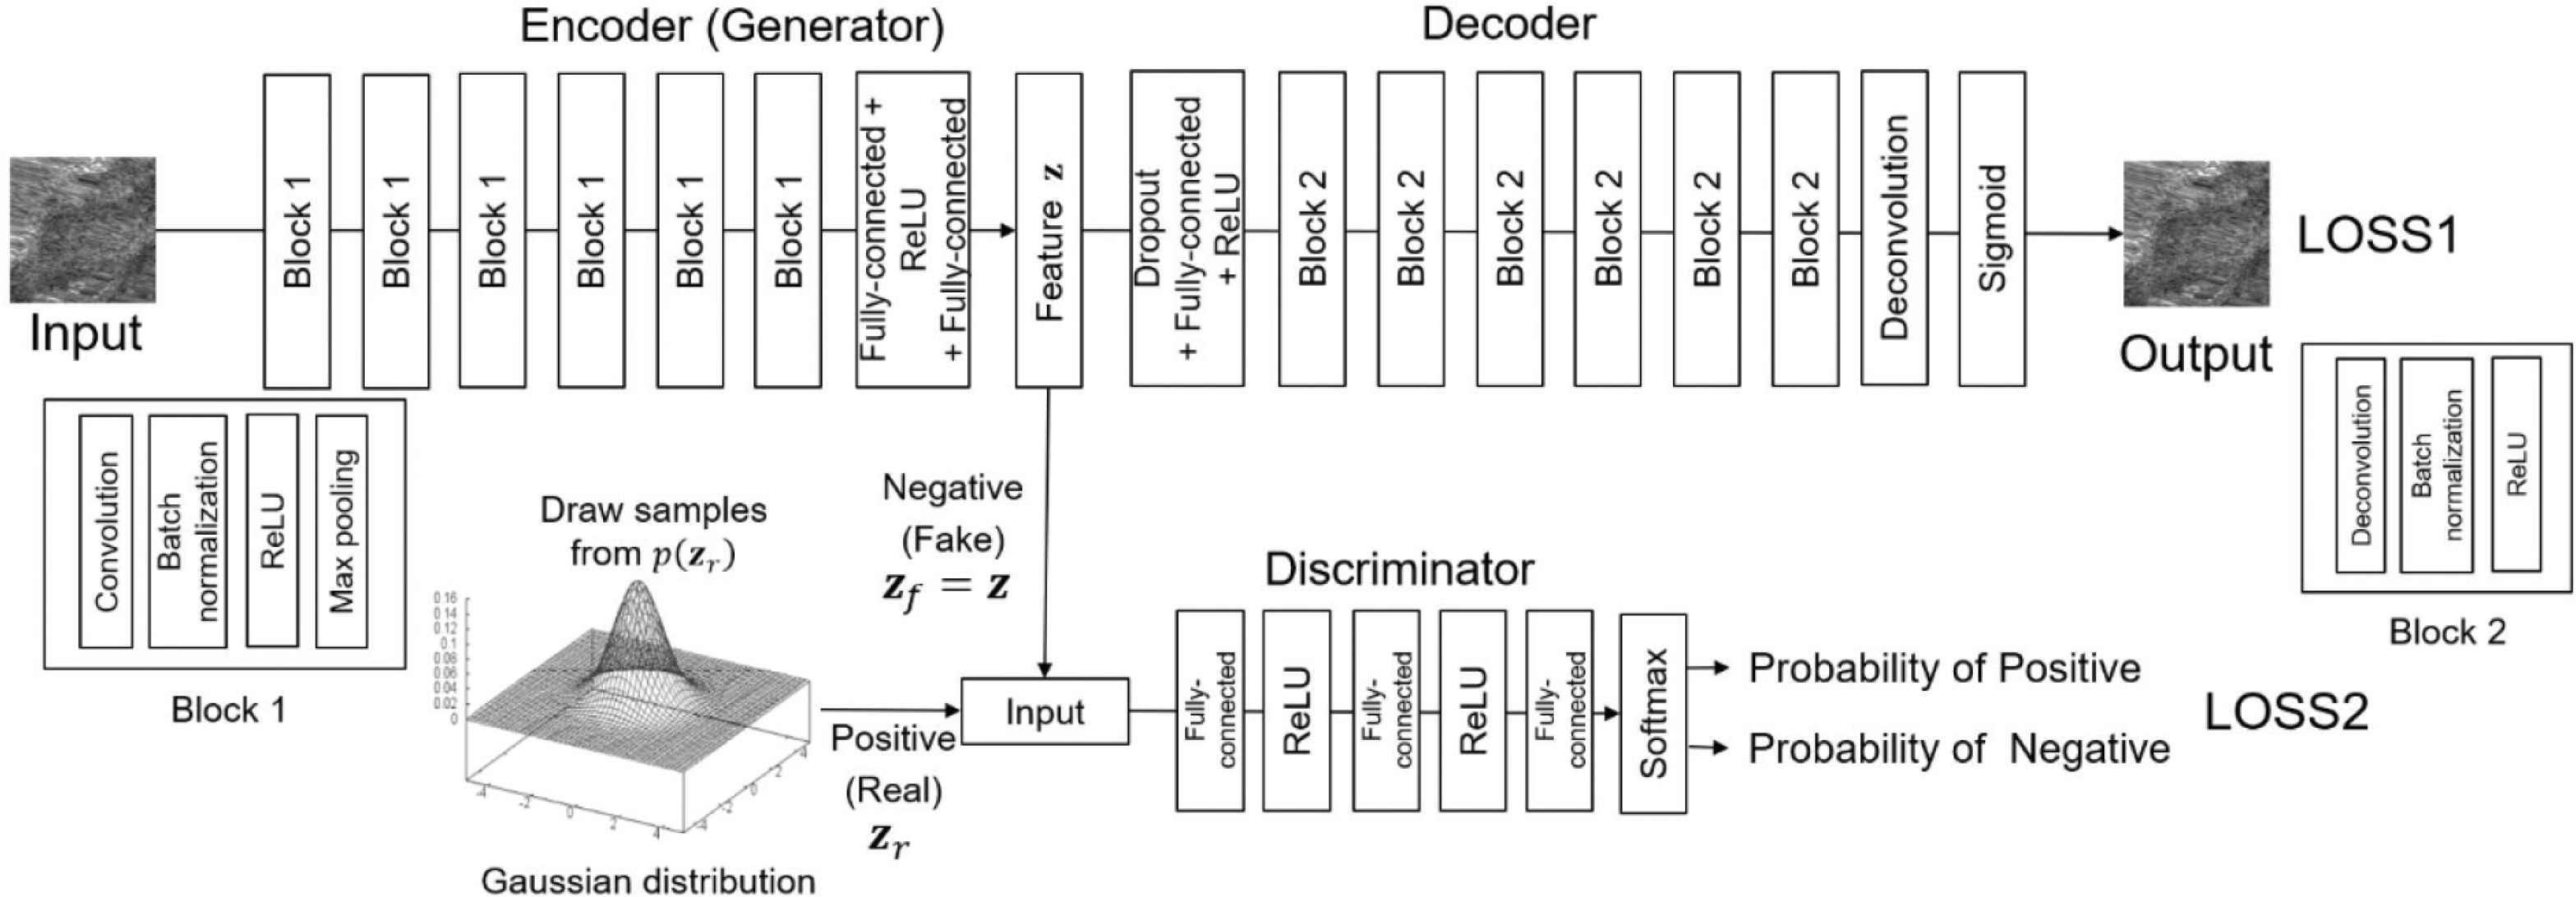
The detailed structure of CAAE.
3.3. Dimensionality Reduction by PCA and Anomaly Detection by One-Class Support Vector Machine
The feature vector z generated by CAAE is transformed to z′ by PCA. PCA executes a linear mapping of feature vectors to a low-dimensional space, where the variance of the vectors in the low-dimensional space is maximized. In this paper, 128 dimensions of z are reduced to 40 dimensions by applying PCA. Then, z′ is inputted to OCSVM. SVM is originally a supervised-learning-based classification algorithm for two classes, which needs training data with class labels. OCSVM needs only one-class data for the training, where it generates areas of the trained class in the feature space. After the training, OCSVM regards the data that deviates from the areas of the trained class as outliers, i.e., abnormal. OCSVM has a parameter ν that determines the proportion of normal and abnormal areas. For example, when ν is set at a large value as shown in Figure 7 (left), the normal area becomes small. In this case, only the data that is very near to the center of the normal area is regarded as normal, which increases the sensitivity of abnormal but may increase false positives, in other words, the true negative (normal) is misclassified as positive (abnormal). Conversely, when ν is small, the normal area becomes large, which increases the specificity, but may increase false negatives, in other words, the true positive (abnormal) is regarded as negative (normal). Therefore, the value of ν should be determined carefully considering the trade-off between false positive and false negative.
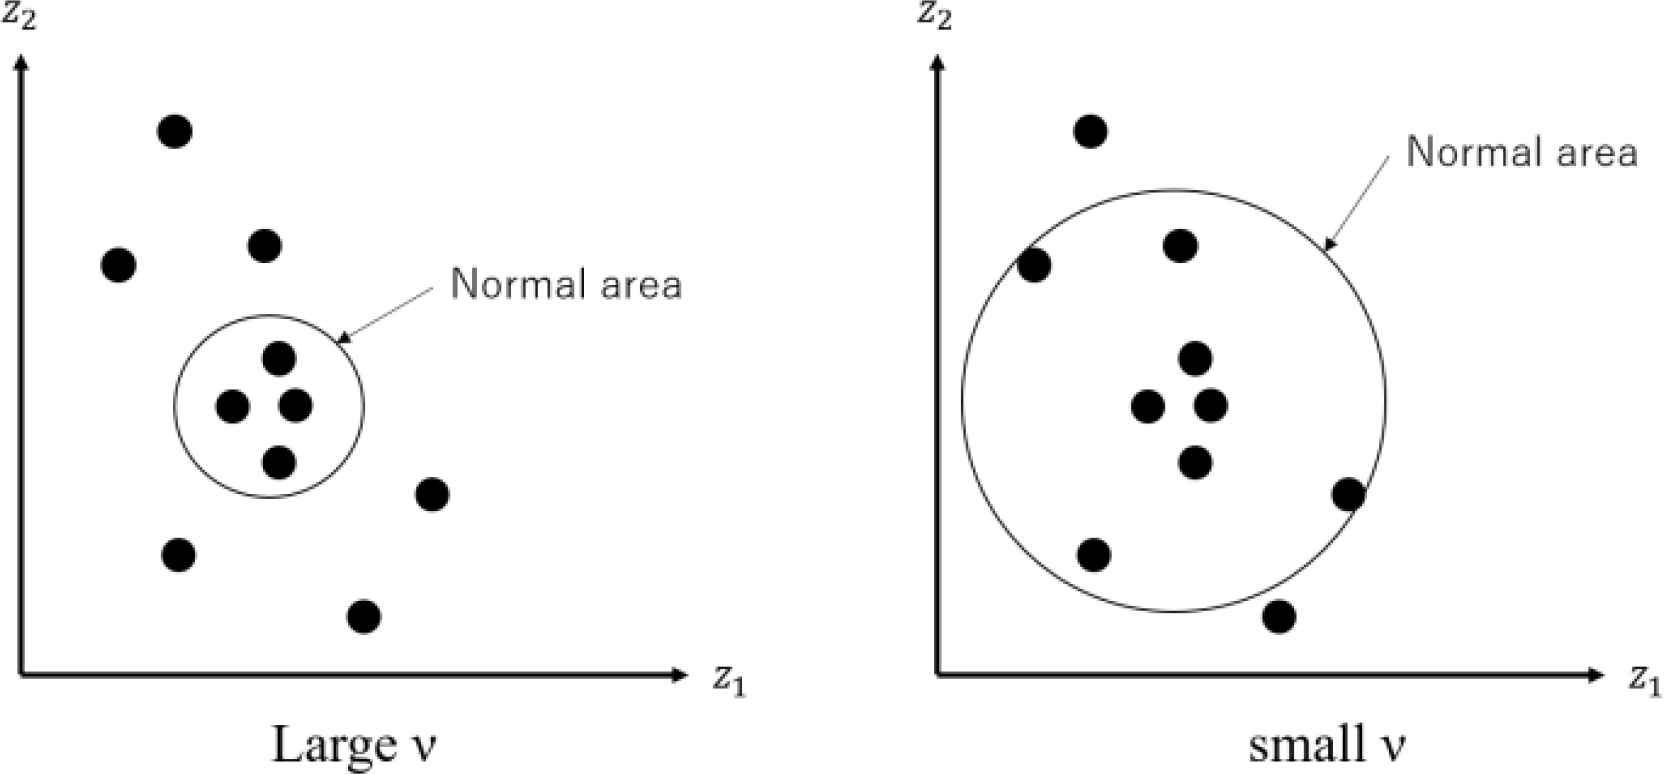
Effects of ν in OCSVM.
4. EXPERIMENTS
4.1. Condition 1
The class labels of ROIs were given by the following rule. When 60% or more area of the central 32 × 32 area of each ROI contains the abnormal area, it is regarded as abnormal, otherwise, normal. The number of training data (normal only), that of testing data (normal), and that of testing data (abnormal) are shown in Table 1. CAAE was trained on the training data and all the training data were encoded as feature vectors. Then, PCA was applied to the feature vectors to reduce the number of dimensions from 128 to 40. The feature vectors after the dimensionality reduction are used to train OCSVM. Finally, the testing images encoded and transformed by the trained CAAE and PCA were classified as normal or abnormal by OCSVM.
| Training/Testing | The number of images |
|---|---|
| Training (normal only) | 13,542 |
| Testing (normal) | 164 |
| Testing (abnormal) | 164 |
The numbers of ROI images in condition 1
Table 2 shows accuracy, sensitivity, specificity, and precision obtained by the combination of CAE, PCA, and OCSVM (called the conventional method), and Table 3 shows those obtained by the combination of CAAE, PCA, and OCSVM (called the proposed method). The best accuracy obtained by the conventional method is 55.7% (ν = 0.5) and that obtained by the proposed method is 57.9% (ν = 0.4). Therefore, we can see that CAAE is better than CAE as a feature extraction method; however, there is a large room for improvement on the accuracy. Regarding the sensitivity, specificity, and precision, the conventional method shows higher sensitivity than the proposed method when ν is large, while the proposed method shows higher specificity. Although the conventional method can find more abnormal data than the proposed method, the precision of the proposed method for all the settings of ν is better than the conventional method. Therefore, we can say that the proposed method makes positive predictions when it has high confidence, which results in smaller false positives.
| ν | |||||||
|---|---|---|---|---|---|---|---|
| 0.2 | 0.3 | 0.4 | 0.5 | 0.6 | 0.7 | ||
| Evaluation metric (%) | Accuracy | 53.4 | 54.9 | 55.6 | 55.7 | 49.4 | 47.4 |
| Sensitivity | 23.4 | 32.1 | 41.1 | 51.1 | 56.1 | 63.8 | |
| Specificity | 83.4 | 77.8 | 70.1 | 60.3 | 42.7 | 31.1 | |
| Precision | 58.5 | 59.1 | 57.9 | 56.3 | 49.5 | 48.1 | |
Results obtained by CAE + PCA + OCSVM (Conventional method) in condition 1
| ν | |||||||
|---|---|---|---|---|---|---|---|
| 0.2 | 0.3 | 0.4 | 0.5 | 0.6 | 0.7 | ||
| Evaluation metric (%) | Accuracy | 55.9 | 56.6 | 57.9 | 57.4 | 54.4 | 52.4 |
| Sensitivity | 24.5 | 31.5 | 37.1 | 39.4 | 41.9 | 47.2 | |
| Specificity | 87.3 | 81.6 | 78.7 | 75.4 | 66.9 | 57.6 | |
| Precision | 65.9 | 63.1 | 63.5 | 61.6 | 55.9 | 52.7 | |
Results obtained by CAAE + PCA + OCSVM (Proposed method) in condition 1
4.2. Condition 2
In condition 2, the class labels of ROIs were given by the following rule. The rule of abnormal areas is the same as condition 1, that is, when 60% or more area of each ROI contains abnormal, it is regarded as abnormal. In the case of the labeling of normal, ROIs without containing any abnormal areas are regarded as normal. In condition 1, the threshold that separates the normal and abnormal ROIs was 60%, which means that even if the ROIs contain 59% abnormal areas, they should be classified as normal. To clearly separate the features of normal and abnormal, condition 2 adopted the above labeling rule. Table 4 shows the numbers of training and testing data. The procedure of executing CAAE, PCA, and OCSVM is the same as condition 1.
| Training/Testing | The number of images |
|---|---|
| Training (normal only) | 7967 |
| Testing (normal) | 164 |
| Testing (abnormal) | 164 |
The numbers of ROI images in condition 2
Table 5 shows the accuracy, sensitivity, specificity, and precision of the conventional method and Table 6 shows those of the proposed method. The best accuracy obtained by the conventional method is 61.4% (ν = 0.2) and that obtained by the proposed method is 66.0% (ν = 0.5); thus we can see that the accuracy becomes better than condition 1 and also the accuracy obtained by the proposed method is better than that by the conventional method. There is a similar tendency in the sensitivity, specificity, and precision as in condition 1. That is, the sensitivity of the conventional method is higher than the proposed method, while the proposed method shows higher specificity and precision. Therefore, the reliability of the positive prediction of the proposed method is better than the conventional method. However, we should improve the sensitivity in the future work to find the abnormal areas as many as possible.
| ν | |||||||
|---|---|---|---|---|---|---|---|
| 0.2 | 0.3 | 0.4 | 0.5 | 0.6 | 0.7 | ||
| Evaluation metric (%) | Accuracy | 61.4 | 60.4 | 61.2 | 59.8 | 58.7 | 56.2 |
| Sensitivity | 39.5 | 47.7 | 56.6 | 64.3 | 68.1 | 73.3 | |
| Specificity | 83.3 | 73.1 | 65.8 | 55.5 | 49.3 | 39.1 | |
| Precision | 70.3 | 63.9 | 62.3 | 59.1 | 57.3 | 54.6 | |
Result obtained by CAE + PCA + OCSVM (Conventional method) in condition 2
| ν | |||||||
|---|---|---|---|---|---|---|---|
| 0.2 | 0.3 | 0.4 | 0.5 | 0.6 | 0.7 | ||
| Evaluation metric (%) | Accuracy | 64.0 | 64.8 | 65.5 | 66.0 | 62.7 | 59.6 |
| Sensitivity | 39.6 | 44.4 | 50.0 | 54.8 | 56.9 | 60.6 | |
| Specificity | 88.3 | 85.1 | 80.9 | 77.2 | 68.5 | 58.5 | |
| Precision | 77.2 | 74.9 | 72.4 | 70.6 | 64.4 | 59.4 | |
Result obtained by CAAE + PCA + OCSVM (Proposed method) in condition 2
5. CONCLUSION
In this paper, we proposed an anomaly detection method to classify normal (non-disaster) areas and abnormal (disaster/landslide) areas, where the proposed method consists of CAAE, PCA, and OCSVM. In the experiments, we evaluated the detection performance in the two conditions. From the results, it was clarified that CAAE is better than CAE as a feature extraction method. The remaining problem is the classification of ROI images that contain small abnormal areas. Since it is difficult to make a sharp boundary between normal and abnormal, other methods such as segmentation models would be useful. Also, the proposed method should be evaluated using other SAR images to confirm the detection ability.
CONFLICTS OF INTEREST
The authors declare they have no conflicts of interest.
ACKNOWLEDGMENT
This work was supported by JSPS KAKENHI Grant Number JP20H02417.
AUTHORS INTRODUCTION
Dr. Shingo Mabu
 He received his B.E. and M.E. degrees from Kyushu University, Japan, in 2001 and 2003, respectively, and his PhD degree from Waseda University, Japan, in 2006. From 2006 to 2007, he was a visiting lecturer at Waseda University, and from 2007 to 2012, he was an Assistant Professor at the same university. From 2012 to 2017, he was an Assistant Professor at Yamaguchi University, Japan, and from 2017 to 2020, he was an Associate Professor at the same university. Since 2020, he has been a Professor at the same university.
Mr. Soichiro Hirata
 He received his B.E. and M.E. degrees from Yamaguchi University, Japan in 2018 and 2020, respectively. He is currently working at NEC Corporation.
Dr. Takashi Kuremoto
 He received his B.E. degree from the University of Shanghai for Science and Technology, China, in 1986 and his M.E. and PhD degrees from Yamaguchi University, Japan, in 1996 and 2014, respectively. He worked as a system engineer at the Research Institute of Automatic Machine of Beijing from 1986 to 1992, and until 2021, he was an Assistant Professor at Yamaguchi University. He was an Academic Visitor of the School of Computer Science, The University of Manchester, U.K., in 2008. Currently, he is a Full Professor with the Department of Information Technology and Media Design, Nippon Institute of Technology, and visiting researcher of The University of Tokyo. His research interests include artificial neural networks, fuzzy, evolutionary computation, time series forecasting, and intelligent systems.
REFERENCES
Cite this article
TY  - JOUR
AU  - Shingo Mabu
AU  - Soichiro Hirata
AU  - Takashi Kuremoto
PY  - 2021
DA  - 2021/07/24
TI  - Anomaly Detection Using Convolutional Adversarial Autoencoder and One-class SVM for Landslide Area Detection from Synthetic Aperture Radar Images
JO  - Journal of Robotics, Networking and Artificial Life
SP  - 139
EP  - 144
VL  - 8
IS  - 2
SN  - 2352-6386
UR  - https://doi.org/10.2991/jrnal.k.210713.014
DO  - 10.2991/jrnal.k.210713.014
ID  - Mabu2021
ER  -