
The R&D Strategy of Automobile Companies in Radical Innovation
- DOI
- 10.2991/jrnal.k.200909.009How to use a DOI?
- Keywords
- Technological discontinuities; radical innovation; R&D strategy; automobile companies; patent analysis
- Abstract
This paper focuses on patterns of innovation and the R&D strategy of automobile companies for technological changes. Tushman and Anderson (1986) pointed out that there are two types of technological changes: incremental technological change and radical technological change. In particular, radical technological change may largely affect existing companies and new entrants for gaining competitive advantage in the emerging market. To examine this proposition, we use the patent information of existing automobile company (Toyota) and new entrants (Tesla, BYD) to analyze their R&D strategies on electric vehicle by social network analysis and cluster analysis. The analyses in this paper include the following: (1) To capture the radical and incremental technological changes from each company’s R&D projects, and visualize these changes, (2) To examine the relationship between technological discontinuities and the R&D strategies of automobile companies. We conclude that patterns of corporate R&D strategy that cope with the threat of radical technological changes differ from company in automobile industry, and we suggest the reason that cause this difference.
- Copyright
- © 2020 The Authors. Published by Atlantis Press B.V.
- Open Access
- This is an open access article distributed under the CC BY-NC 4.0 license (http://creativecommons.org/licenses/by-nc/4.0/).
1. INTRODUCTION
This paper focuses on patterns of innovation and the R&D strategies of automobile companies for these technological changes. Tushman and Anderson [1] point out that there are two types of technological changes. One is incremental technological change which is often generated by existing companies, and the other is radical technological change which sometime makes great extension in business environment and destroys the orders of existing companies. Nowadays, traditional automobile industry is faced with new challenges due to radical technological change such as Car connectivity, Autonomous or assisted driving, new mobility or car Sharing, Electrified powertrains and components (CASE). New entrants, such as Tesla and BYD, are competing with existing companies, such as Toyota, in R&D on electric vehicle. We suppose that R&D management can play a great role for gaining competitive advantage.
Radical technological change may be happened and has impact on existing and new automobile companies’ competitive advantages in the emerging market. To examine this proposition, we use the patent information of three automobile companies, the existing giant Toyota, new powerful entrants Tesla and BYD, to analyze their R&D strategies on electric vehicle by social network analysis and cluster analysis. The analyses in this paper include the following: (1) To capture the radical and incremental technological changes from each company’s R&D projects, and visualize these changes, (2) To examine the relationship between technological discontinuities and company’s R&D strategies.
2. BACKGROUND
2.1. Technological Discontinuities
Abernathy [2] describes a dynamic model of innovation which includes a pattern of sequential and cross-sectoral changes in product innovation, process innovation, and organizational structure. Firms that are new to a product area will exhibit a fluid pattern of innovation and structure. As the market develops, a transitional pattern will emerge. Finally, the market stabilizes, and fosters a specific pattern of behavior.
Tushman and Anderson [1] demonstrate that technology evolves through periods of incremental changes, punctuated by technological breakthroughs which enhance or destroy the competence of firms in an industry. These breakthroughs, or technological discontinuities, significantly increase environmental uncertainty and munificence. They point out that while competence-destroying discontinuities are initiated by new firms and are associated with increased environmental turbulence, competence-enhancing discontinuities are initiated by existing firms and are associated with decreased environmental turbulence. Therefore, a radical innovation can create new businesses and transform or destroy existing ones.
Anderson and Tushman [3] suggest that the key punctuation points are technological discontinuities and dominant designs; these delimit eras of ferment and eras of incremental change. Since technological innovation has great impact on firms, firms must develop diverse competences both to shape and deal with technological evolution.
2.2. The Overview of Automobile Industry
Although as a new entrant, Tesla gives confidence and expectation to stock investors. For example, Table 1 shows the market value of world top automobile companies, and we can see that Tesla in the United States has higher corporate value than the existing giant GM in the stock market of 2017. In addition, China’s BYD has attracted attention for its global production scale of electric vehicles. For instance, Table 2 illustrates the sales of electric vehicle from 2015 to 2018 based on single model. In 2018, of Tesla’s Model 3 ranks at the top, while BYD rank in the top 1 for the total amount (in company base). Because the technology of electric vehicles nowadays may be radical innovation (product innovation and technological breakthroughs) in the automobile industry, it may also become technological innovation of competence-destroying discontinuities to existing companies. In order to examine whether the technology of electric vehicles has impact on automobile companies’ strategies, we make a comparison of R&D strategies among Toyota, Tesla and BYD.
| Company | Stock price | Market Cap. (billion) |
|---|---|---|
| Toyota | $52 | 172.1 |
| Daimler AG | $73 | 78.3 |
| Tesla Inc. | $364 | 59.7 |
| BMW | $94 | 56.8 |
| SAIC Motor Corp. | $5 | 53.2 |
| General Motors | $34 | 51.9 |
| Honda | $28 | 50.3 |
| Volkswagen | $154 | 45.5 |
| Ford | $11 | 43.3 |
Source: Factset (Jun 2017).
Market value of world top automobile companies
| 2015 | Sales quantity | 2016 | Sales quantity | 2017 | Sales quantity | 2018 | Sales quantity | |
|---|---|---|---|---|---|---|---|---|
| 1 | Tesla Model S | 51,390 | Nissan Leaf | 51,882 | BAIC EC-series | 78,079 | Tesla Model 3 | 145,846 |
| 2 | Nissan Leaf | 43,870 | Tesla Model S | 50,994 | Tesla Model S | 54,715 | BAIC EC-series | 90,637 |
| 3 | Mitsubishi Outlander PHEV | 43,259 | BYD Tang | 31,405 | Toyota Prius Prime/PHV | 50,830 | Nissan Leaf | 87,149 |
| 4 | BYD Qin | 31,898 | Chevrolet Volt | 28,296 | Nissan Leaf | 47,195 | Tesla Model S | 50,045 |
| 5 | BMW i3 | 24,083 | Mitsubishi Outlander PHEV | 27,322 | Tesla Model X | 46,535 | Tesla Model X | 49,349 |
| 6 | Kandi K11 | 20,390 | BMW i3 | 25,934 | Zhidou D2 EV | 42,342 | BYD Qin PHEV | 47,452 |
| 7 | Renault Zoe | 18,846 | Tesla Model X | 25,299 | Renault Zoe | 31,932 | JAC IEV E/S | 46,586 |
| 8 | BYD Tang | 18,375 | Renault Zoe | 22,099 | BMW i3 | 31,410 | BYD e5 | 46,251 |
| 9 | Chevrolet Volt | 17,508 | BYD Qin | 21,868 | BYD Song PHEV | 30,920 | Toyota Prius Prime/PHV | 45,686 |
| 10 | Volkswagen Golf GTE | 17,282 | BYD e6 | 20,610 | Chevrolet Bolt | 27,982 | Mitsubishi Outlander PHEV | 41,888 |
| BYD Song PHEV | 39,318 | |||||||
| BYD Tang PHEV | 37,148 | |||||||
| BYD Yuan | 35,699 | |||||||
Source: Inside of electric vehicles Website.
Sales of electric vehicle (2015–2018)
3. METHODOLOGY AND DATA
In the following sections, the patterns of R&D strategy of each automobile company are analyzed by social network analysis, which can visualize the features of R&D strategies using archived patent information.
We selected patent documents archived in patent database service provided by Patent Integration Co. Ltd. (Risonakudan Bld. 5F, 1-5-6, kudanminami, Chiyoda-ku, Tokyo, Japan). All patents are classified according to the worldwide standard classification codes International Patent Classification (IPC).
This paper utilizes all patents of automobile companies since 2000, including Japan, America, China, and WIPO. First, we extract related patents from the patent database service for collecting patents which are applied by each company. Next, we focus on some patents of electric vehicle such as “Battery (H1), Charging (H2) and Powertrain (B60)”. IPC codes in Table 3 are the most frequently used codes in electric vehicle.
| Sub-technology | Sub-technology breakup | IPC codes |
|---|---|---|
| Energy storage systems | • Batteries | H01M 6/00, H01M 2/00, H01M 8/00, H01M10/00, H01M 12/00 |
| i. Lead-acid batteries | ||
| ii. Lithium ion batteries [Li-ion] | ||
| iii. Nickel metal hydride [NiMH] | ||
| iv. Iron-lithium batteries | ||
| v. Sodium nickel chloride batteries | ||
| • Ultracapacitors, supercapacitors, double layer capacitor | ||
| • Fuel cells, secondary cells, primary cells | ||
| Powertrain | • Electric motor types | B60K 6/20, B60L 15/00, B60W10/08, 60W 20/00 |
| i. AC motor, ii. DC motor, iii. Traction motor, iv. Induction motor | ||
| • Power Trasmission | ||
| i. Gear, ii. Brake, iii. Clutch, iv. Electric drive, v. Inverte, vi. Power converter, vii. Electric propulsion, viii. Electric machine | ||
| Control systems and software for EVs | • Powertrain control | |
| i. Motor controller | ||
| • Vehicle control and management, • Battery control and management | ||
| i. Charging control, ii. Battery management | ||
| • HAVC control and management | ||
| • Software | ||
| i. Vehicle user interface, ii. Charging interface | ||
| EV charging infrastructures and chargers | • Charging | H02J 7/00 |
| • EV charging stations | ||
| • Recharging methods | ||
| Safety in EVs | • Thermal management in batteries | B60K 28/00, B60L3/00, B60R21/01, B60R22/00, B60T17/18, B60W50/02, B62D5/30, B60N2/42, B60R22/00, B60R25/00 |
| • Other safety measures |
Source: World Intellectual Property Organization.
IPC of patents related to electric vehicle
In order to examine target companies’ R&D strategies since 2000, we visualize their patent information in four steps, and then diagrams are created by these analyses. First, we count the number of patent publications of each target company. Second, we conduct social network analysis. Third, each company’s core rigidity, which indicates the extent of core R&D members changed in R&D projects each year, is calculated and is expressed by heat maps. Forth, we run cluster analysis by IPC codes of patents in order to visualize the correlation between technologies that each company developed.
3.1. An Approach based on the Number of Patent Publications
Figure 1 shows that Toyota (see the right axis) has overwhelmingly larger number of patents than other two companies. The R&D investment amount of Toyota is as ten times as TESLA and BYD (see the left axis) may be the reason that causes this gap.
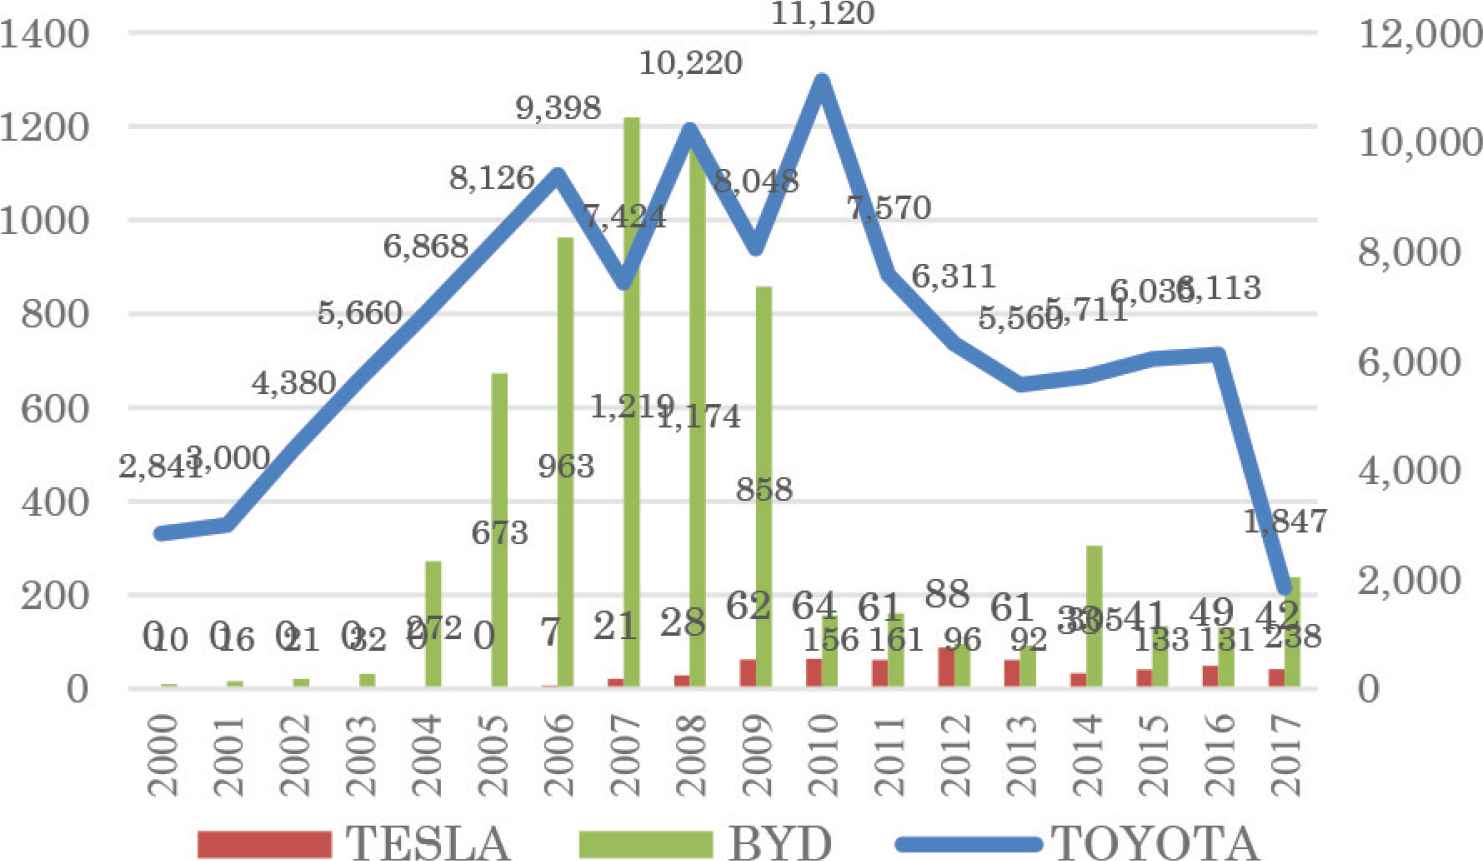
The number of patent applications of Toyota, Tesla, and BYD.
3.2. An Approach by Social Network Analysis
We visualize target companies’ R&D strategies associated with co-inventor of patent publication by social network analysis. Figures 2–4 show the networks of patent co-inventor of Toyota, Tesla and BYD in 2016. There are some blocks (cliques) in the networks of Tesla and BYD. However, existing automobile manufacturer, Toyota owns more complicated relationships of R&D projects which does not consist of blocks.
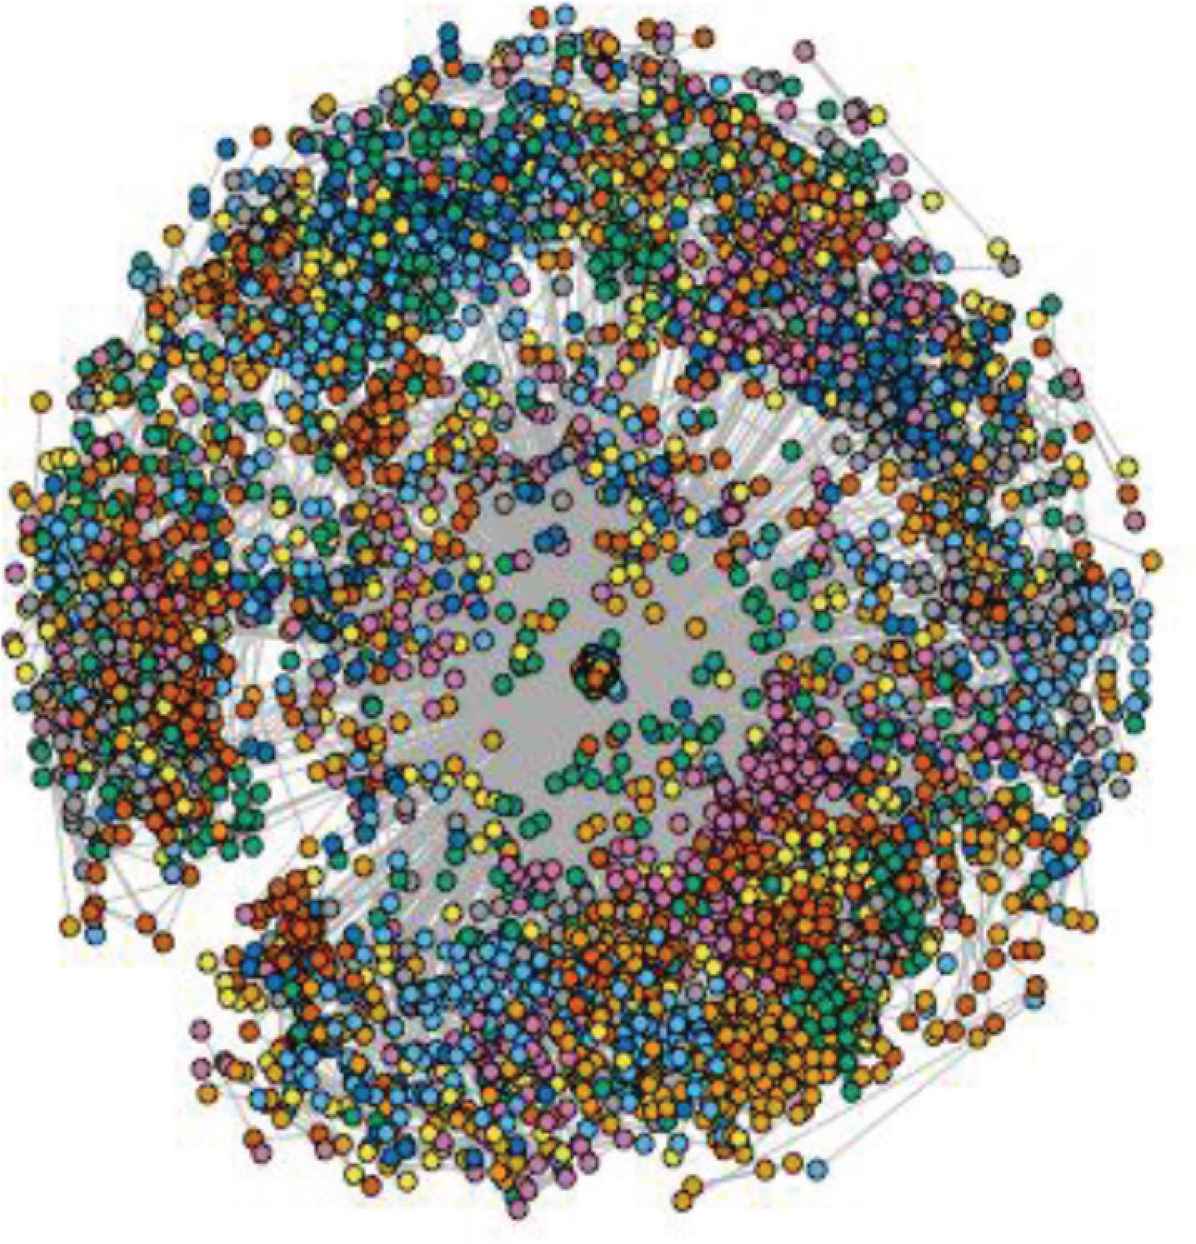
Network of patent co-inventor of Toyota.
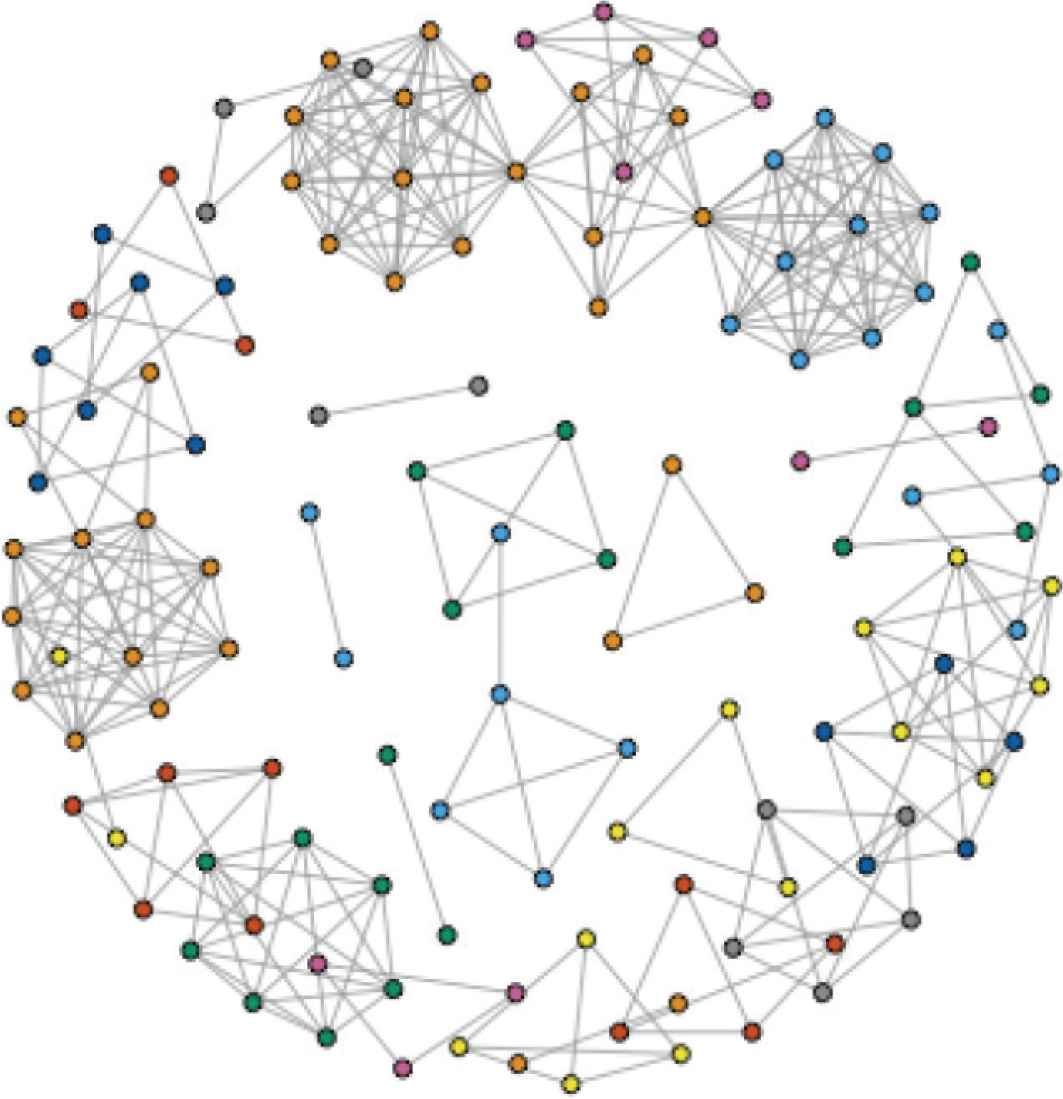
Network of patent co-inventor of Tesla.
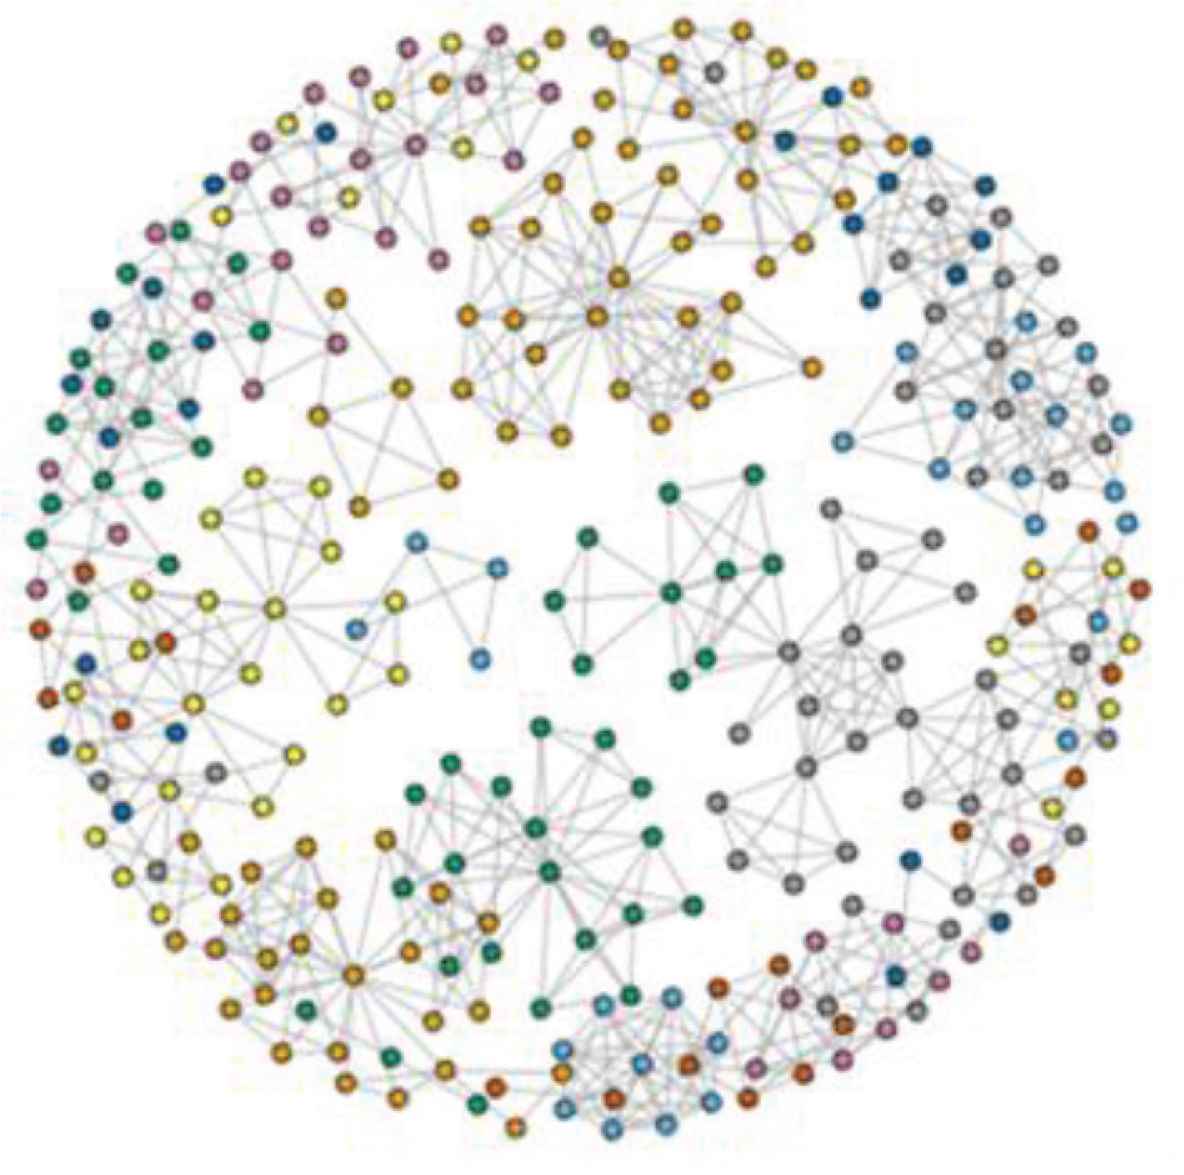
Network of patent co-inventor of BYD.
Modular product architecture is functionally self-contained component with interfaces well defined, and integrated product architecture are components designed or adapted for the specific product geometric or functional relationships tightly coupled. Therefore, we suggest that structures of R&D projects of Tesla and BYD are likely to follow the modular architecture of electric vehicles, and Toyota’s project organizations correspond to integrated type of product architecture.
3.3. An Approach by Core Rigidities
Figures 5–7 are the heatmaps created to express the core rigidities of target companies. As mentioned above, core rigidities show that if the same core members have been continuously active in R&D projects, which also indicate the extent of technologies discontinuity conversely. From these heat maps, since the lighter color indicates the higher rate of change, we find that core member changes in Tesla and BYD happen frequently (per 2–3 years) and core member changes in Toyota is stable. Toyota may exploit the same core members every year to take an improvement of its R&D capabilities. On the other hand, Tesla and BYD have changed core members constantly to explore their R&D capabilities.
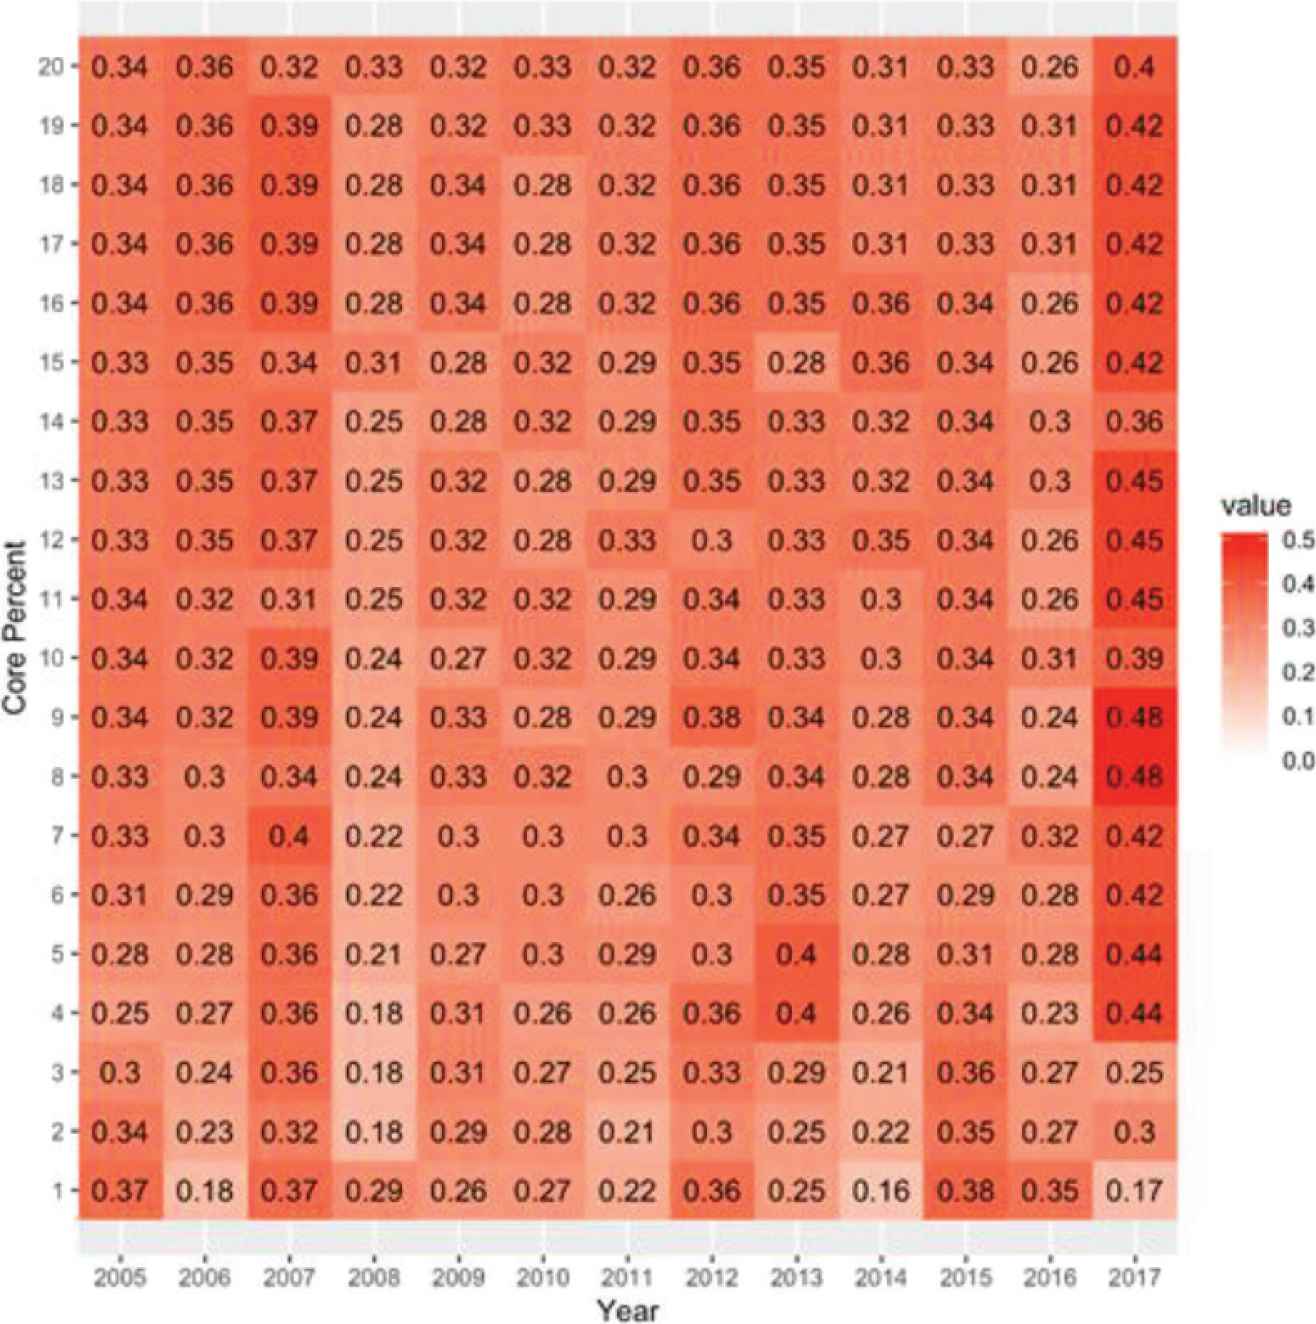
Core rigidities of Toyota.
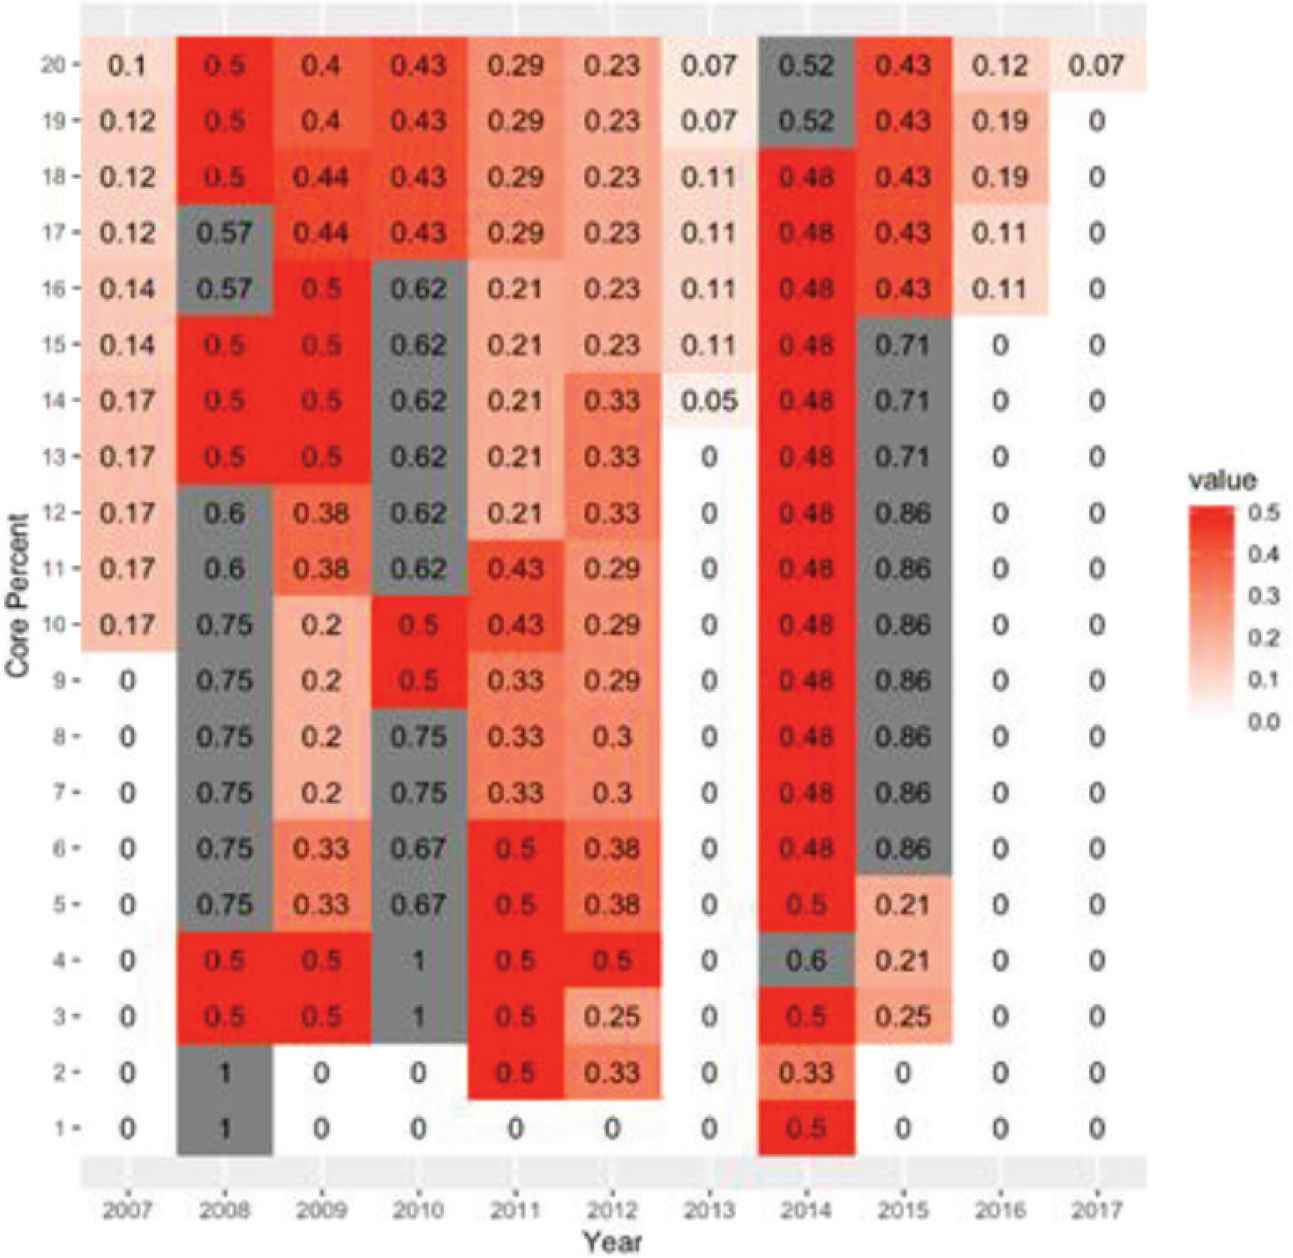
Core rigidities of Tesla.
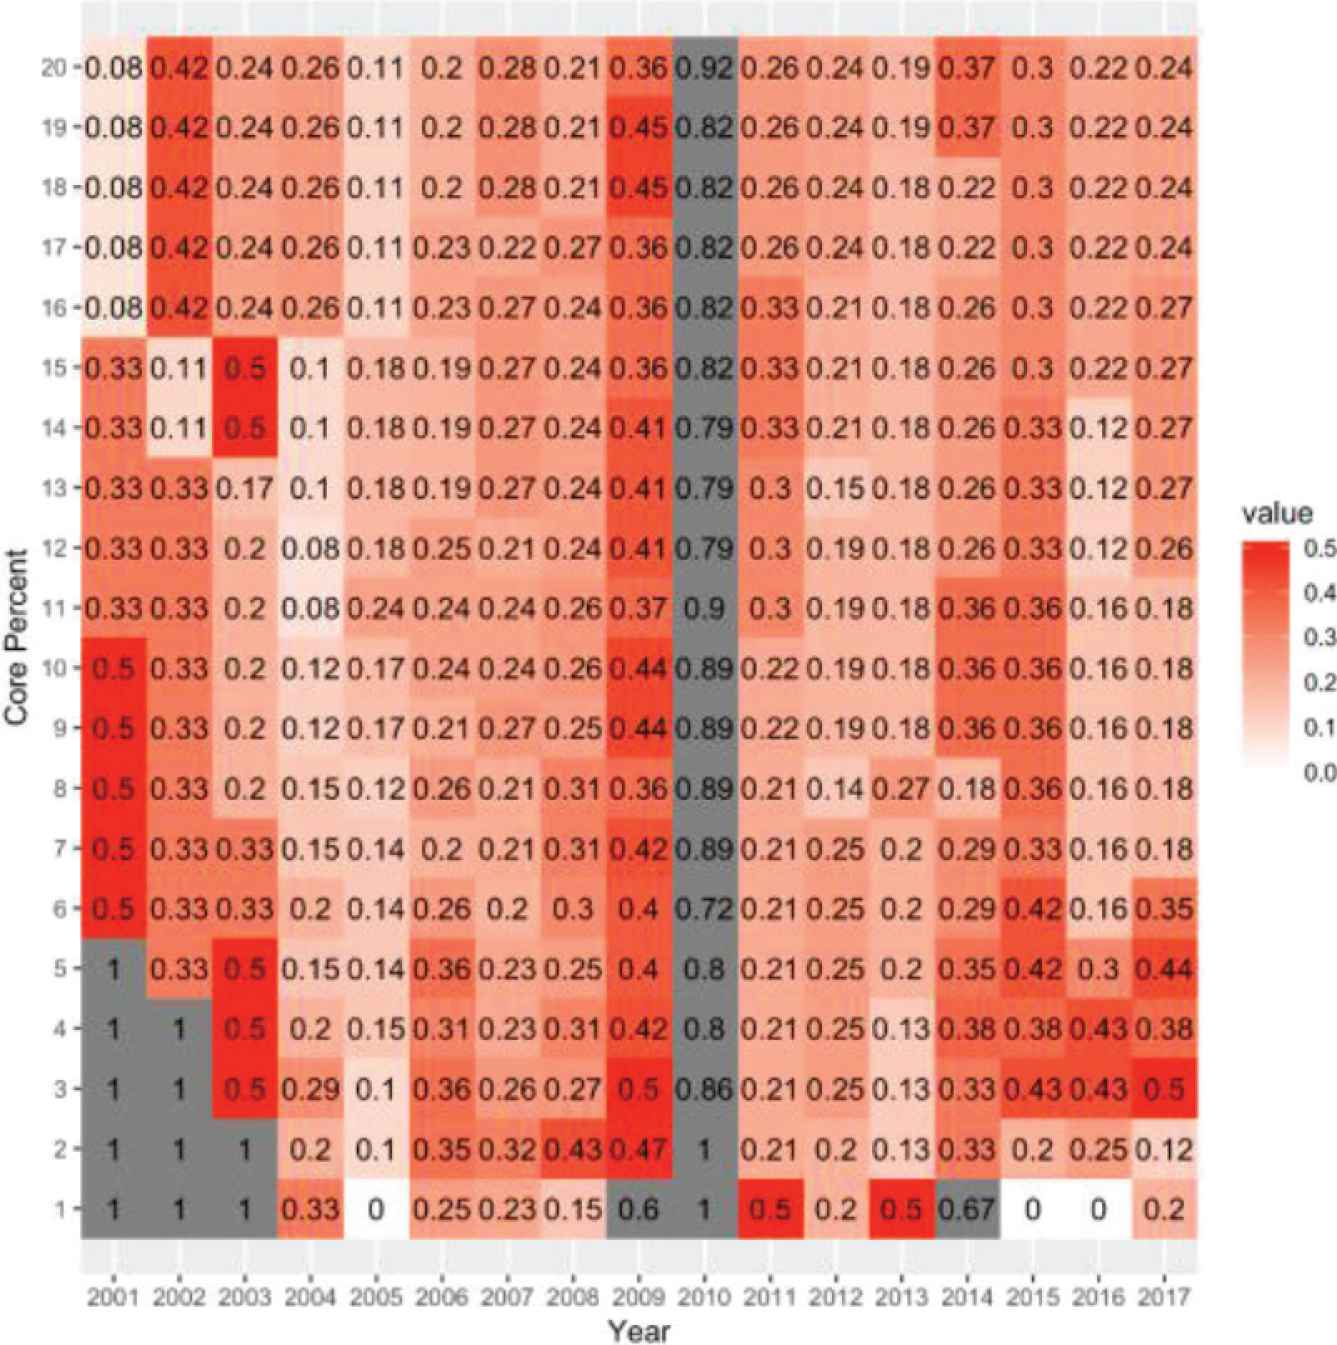
Core rigidities of BYD.
In other words, Toyota may has maintained the incremental R&D strategy, while BYD and Tesla have changed the existing R&D strategy into a new one at a certain time.
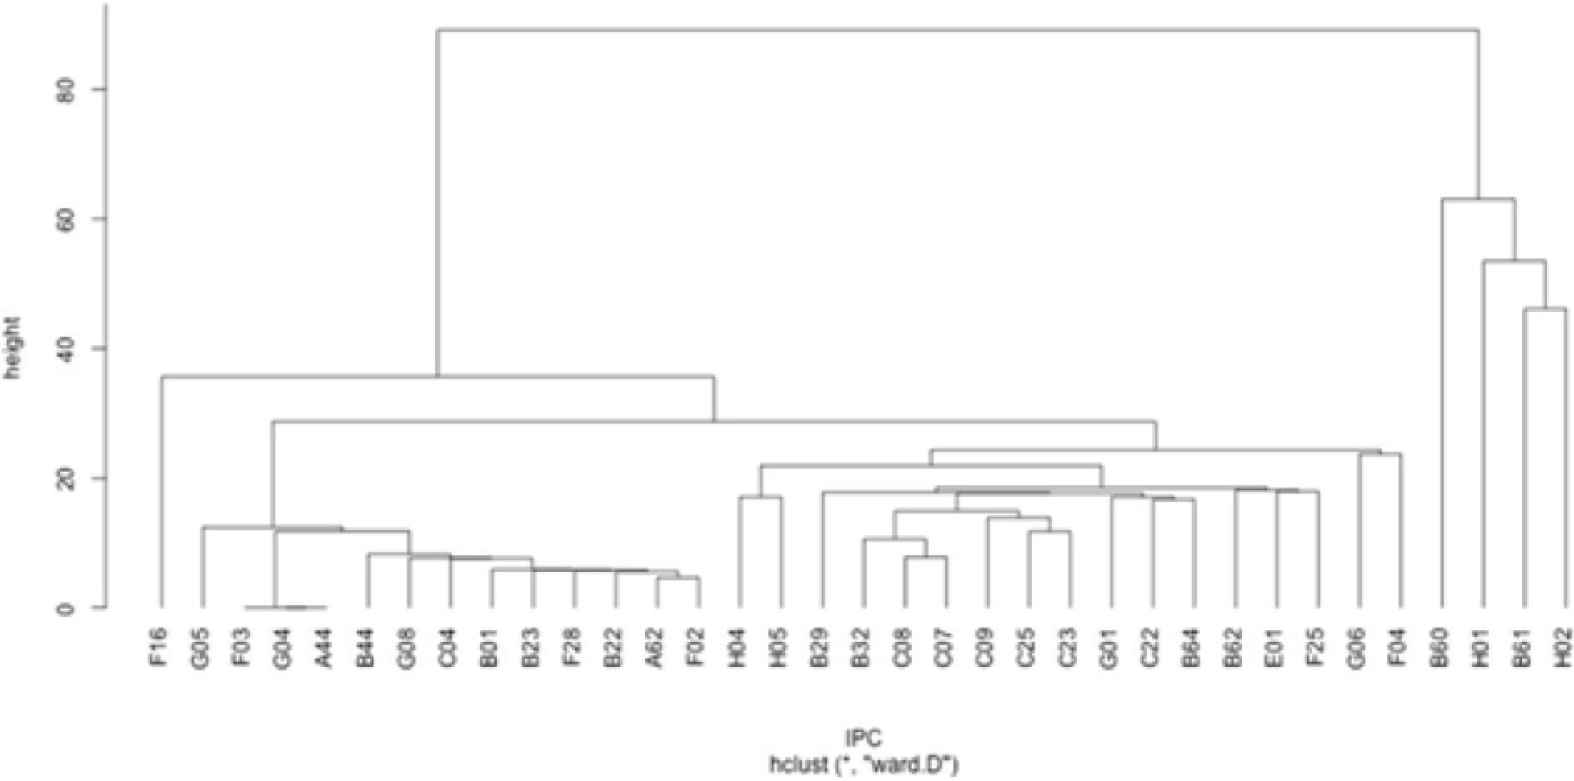
3.4. An Approach by Cluster Analysis
In this session, we examine the technological fields that each company focused on R&D by the IPC code. In Tesla’s case, it has concentrated on Battery (H1) and Charging (H2) for electric vehicles. In recent years, the importance of Powertrain (B60) for Tesla has risen. In the case of BYD, it has the same tendency with Tesla. Different from Tesla and BYD, Toyota has concentrated on Powertrain, but the importance of Battery and Charging arises in recent years.
These tendencies are also identified by the cluster analysis. We run the analysis using IPC codes on every patent, and the results of cluster analysis are shown in Figures 8–10. We find that Toyota and BYD have the similar cluster analysis results, but the cluster analysis result of Tesla is different.
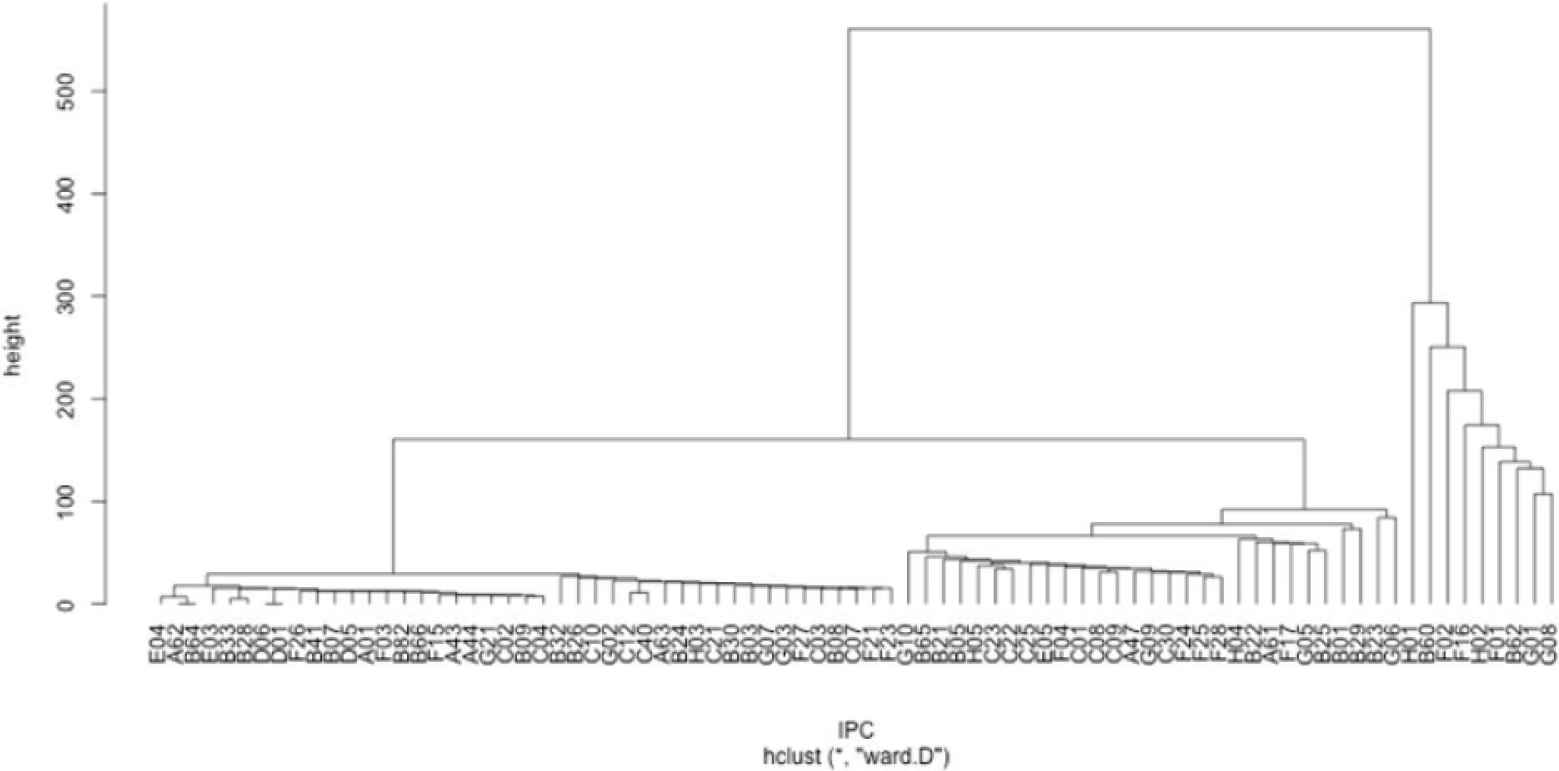
Cluster analysis of Toyota.
Cluster analysis of BYD.
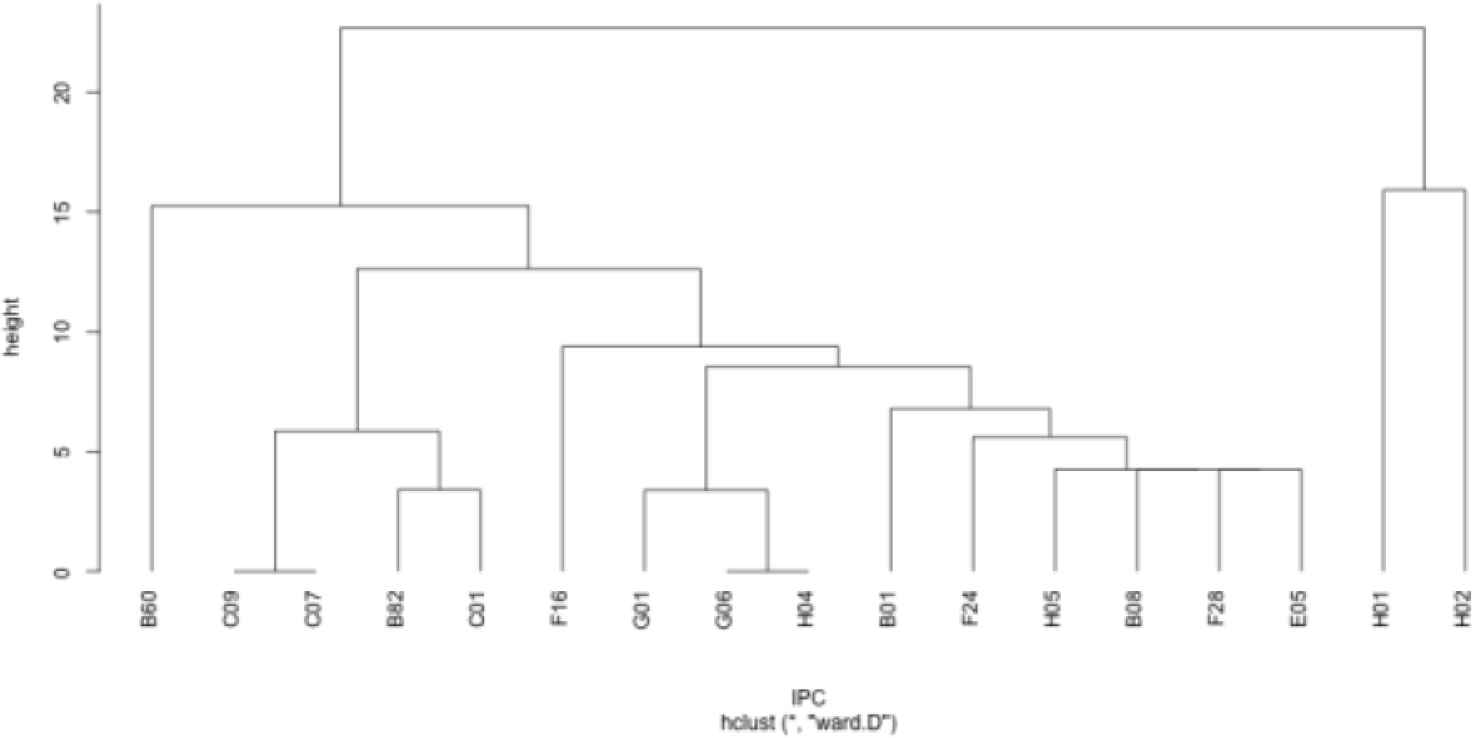
Cluster analysis of Tesla.
Because both of Toyota and BYD have produced mainly gasoline vehicles and produced additionally electric vehicles, so that clusters of Toyota and BYD are divided into two blocks, gasoline (left) and electric cars (right), and the relation between B60 (Powertrain) and H01 (Battery) for electric car is very close. However, Tesla produced only electric vehicle since 2008, it has two main axes of H01, B60, whose relation is far from each other.
Figure 11 shows the image of the weight of Electric Vehicle (EV) in each company’s business domain.
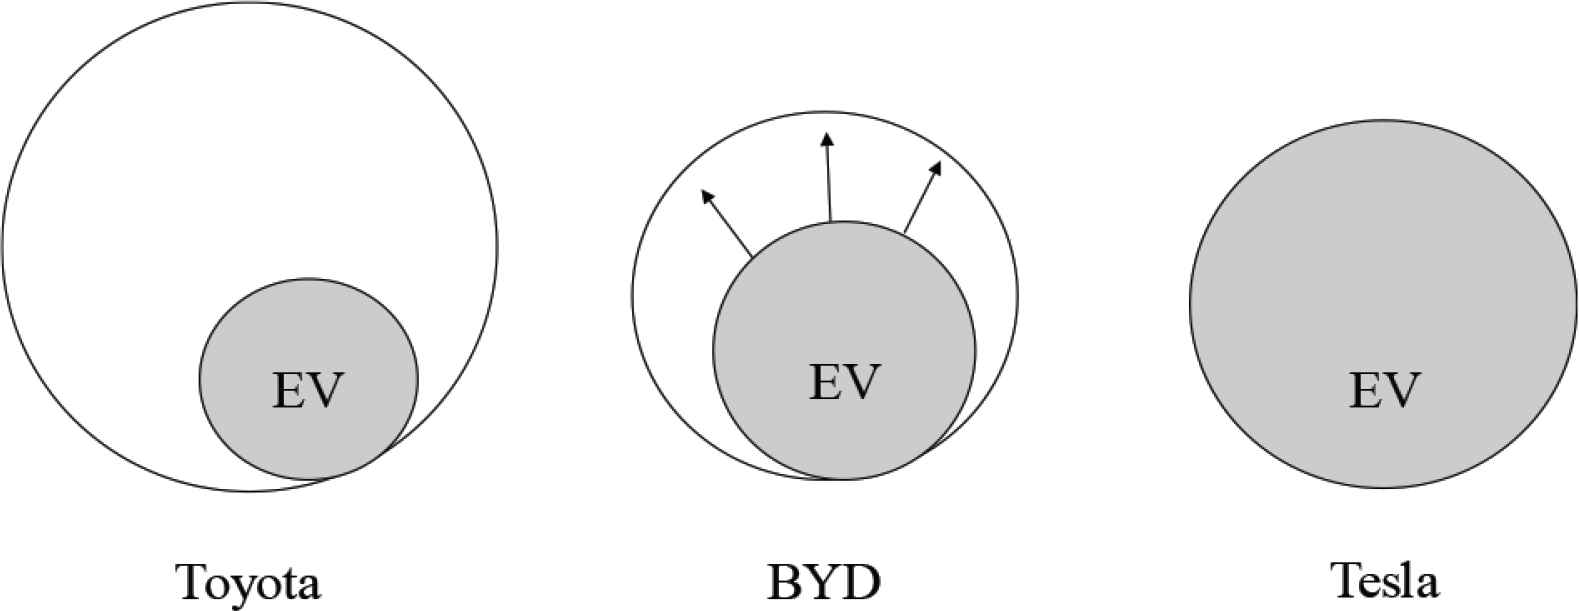
The weight of EV in business domain of each company.
4. DISCUSSION AND CONCLUSION
In this paper, we discuss the patterns of corporate R&D strategies of existing company (Toyota) and new entrants (Tesla and BYD) under the impact of radical technological changes. In the case of automobile industry, we find the similarities and differences in the R&D strategy between Toyota, BYD and Tesla. However, why these companies have taken different R&D strategies?
First, Toyota, whose core product has been gasoline engine, has adopted R&D strategy that leveraged this. Its R&D project structure also seems to follow the integrate type of product architecture. Toyota have pursued incremental technology change and sustainable improvement. Second, BYD, whose core product has been battery technology, wanted to use battery and developed plug-in electric vehicle of world first in 2009. Recently, BYD has focused on the development of EV. Third, Tesla may have been reorganized R&D strategy by mass production of electric vehicle since 2014 and launched Model S and Model 3 as new models.
Based on the results of our analyses, the differences between each company’s R&D strategies seem to be related to their business domain and core competence. Under the radical innovation, Toyota has little change on its R&D project members, but enhances its open innovation on electric vehicles with battery supplier (such as Panasonic), so that we can suggest that the core competence of firms and the decision of boundary of firms should be considered in analyzing the strategy to cope with radical innovation. We have already discussed this issue on Chinese ICT companies [4], therefore, we should also pay attention to the firm’s boundary choice of firms in automobile industry.
CONFLICTS OF INTEREST
The authors declare they have no conflicts of interest.
AUTHORS INTRODUCTION
Prof. Yousin Park
 He received PhD degree in Economics, from Graduate School of Economics, the Kyoto University, Japan in 2009 and now he is currently a Professor with the Department of Business Administration Prefectural University of Hiroshima, in Japan. His research interests include Management of Technology, Strategic Management, also the industry of Information Communication Technology.
Associate Prof. Iori Nakaoka
 He received PhD degree in Engineering, from Graduate School of Science and Engineering, Ritsumeikan University, Japan in 2006 and now he is working as an Associate Professor at National Institute of Technology, Ube college, in Japan. His research fields are management information system and computational social science.
Associate Prof. Yunju Chen
 She received a PhD degree in Economics, from Graduate School of Economics, Kyoto University. She is now an Associate Professor in the Faculty of Economics, Shiga University, Japan. Her research’s focus on the inter-organizational strategies, and the management processes of technology development, also the international comparative studies in these fields.
REFERENCES
Cite this article
TY  - JOUR
AU  - Yousin Park
AU  - Iori Nakaoka
AU  - Yunju Chen
PY  - 2020
DA  - 2020/10/09
TI  - The R&D Strategy of Automobile Companies in Radical Innovation
JO  - Journal of Robotics, Networking and Artificial Life
SP  - 184
EP  - 189
VL  - 7
IS  - 3
SN  - 2352-6386
UR  - https://doi.org/10.2991/jrnal.k.200909.009
DO  - 10.2991/jrnal.k.200909.009
ID  - Park2020
ER  -