
Detection Algorithm of Porosity Defect on Surface of Micro-precision Glass Encapsulated Electrical Connectors
- DOI
- 10.2991/jrnal.k.200909.015How to use a DOI?
- Keywords
- Micro-precision glass encapsulated electrical connectors; manual inspection; surface defect inspection; feature extraction
- Abstract
A miniature precision glass encapsulated electrical connectors introduced by glass powder and metal wires through a special complicated process. Aiming at the porosity defects on the surface, a defect detection algorithm propose based on threshold segmentation and feature extraction. Pre-operation, global threshold segmentation processing and feature extraction (based on area, circularity aspect ratio, compactness, and contour length) are preformed to detect the defects. Experimental results show that the algorithm can accurately identify porosities defects.
- Copyright
- © 2020 The Authors. Published by Atlantis Press B.V.
- Open Access
- This is an open access article distributed under the CC BY-NC 4.0 license (http://creativecommons.org/licenses/by-nc/4.0/).
1. INTRODUCTION
The micro-precision glass encapsulated electrical connectors is mainly used to connect a module, fix its wires and insulate it from the “tube shell”, as shown in Figure 1. The glass encapsulated electrical connector structure is composed of three parts: the connector, the high-temperature glass layer, and the low-temperature glass layer in order from the inside. Due to the low density of the low-temperature glass layer on the outside of the electrical connector, which is fluffy, and the material contains lead, the operating temperature during the sealing process is abnormal (such as too high or too low), and the accuracy of the equipment is not high or malfunctions. As a result, part of the surface structure of the low-temperature glass layer is not compact enough, thereby causing porosity and crack defects. Therefore, the detection of porosity and crack defects on the surface of glass encapsulated electrical connectors is mainly the detection of defects at the low temperature glass welded to the outside. This article is mainly concerned with porosity defect.
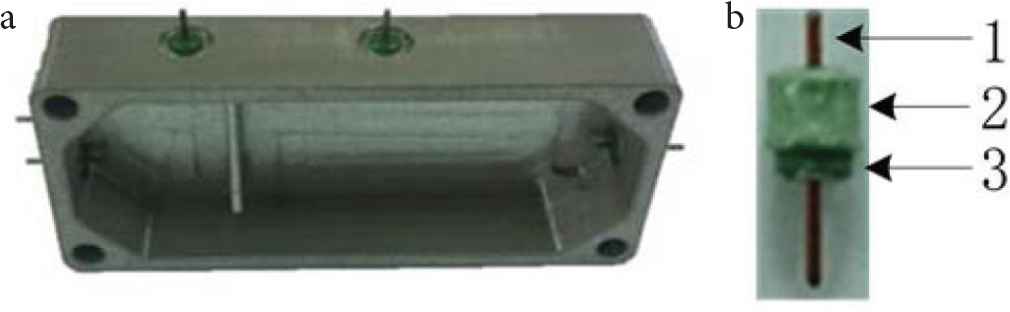
Glass terminal and its installation. (a) Glass terminal installation. (b) The micro-precision glass encapsulated electrical connectors.
The glass encapsulated electrical connector has a small volume (about 2.85 mm in diameter) and requires high accuracy (<0.01 mm). At present, the detection of defects such as porosities and cracks on the surface of the glass encapsulated electrical connector achieve manually by combining with a magnifying glass. However, people who work for a long time are prone to eye fatigue and labor intensity [1]. There are too many subjective factors during manual inspection. Over-fatigue caused by high-intensity work and fast inspection speed may lead to missed inspection or false inspection. As a result, the defective encapsulated electrical connector assembly applied, resulting in poor or even unusable product quality and need to rework, causing huge economic losses. In addition, glass encapsulated electrical connectors are in great demand in some respects and show expansive growth. However, the automatic detection of porosity defects on the surface of connectors at home and abroad is still blank. Therefore, the automatic detection of porosities defects on the surface of glass encapsulated electrical connectors has become a major problem that needs to solve urgently.
For the research of surface defect detection, the Wang et al. [2], Mei et al. [3] and so on use deep learning or support vector machine to detect the surface defect of the object, but the calculation time is long and the sample demand is large. The Chen et al. [4], Wang et al. [5] conducts defect detection by extracting features such as geometric features of defect areas on the surface of objects, and then identifies and classifies the defects. The method is simple, fast and practical. Based on the characteristics of porosity defects on the surface of glass encapsulated electrical connectors, a defect detection of surface algorithm for micro-precision glass insulated encapsulated electrical connectors based on threshold segmentation and feature extraction was proposed.
2. DETECTION ALGORITHM BASIC STRUCTURE
The algorithm uses Halcon HDevelop (18.11) to perform pre-processing operations such as background removal, and G channel acquisition of the image with defects. Then, these two defects are detected using global threshold segmentation processing and feature extraction methods based on area, circularity, aspect ratio, compactness, and contour length, and the characteristic parameters of the defect area are calculated and analyzed. Finally, the classification is based on the difference between the porosity and crack defect characteristics, and the specific process is image pre-processing, defect detection, feature parameter analysis, and final classification decision.
3. IMAGE PRE-PROCESSING
3.1. Background Removal
The pictures acquire with an image-measuring instrument and the colored image is 640 × 480.
In order to facilitate defect detection, it is necessary to separate the end surface area of the glass encapsulated electrical connector from the background to reduce the interference. Since blue does not occur naturally in glass encapsulated electrical connectors and is one of the three channels in the RGB color space, it is easier to segment the foreground area from a blue background than other colors [6]. In order to verify the feasibility of this method from the aspect of practical application, and use a large number of samples with different colors for experimental verification and theoretical analysis. By manually changing the background to ten common colors such as black, gray, white, red, orange, yellow, green, cyan, blue, and purple, the experimental verification and comparative analysis of glass encapsulated electrical connector defect samples were performed. In order to meet the requirements of practical applications, dope the background color appropriately, and it finally find that when the background is biased to pure blue, it can completely meet the requirements of removing the main background. In addition, because the color of the upper-left character of the collected picture is green, which is different from the main background blue color. It is necessary to fill the character area (that is, the area from the image origin to one-sixth long and one-third wide) to the purpose of process of background which include color image to Hexcone Model (HSV) space, blue threshold mask and bitwise negation to generate the target area mask, make the original image and itself bitwise operate in the target area mask, character area color fill. The removal result is shown in Figure 2. Where, the range of values of H, S, and V when generating mask in Figure 2 is: H: [100, 124], S: [43, 255], V: [46, 255].
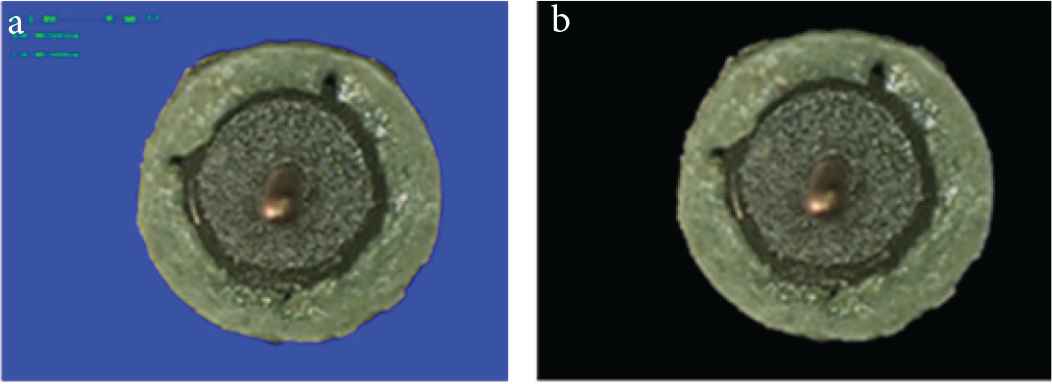
The removal result of background. (a) Stomatal defect sample. (b) Background removal of the sample.
3.2. Obtaining the Glass Encapsulated Electrical Connector G Channel
During the implementation of detection technology of machine vision, due to the requirements of detection speed and algorithm implementation, it is often necessary to convert color images into grayscale images for processing. For the convenience of detection, the three-channel color image is converted into six single-channel grayscale images of R, G, B, H, S, and I. After testing and observation, it is found that the defect part of the glass channel of the G channel is more obvious, so the image of the G channel is selected as the detection map, and the G channel of the glass encapsulated electrical connector is shown in Figure 3.
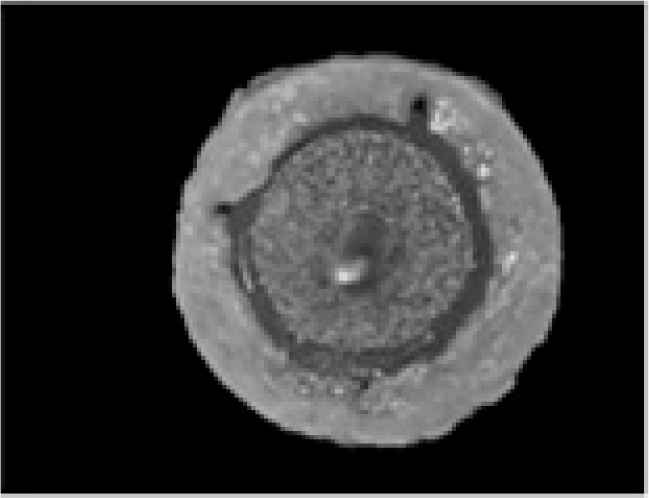
G channel for extracting defective samples.
4. DEFECT DETECTION
The porosity defect on the surface of the glass encapsulated electrical connector are more clearly identified by color, and gray value is lower than other surrounding areas, and they are approximately black. Therefore, global threshold segmentation and feature-based detection and recognition methods use for the detection of porosity defects.
4.1. Threshold Segmentation
Global threshold segmentation perform on the pre-processed glass encapsulated electrical connector image. The threshold segmentation is shown in Eq. (1).
After the above color feature processing, the detection range of glass encapsulated electrical connector defects can reduce, and the distribution of suspicious defects can be roughly determined. Then, the defect area can be detected by the geometric features of the defects. The segmentation result is shown in Figure 4.
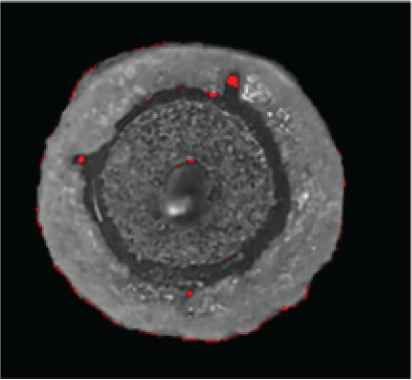
Threshold segmentation map (red area is a suspected defect area).
4.2. Detection and Identification of Defect Geometric Features
According to the distribution of suspicious defects of the glass encapsulated electrical connector, finally determining the porosity defect also requires multiple features for detection and identification. Common defect features in defect detection are area, circularity, perimeter, length, width, ratio of major axis to minor axis, defect center of gravity, circular or stripe defects, average grayscale and contrast, etc. This article mainly uses area, circularity, aspect ratio and compactness for feature selection.
4.2.1. Defect area
The area of a defect can be simply defined as the number of pixels contained in the boundary of the defect, which is only related to the size of the target area, and has nothing to do with the gray-value of the pixels at each point. The area is determined as shown in Eq. (2).
4.2.2. Roundness of defects
It can be defined as the ratio of the area to the maximum area, as shown in Eq. (3).
4.2.3. Aspect ratio of defects
The aspect ratio refers to the ratio of the major axis to the minor axis of the circumscribed ellipse of the region, as shown in Eq. (4).
4.2.4. Tightness of defects
Tightness is a form factor that represents the tightness of a region. The tightness of the circle is 1, if the area is long, the shape factor is greater than 1, and the longer the shape factor, the larger the shape factor, as shown in Eq. (5).
4.2.5. Defect contour length
The contour length refers to the total length of the contour line at the boundary of the specified area, that is, the sum of the distances of the pixels on the edge of the contour. Among them, the distance between two adjacent contour points parallel to the coordinate axis is 1, and the distance on the diagonal is
4.2.6. The characteristic values for identification
The characteristic values of feature detection and identification of stomatal defect are shown in Table 1.
| Defect type | Porosity |
|---|---|
| As (mm2) | [0.0015, 0.05] |
| C | [0.25, 1] |
| Rt | [1.0, 1.6] |
| Ct | [1.0, 2.0] |
| Contour length (mm) | [0.05, 0.60] |
Ranges of characteristic values of porosity defects
The glass encapsulated electrical connector defect detection results are shown in Figure 5.
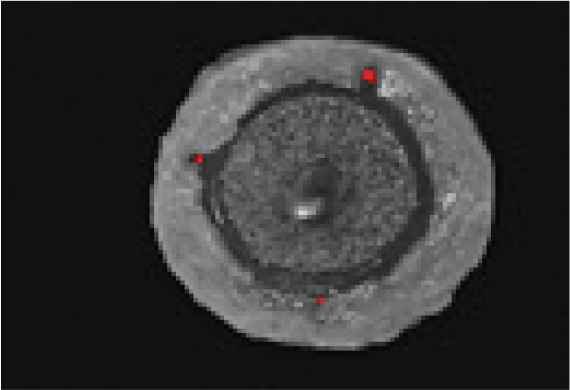
Defect detection results (red areas are defects).
5. EXPERIMENT AND RESULTS
In order to verify the feasibility of the algorithm, three samples with defects were randomly selected for experiments, as shown in Figure 6.
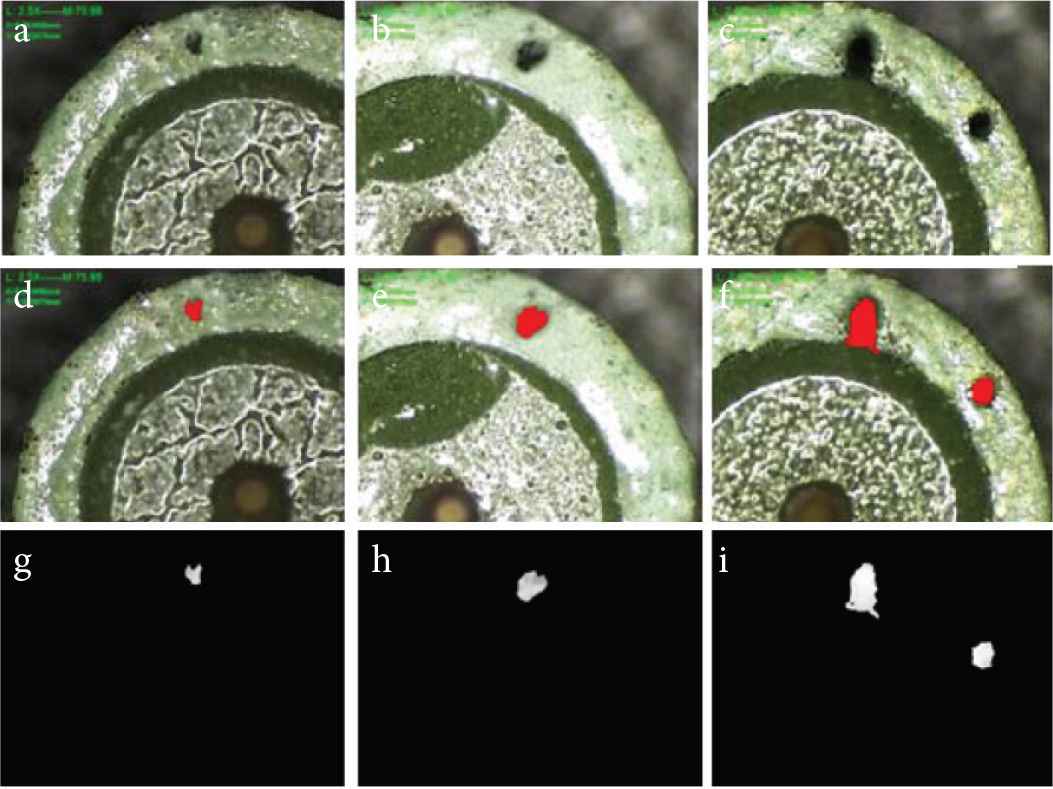
Defect detection results. (a) Sample—S1. (b) Sample—S2. (c) Sample—S3. (d) Defect area labeling in S1. (e) Defect area labeling in S2. (f) Defect area labeling in S3. (g) Defect—S1-p1. (h) Defect—S2-p1. (i) Defect—S3-p1 and S3-p2.
The characteristic values of defects in experiment samples are shown in Table 2.
| Characteristic type | S1-p1 | S2-p1 | S3-p1 | S3-p2 |
|---|---|---|---|---|
| As (mm2) | 7.7 * 10−3 | 21.1 * 10−3 | 38.2 * 10−3 | 15.4 * 10−3 |
| C | 0.53 | 0.67 | 0.37 | 0.68 |
| Rt | 1.21 | 1.13 | 1.25 | 1.05 |
| Ct | 1.62 | 1.28 | 1.86 | 1.46 |
| Contour length (mm) | 0.18 | 0.24 | 0.26 | 0.21 |
Characteristic values of porosity defects
As shown in Table 2, it can be seen from the experimental results that the algorithm proposed in this paper can extract the porosity defect areas. And it can identify porosity defects based on characteristic parameters of area, roundness, aspect ratio, tightness, and contour length.
6. CONCLUSION
Based on the detection of porosities on the surface of glass encapsulated electrical connectors, a surface defect detection algorithm based on threshold segmentation and feature extraction is proposed based on the characteristics of the abnormal texture of the end surfaces. The background is removed by image pre-processing, and the defect can be obtained by threshold segmentation. Then, through the characteristics of area, roundness, aspect ratio, tightness, and contour length, the detection of porosity defects on the surface is realized. Laid the foundation for automatic quality inspection and assembly.
CONFLICTS OF INTEREST
The authors declare they have no conflicts of interest.
ACKNOWLEDGMENTS
This work is partially supported by
AUTHORS INTRODUCTION
Dr. Qunpo Liu
 He graduated from Muroran Institute of Technology (Japan) with a PhD in Production Information Systems. He is an Associate Professor at Henan Polytechnic University (China) and a Master’s tutor. He is mainly engaged in teaching and research work in special environment mobile robots, intelligent instruments and industrial automation equipment.
Mr. Manli Wang
 He received the B.S. degree in Electrical Engineering and Automation from Henan Polytechnic University and the M.S. degree in Control Theory and Control Engineering from Henan Polytechnic University. His research interests include image denoising and image enhancement.
Mr. Gaowei Wang
 He graduated from Henan Polytechnic University (China) in 2017 with a Bachelor’s degree in Automation. He is currently studying for a Master’s degree in Control Engineering at Henan Polytechnic University. He is mainly engaged in research on machine vision.
Dr. Ruxin Gao
 He graduated from Huazhong University of Science and Technology (China) with a PhD in Pattern Recognition and Artificial Intelligence. Now he is an Associate Professor at Henan Polytechnic University (China). He is mainly engaged in teaching and research work in image processing, machine vision and artificial intelligence.
Prof. Naohiko Hanajima
 He graduated from the Hokkaido University (Japan) of Technology in Japan with a PhD. He is a Professor at the College of Information and Systems at Muroran Institute of Technology (Japan). He is mainly engaged in robotics and intelligent equipment.
REFERENCES
Cite this article
TY  - JOUR
AU  - Qunpo Liu
AU  - Manli Wang
AU  - Gaowei Wang
AU  - Ruxin Gao
AU  - Naohiko Hanajima
PY  - 2020
DA  - 2020/09/16
TI  - Detection Algorithm of Porosity Defect on Surface of Micro-precision Glass Encapsulated Electrical Connectors
JO  - Journal of Robotics, Networking and Artificial Life
SP  - 212
EP  - 216
VL  - 7
IS  - 3
SN  - 2352-6386
UR  - https://doi.org/10.2991/jrnal.k.200909.015
DO  - 10.2991/jrnal.k.200909.015
ID  - Liu2020
ER  -