
Analysis of Long-term Care Insurance Demand of Megalopolis in China under the Background of Aging of Population—Take Shanghai as an Example†
- DOI
- 10.2991/jracr.k.210310.001How to use a DOI?
- Keywords
- The demand for long-term care insurance; rapid aging of the population; megacity; Megalopolis; Shanghai
- Abstract
The development of Long-term Care Insurance (LTCI), which matches that people get old before becoming rich lag behind. The mega-urban agglomeration formed in the metropolitan area under the process of urbanization intensifies the demand for insurance driven by long-term care needs. This paper constructs a theoretical model to sort out the micro-action mechanism of LTCI products entering the production field through the consumption of corporate security services, and at the same time entering the consumption field in the form of security services demand from families, individuals and government agencies, it reveals that the differences in the micro-paths of LTCI products entering the enterprise production field and the household consumption field under different regional economic and social conditions. Then, using the GM (1,1) model to analyze the demand for LTCI under the aging population trend of Shanghai, a super large city in China, we found that the situation and characteristics of Shanghai and Japan are similar, and the number of people who need care under the distribution of the elderly population in Shanghai from 2017 to 2027 is much lower than the number of people who need LTCI. Meanwhile, the current long-term nursing service has a large labor gap and high professional skills requirements, but the current salary is low. Besides, the share of elderly care institutions is small, which is not enough to support the current occupancy needs of severely disabled people. The actual development has a greater potential impact on public health expenditures, especially the increase in public health expenditures after the outbreak of the COVID-19 has brought uncertainty. Based on the above findings, we propose to introduce the successful mode of American political and commercial cooperation and the Japanese social security model to alleviate the rapid growth in the demand for LTCI accompanied by the aging trend in the mega-urban clusters formed in the urbanization process.
- Copyright
- © 2021 The Authors. Published by Atlantis Press B.V.
- Open Access
- This is an open access article distributed under the CC BY-NC 4.0 license (http://creativecommons.org/licenses/by-nc/4.0/).
1. INTRODUCTION
China’s aging has the characteristics of getting older before getting rich, growing rapidly, and having a large population base. As of the end of 2018, according to the data of the National Bureau of Statistics, the number of people above 65 in China is 165.65 million, accounting for 11.94% of the total population. Among them, the old-age dependency ratio is 16.8%, which means that every 100 working population in China needs to support 16.8 old people. The aging disability phenomenon in China’s mega-cities represented by Shanghai is particularly serious. According to the data compiled from the Shanghai Sixth Census Bulletin, the disability rates of the 60–80-year-olds in Shanghai are 5.0275%, 14.8139%, and 32.7914%, the severe aging trend has promoted the demand for elderly care.
Judging from the current development of the pension system in China, although the elderly, the disabled, and the need for care for diseases are extremely high, there is no directly compatible policy system and corresponding insurance products, the supporting facilities for elderly care need to be resolved urgently. Firstly, China’s social security system is not perfect. Although the medical insurance of the five social insurances can solve the reimbursement of patients’ medical expenses, most of the conditions that are not reimbursable are the exclusion of nursing and rehabilitation treatment expenses, that is, the expenses of nursing after the patient is discharged are not involved. Secondly, the supply of commercial nursing insurance products in China is in short supply. The major illness insurance in the current commercial insurance, its claims are mainly illness treatment and loss of income, etc., as a supplement to current social insurance, it also has limitations. On the one hand, there is a threshold for the payment of critical illness insurance. If the insured does not meet the payment conditions, commercial insurance companies will not pay. On the other hand, even if the payment conditions are met, the insured amount of the major illness insurance is a one-time payment, which does not apply to people who need long-term care. Therefore, to respond to the increasing demand for care under the background of China’s aging, and to realize the social vision of “the elderly are dependent”, China is currently conducting a pilot program of Long-term Care Insurance (LTCI).
Shanghai is China’s super first-tier city, and its economic development is at the forefront of my country. The implementation of the system has exemplary significance for the country. Therefore, based on the goal of establishing a LTCI system for elderly care, it is necessary to start with the pre-judgment of the elderly disabled population to further clarify the care needs, to establish a scientific and reasonable LTCI system. This article chooses Shanghai as the research object, and mainly discusses and forecasts population as the introduction point.
2. LITERATURE REVIEW
2.1. Summary of the Evolution of the Long-term Care Insurance System
The original LTCI model originated in the United States in the 1970s. With the deepening of domestic aging in the United States, the care needs of the elderly are increasing year-by-year. In 1996, the Health Insurance Portability and Accountability Act came out and made a far-reaching reference to long-term insurance costs. Subsequently, many countries in Europe and Asia also have different forms of LTCI [1–4]. For example, in the dual mechanisms represented by France, although critical illness insurance covers most of the hospital’s health expenditures in its medical system, the direct funding of family assistance only accounts for 9%, requiring the introduction of compulsory care insurance. Commercial nursing insurance was introduced as a supplementary mechanism in subsequent years [5]. In the universal social security system represented by Japan, the form of payment is to provide benefits regardless of income or family status [6]. Generally speaking, the European region is mainly represented by the compulsory insurance of Germany and France, while the more developed countries in Asia are mainly Japan. The overall trend of global LTCI development is to change from the early government-sponsored model to a government-led corporate business model and then to a market-led corporate business model.
There is no mandatory LTCI system in the United States. The market-oriented model represented by the United States is essentially a joint guarantee of social insurance and commercial insurance, it is mainly operated by commercial insurance companies in the insurance market, with government intervention and subsidies. There are three main categories in social and commercial insurance [7]. The government mainly provides limited care protection to certain groups of people through Medicare and Medicaid, while the rest of the population is covered by commercial LTCI:
- (1)
Medical care (Medicare), which mainly covers the elderly above 65 years old, providing nursing care for the elderly for daily medical treatment, medication, and hospitalization within a certain number of days, individuals do not need to bear the cost.
- (2)
Medical assistance (Medicaid) is mainly operated by institutions, and the implementation subject is still the government. The subsidy fee is mainly for the operator of the institution since its original intention is to medical help, participants do not need to make personal payments.
- (3)
Long-term care cooperative plan is a form of cooperation between the government and the enterprise: The government takes care of the bottom line, the company conducts private operations, and the insured voluntarily insure, and the cost of insurance is higher than the previous two forms. The form of commercial insurance is mainly operated by commercial insurance companies, it is aimed at middle- and high-income groups and it is also a supplement to social insurance and aims to meet the willingness of higher-demand groups to purchase insurance.
Next is the universal social insurance model represented by Japan. The Japanese government introduced the “Long-term Care Preventive Measures” in 2006. In the past 10 years of development, several bills have been introduced [8]. Among them, the “Long-term Care Insurance Law” was reformed in 2015, covering all people above 40 years of age. There are two types of insurance subjects, divided by age: nationals between 40 and 65 years old are called No. 2 insurers, and nationals 65 and above are called No. 1 insurers; among them, according to the family and income, it is divided into five levels, as shown in Table 1. While providing long-term care protection, this measure is organizing community salons for the elderly above 65 years old. The cost of participation is relatively low, which can effectively screen them regularly to identify high-risk groups and promote social activities for the elderly.
| Coverage objects | Grades | Main component |
|---|---|---|
| No. 1 insurers (People aged above 65) | Level 1: Recipients of social assistance | Home services: such as home care, daycare, etc.; community services: daily life care, etc.; institutional services: nursing homes, health, and medical institutions, etc. Among them, the No. 2 insurers are paid for specific 16 diseases (such as advanced cancer, early-stage Alzheimer’s disease, cerebrovascular disease, etc.). |
| Level 2: Municipalities tax-exempt households, etc. | ||
| Level 3: Municipalities tax-exempt individuals, etc. | ||
| Level 4: A taxon insured income of fewer than 2.5 million yen | ||
| Level 5: A taxon insured income of more than 2.5 million yen | ||
| No. 2 insurers (People aged 40–65) | Other categories |
Overview of the implementation of long-term care insurance in Japan
2.2. Research Progress of Long-term Care Insurance Demand Theory
In the early discussion of LTCI theory by foreign scholars, it was mainly based on the assumption of rational people [9,10]. Most of them are thinking about the family’s intergenerational relationship. It is found that the consumption of LTCI is affected by the income level of the children. Low-income children are more inclined to take care of their parents in person [11–14] using HRS data analysis found that children’s care for their parents will be replaced with income. Some scholars, based on the sociology of population, found that individuals with higher incomes and married people have more urgent needs for LTCI [15,16]. Although China’s LTCI theory research started late, the results of research on aging are relatively rich, and it is generally believed that my country’s aging has three major characteristics [17]. Firstly, is get old before getting rich. Our country has entered an aging society when the overall national strength is not high. Secondly, is unprepared to get old. China’s pension system will face the strong impact of aging when it is not perfect. Thirdly is loneliness. Due to the widespread phenomenon of “fewer births” today, the elderly are prone to getting old and difficult to support due to various reasons such as disease and loneliness. In the government’s response strategy, in the face of a major change in the demographic structure, the government needs to build strong public service measures for elderly care, centering on the actual needs of the elderly to ensure the quality of elderly care. Furthermore, with the acceleration of aging in China, the concept of “long-term care” has begun to be studied in depth. Many scholars have compared the experience of foreign LTCI implementation and believe that China should establish a LTCI mechanism with Chinese characteristics [18–21]. In recent years, the content of the current development model across the country is quite different, the development of LTCI can be carried out by providing customers with protection and avoiding moral hazard [22].
Furthermore, in the research methods of LTCI, the existing literature generally focuses on the demand factors of LTCI [23–25]. For example, cross-sectional data from the SHARE database (European Survey of Health, Aging and Retirement) to estimate the determinants of physical health for purchasing LTCI in France, the sample variables include BMI index and disease status, risky behavior and disability experience explain the characteristics of French LTCI demand [25], however, the mechanism design of how to design public policies to encourage the growth of long-term insurance is very lacking [26].
Domestic research is still in a situation of following foreign countries, for example, panel data analysis of the linear relationship between independent variables such as household savings, old-age dependency ratio, and the dependent variable LTCI premium income suggests the trend of the macro demand characteristics of LTCI [27]. Economic factors and education status substitute microscopic investigation Logistics probability model analysis to insure LTCI change factors and whether respondents prefer [28,29]. However, due to the short period of domestic pilot projects and the lack of data compared with foreign countries, domestic scholars mainly use questionnaire surveys to obtain data, and most often use the Logistics model for analysis.
In summary, regardless of the evolution of the LTCI system model or the development of LTCI theory, China lags behind foreign countries. However, domestic urbanization and aging have completed the rapid transformation of more than 300 years abroad in just above 30 years. In particular, the rate of aging is faster than abroad, and the rate of an ultra-high aging population is higher. The mega-urban agglomeration formed in the metropolitan area under the process of urbanization has intensified the demand for insurance driven by the demand for long-term care. In reality, there is an urgent need for LTCI system model reform and LTCI theoretical research to keep up with the needs of actual development, and build a true and worry-free life for the people. Because the LTCI has not been implemented for a long time, the relevant data is still blank, and the relevant empirical analysis is all based on questionnaire surveys, and there are few predictive analyses on the population. This article starts with the aging trend and the nursing needs of the elderly disabled population and uses the GM (1,1) model to predict the population simulation to explore the insurance demand potential driven by the long-term care demand in the process of urbanization.
3. ANALYSIS OF THE POTENTIAL MECHANISM OF LONG-TERM CARE INSURANCE
3.1. A Theoretical Model of Consumer Economic Activity in Demand for Long-term Care Insurance
From the perspective of insurance demand acting on insurance consumption, as the current pilot LTCI in China is mainly social security mode, insurance consumption and welfare payment lag behind. Therefore, this paper puts insurance as a safety service of production and people’s life into the general consumption category, and the demand for LTCI is measured by consumption function.
- (1)
The insured behavior is expressed by the production function as the input in the young age [30].
- (2)
The payment in the old age is measured by the utility function.
- (3)
Assuming that the production factor is a necessary condition of the production function, physical capital can be used as a risk backup when it is not insured, and insurance backup does not require excessive material backup, the insurance compensation (contingent claim) is a kind of market-oriented pre-preparation in advance. Therefore, physical capital and insurance consumption are replaceable. Based on the academic works of related scholars [31,32] this article improves the Cobb–Douglas production function: Q = ALαKβ. Let K(t) be the capital stock, C(t) be the consumption of general commodities, and E(t) be the consumption of special insurance commodities. Among them, ER(t) is the consumption of insurance products entering life, and EP(t) is the consumption of insurance products entering production. Insurance investment cost is measured by consumption.
- (4)
Assuming that the production function Y(K, L, EP) is strictly concave, first-order homogeneous and second-order continuously differentiable. Since the population changes little in the short term, it can be assumed that the labor force L is constant. Then, the production function should be a function of the physical capital K and the insurance consumption EP(t) (calculated as a cost) into production, set to Y(K, EP). And there are:
If consumption is divided into ordinary consumption and special consumption, it is assumed that special consumption is only insurance consumption. Then the total insurance consumption
Defining the consumption functions U(C, ER) : R+→ R+ is a non-decreasing function, and the consumption function is a second-order continuous differentiable function with diminishing marginal utility. Let ρ be the discount rate, then the utility function is
Then the above problem becomes to solve the following dynamic optimization problem:
Let K(0) = K0 > 0, C > 0, EP ≥ 0, λ be the shadow price of capital, δ be the depreciation rate of physical assets, and the depreciation rate of monetary assets is 0, then the Hamilton equation:
The necessary and sufficient conditions for the optimal path are:
Then there is
Let
From Equation (8), the left is the total marginal productivity of insurance consumption
It means that the production function is strictly concave, so in the steady-state, there are (1) FK – δ = ρ is a positive value and
Because Equation (7b) shows that
Moreover, there is an alternative relationship between insurance for production consumption and insurance for life consumption, in other words, there is an alternative relationship between a corporate annuity and personal commercial LTCI.
Also, since U″(·) < 0, then when consumption decreases, UC must increase. The larger the investment in the early stage of the production function, the greater the welfare for the elderly in the later stage, so the introduction of LTCI is extremely necessary.
As one of the leading cities in the megalopolis, Shanghai has strong regional advantages and economic strength. Policy subsidies and the participation of individuals can increase the benefits for the elderly.
3.2. Analysis and Prediction of the Shanghai Population-based on GM (1,1) Model
The source of the data in this article is the total population of Shanghai registered household registration and the number of elderly people above 60 years of age who are registered in the Shanghai Statistical Yearbook from 2004 to 2017. It can be seen from Figure 1 that the degree of aging in Shanghai has been increasing year-by-year. Especially in 2014, its aging growth rate reached 6.33%. Shanghai has reached a state of deep aging in 2015. Among them, the proportion of the population above 60 years old is 30.21%. According to the data in Figure 1, a corresponding population prediction model is established by the gray prediction analysis theory below.
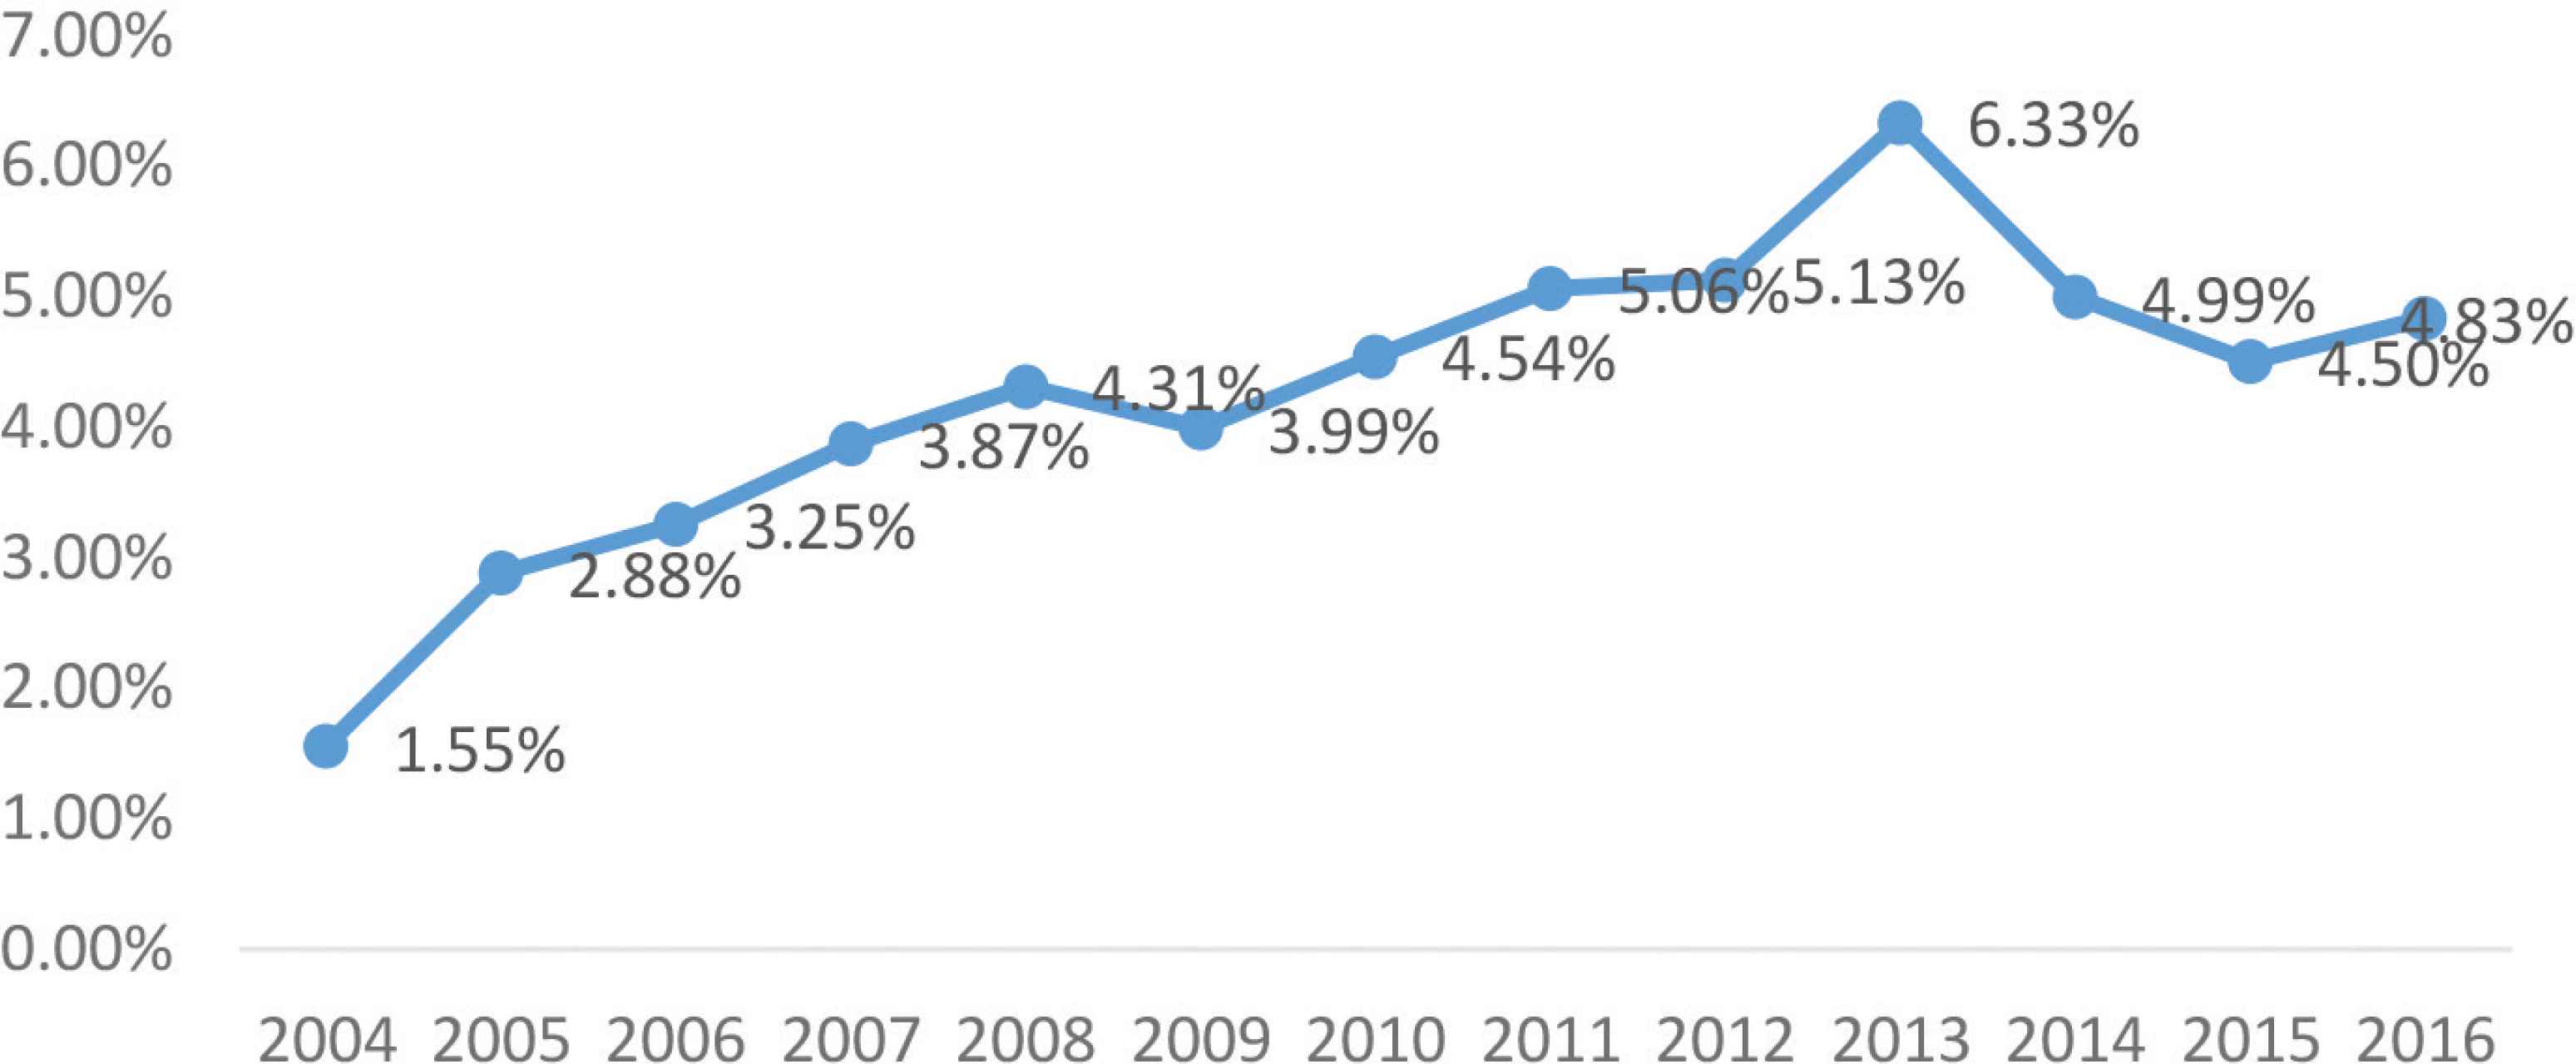
The growth rate of aging from 2004 to 2016. Data source: Shanghai Statistical Yearbook 2005–2017.
First use the data of the elderly above 60 to form the original sequence:
Accumulate x(0) once and generate 1-AGO sequence:
Let Z(1) = [Z(1)(2), Z(1)(3), …, Z(1)(14)] be the sequence generated by X(1)(k)
where
Construct two sets of matrices, respectively:
The vector of coefficients to be estimated as
Establish GM (1,1) gray estimation model, its differential equation is:
After generating the corresponding sequence of time, the corresponding variance is:
That is, the value of
Then do cumulative subtraction reduction
In the same way, for the estimation of Shanghai’s registered population, let another original sequence:
Test the two levels:
Similarly,
Since only the data before 2018 is obtained, this article aims at the medium and long-term forecast, predicting the population distribution in the next 10 years (2017–2027) (Tables A1–A3). It can be seen that because this gray prediction model level ratio deviation value test has reached higher requirements, the population prediction is basically consistent with the original data, and the conclusion that the prediction data is credible can be drawn. The following analysis of the LTCI model is based on this data (Figure 2).
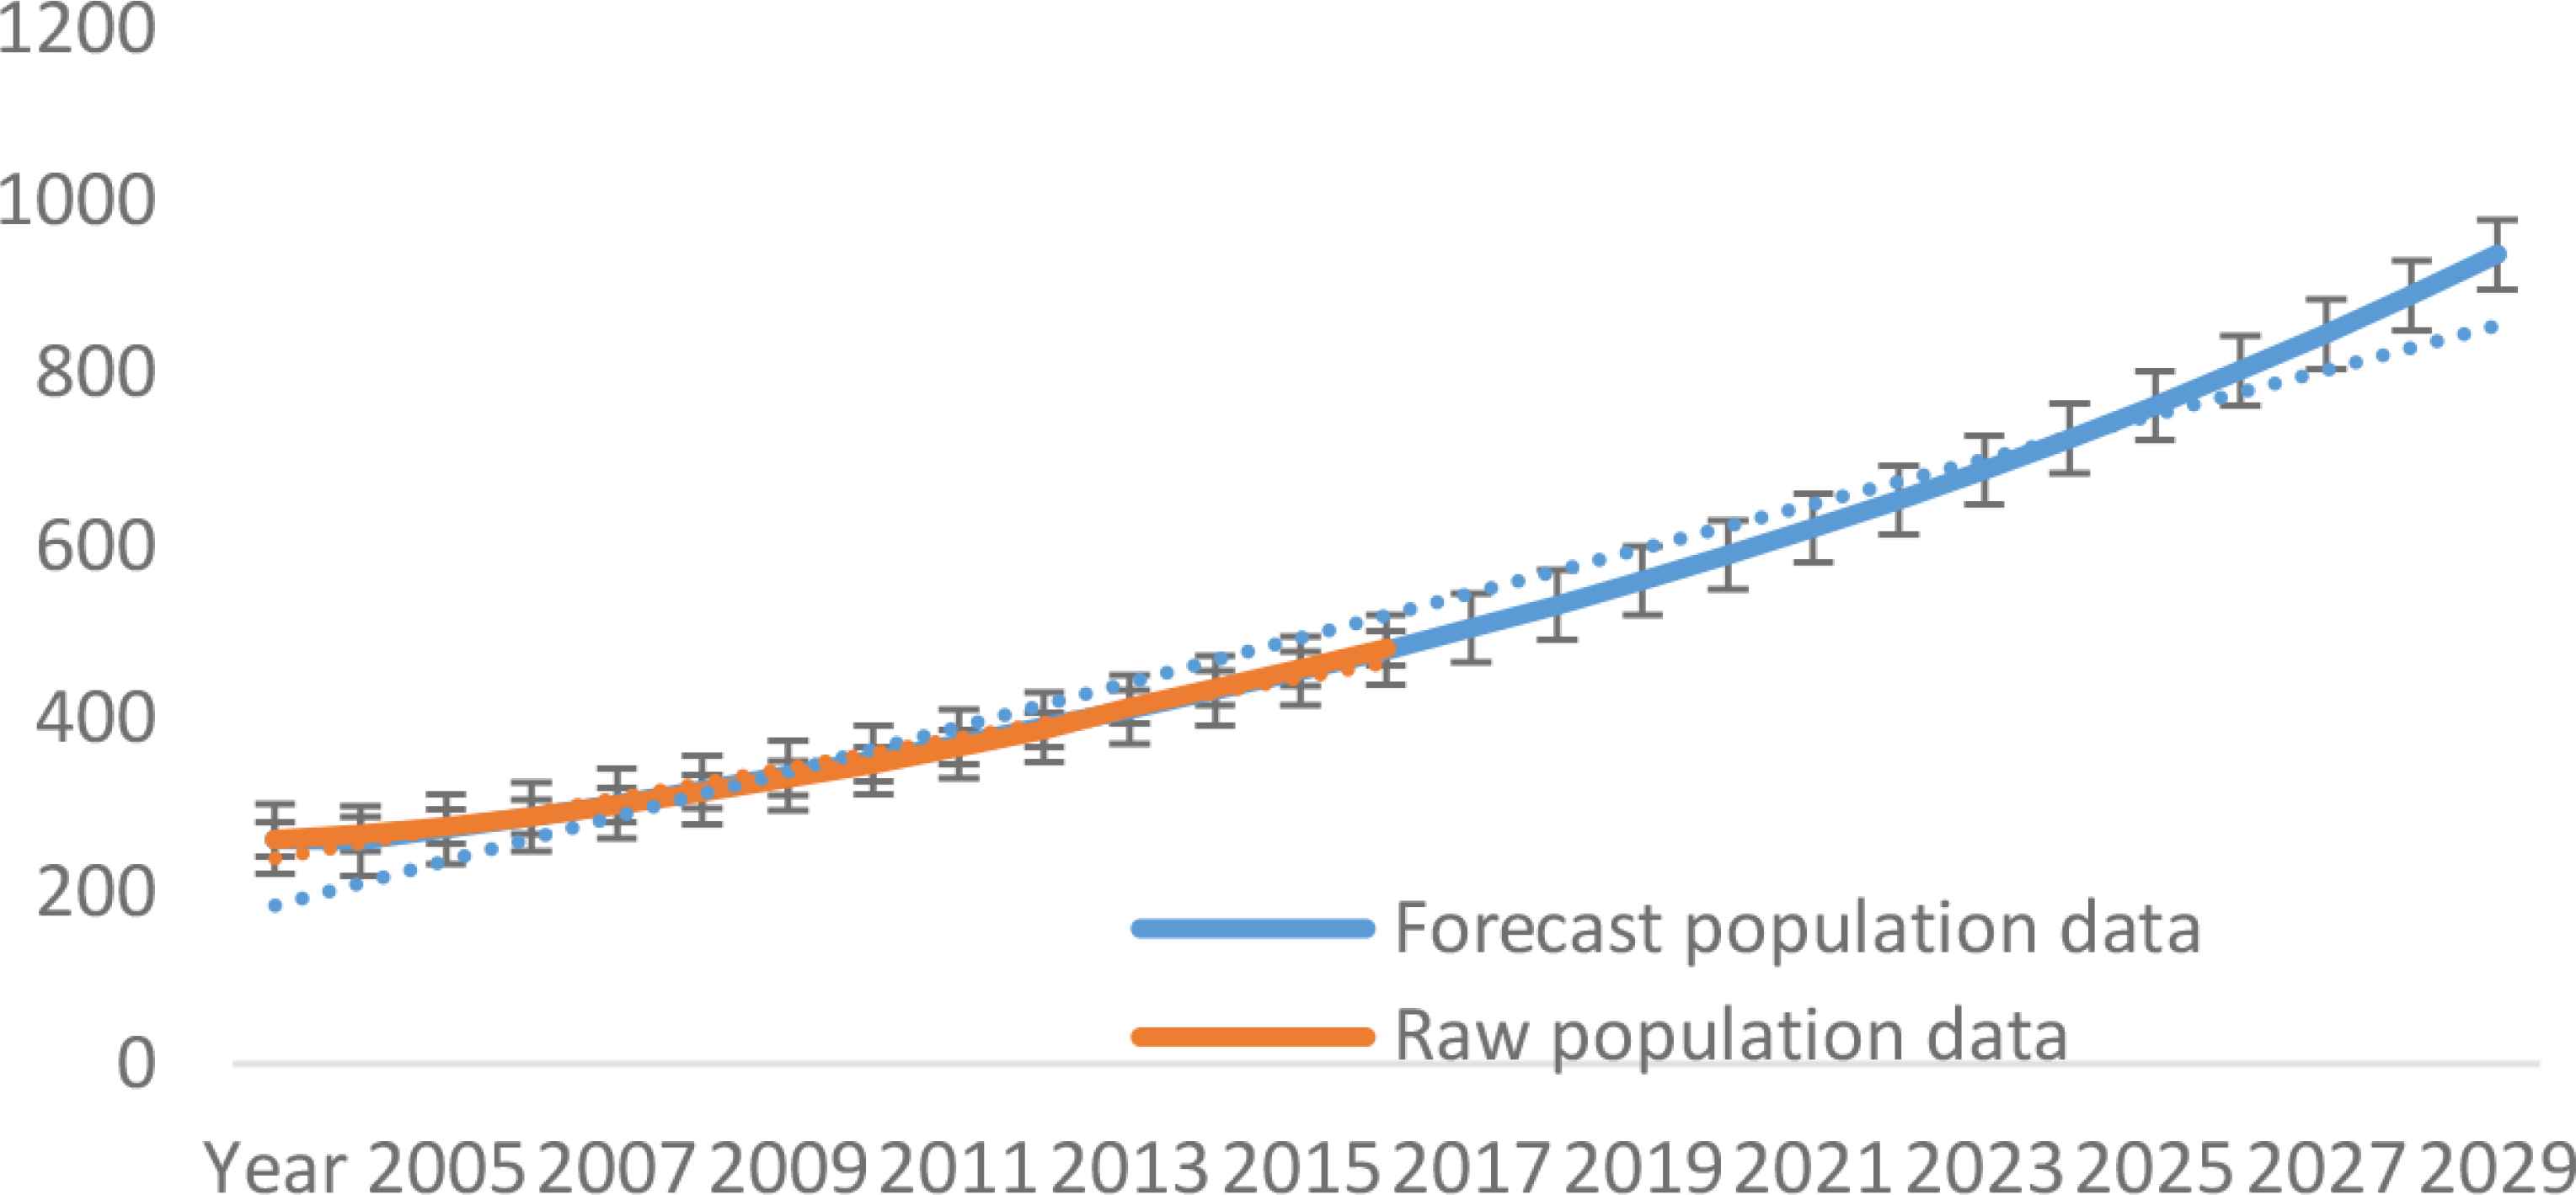
Simulation of the original population above 60 and the predicted population. Data source: Shanghai Statistical Yearbook 2005–2017.
3.3. Calculation of Nursing Needs
3.3.1. Calculation of disability of the elderly population
Based on the above results of using the GM (1,1) gray prediction model, this paper selects the sixth population census in Shanghai, and statistically collates the health and disability of the elderly population.
By calculating the corresponding distribution ratio, age is divided into three stages: 60–79 years old and above 80 years old. Health status is measured by self-care ability, it is divided into the elderly who are not disabled, partially disabled and completely disabled and the latter two are the composition of the disability rate as shown in Table 2.
| Age distribution | 60–69 years old (%) | 70–79 years old (%) | Above 80 years old (%) |
|---|---|---|---|
| Total | 100.0000 | 100.0000 | 100.0000 |
| Not disabled | 94.9725 | 85.1861 | 67.2086 |
| Partially disabled | 4.1806 | 11.3786 | 19.6793 |
| Completely disabled | 0.8469 | 3.4353 | 13.1121 |
| Disability rate | 5.0275 | 14.8139 | 32.7914 |
Data source: The sixth population census in Shanghai.
Distribution of disability among the elderly population
According to calculations, among the distribution of the elderly above 60 years old, 87.2711% are not disabled, 9.0208% are partially disabled; 3.7081% are completely disabled, and the disability rate is 12.289%. The number of elderly disabled people and the number of people who need LTCI for the next 10 years from 2016 to 2027 are shown in Table 3.
| Year | Population above 60 (10,000 people) | Partially disabled (10,000 people) | Completely disabled (10,000 people) | LTCI demand forecast (10,000 people) | The current number of participants in LTCI (10,000 people) |
|---|---|---|---|---|---|
| 2016 | 457.8000 | 41.2970 | 16.9758 | 58.2728 | * |
| 2017 | 481.6100 | 43.4448 | 17.8587 | 61.3036 | * |
| 2018 | 505.2430 | 45.5767 | 18.7351 | 64.3118 | 23.4 |
| 2019 | 531.9568 | 47.9865 | 19.7256 | 67.7122 | 49.3 |
| 2020 | 560.0831 | 50.5237 | 20.7686 | 71.2923 | * |
| 2021 | 589.6965 | 53.1951 | 21.8667 | 75.0618 | * |
| 2022 | 620.8757 | 56.0077 | 23.0229 | 79.0305 | * |
| 2023 | 653.7034 | 58.9690 | 24.2402 | 83.2091 | * |
| 2024 | 688.2668 | 62.0868 | 25.5218 | 87.6087 | * |
| 2025 | 724.6577 | 65.3696 | 26.8712 | 92.2408 | * |
| 2026 | 762.9727 | 68.8259 | 28.2920 | 97.1179 | * |
| 2027 | 803.3136 | 72.4649 | 29.7879 | 102.2528 | * |
Note: Forecast data after 2017. *represents data not yet available.
2016–2027 Elderly disabled population and long-term care insurance (LTCI) demand forecast
It can be seen from Figure 3 that both the completely disabled population and the partially disabled population are increasing. In particular, the partially disabled population has increased significantly, indicating that the number of people in need of moderate care in the future is relatively large. Under the rising trend of the elderly population in the future, it can be concluded that in the next 10 years, the number of LTCI needs will be about 60, accounting for 1/8 of the elderly population.
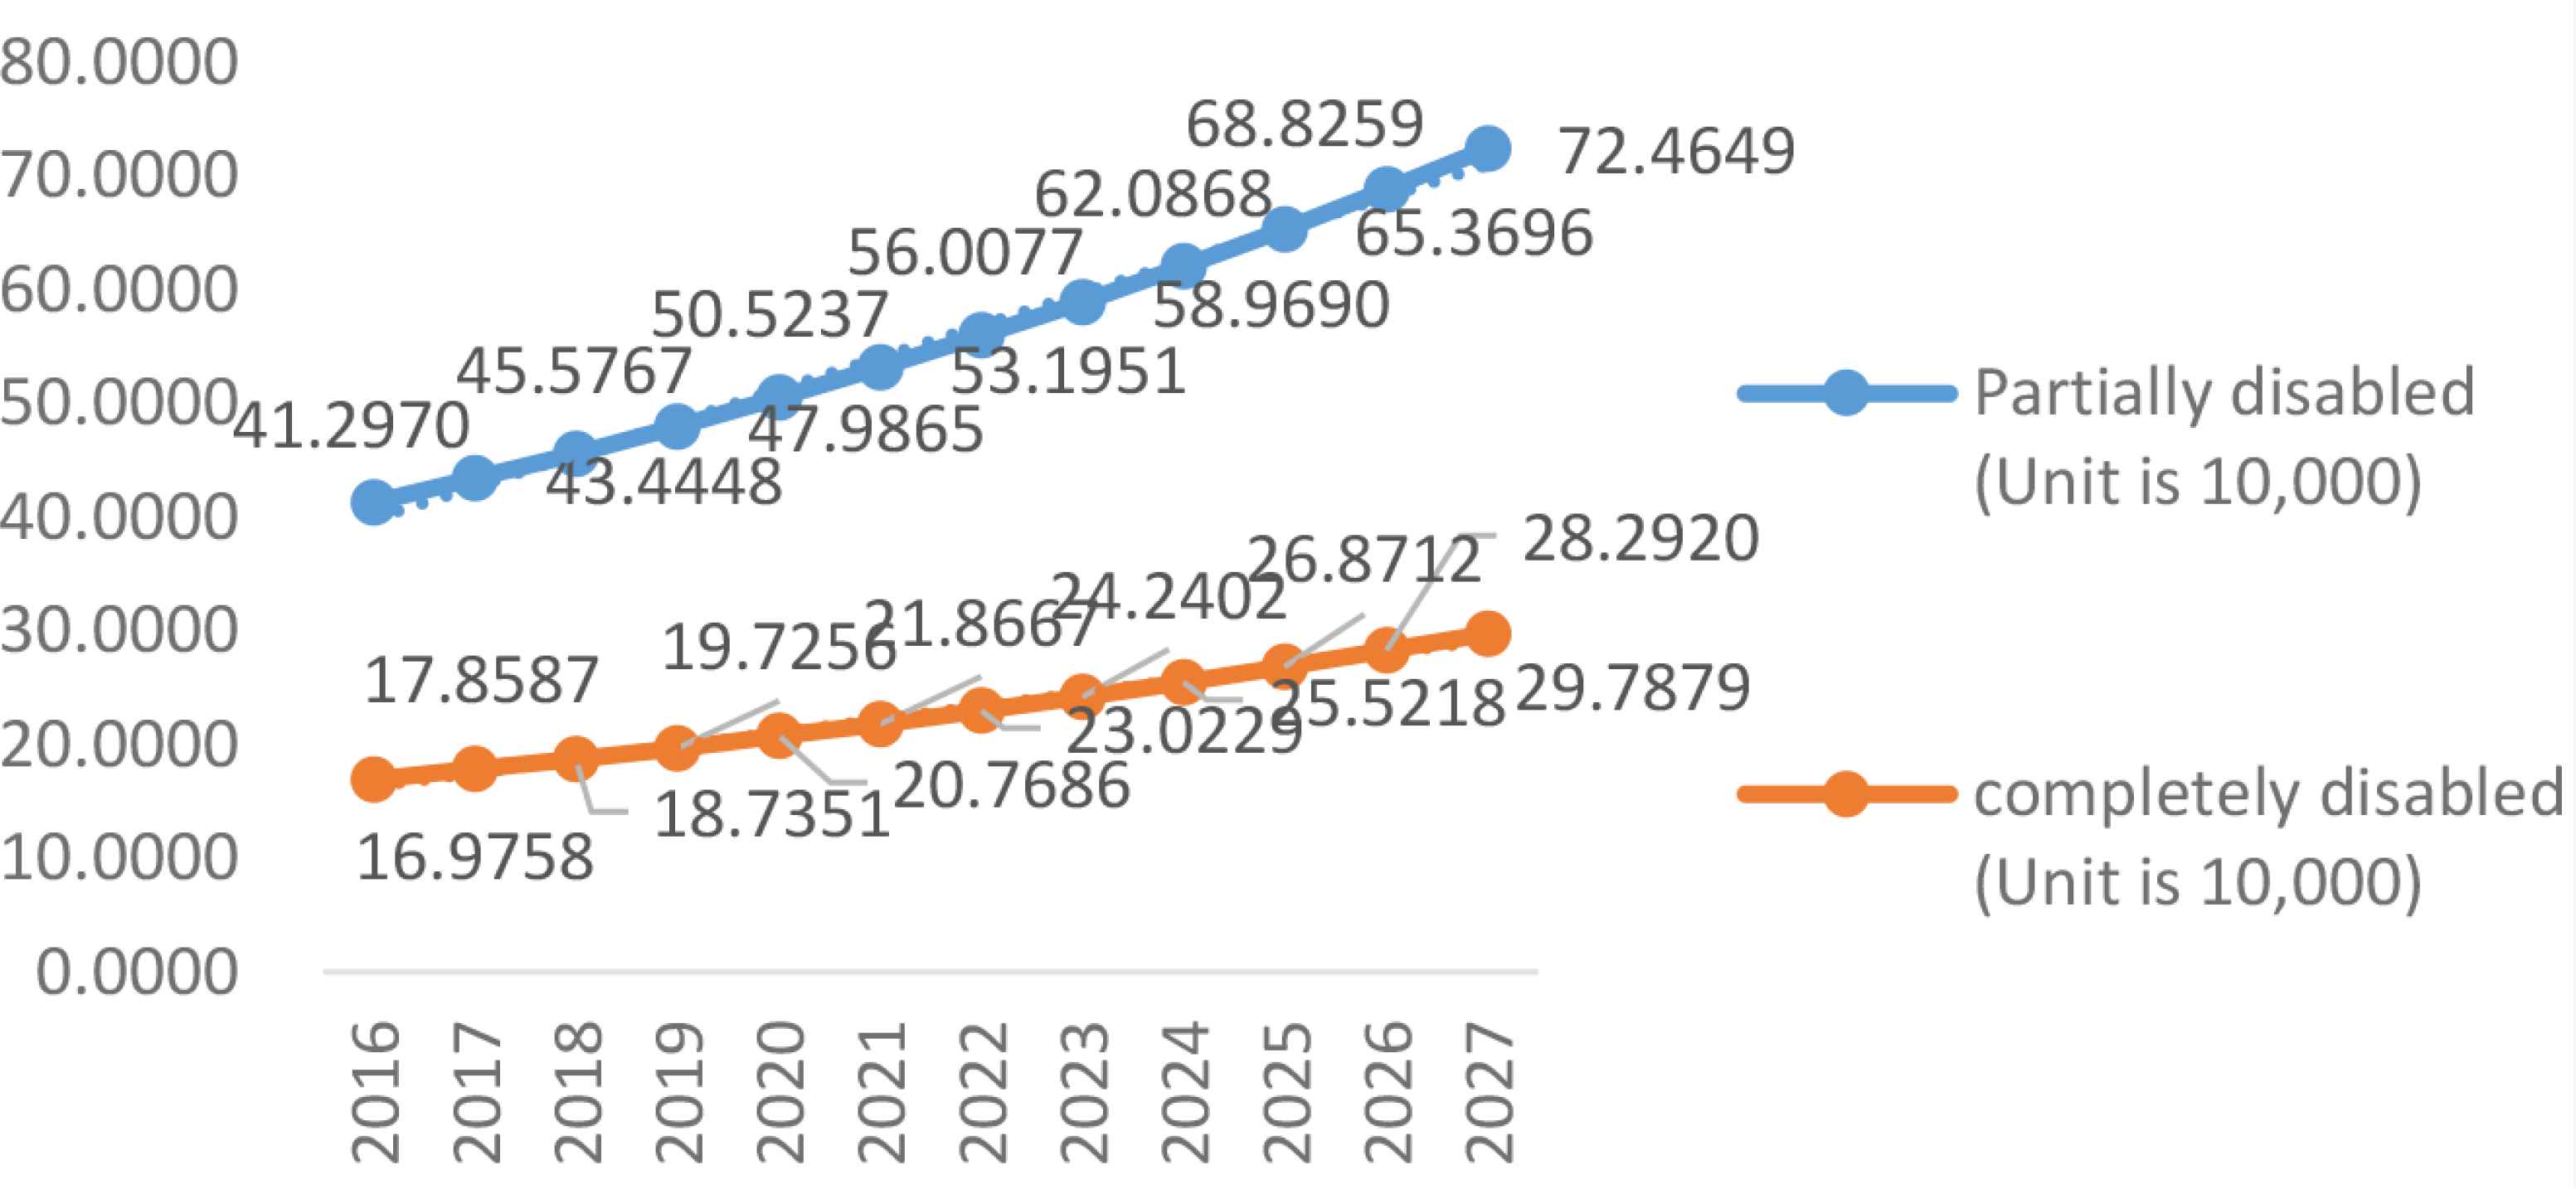
The evolution of the disabled elderly population forecast in Shanghai from 2016 to 2027.
3.3.2. Elderly disabled population forecast for different care category
The ratings of the disabled elderly in various regions of China are mainly assessed concerning the Barthel index, which is a commonly used internationally accepted Activities of Daily Living (ADLs). The treatment standards are mainly divided into three categories according to the degree of completely disability: (1) The first care category: the assessment level is two or three; (2) The second care category: the assessment level is four; (3) The third care category: the assessment level is five or six. With reference to the National Research on the Status of the Disabled Elderly in Urban and Rural Areas issued by the research group of the China Research Center on Aging in 2011, it is pointed out that in 2010, the proportions of mild, moderate and severe disability of the completely elderly who in China were 84.3%, 5.1% and 10.6%, respectively. Combining the nursing treatment standards in Shanghai, and based on the values in Table 3, we can get the predicted number of total disabled elderly care grade distribution in Shanghai from 2017 to 2027. It should be noted that since it is difficult to divide the standard of the number of partially disabled people, the number of partially disabled people is listed separately here, as shown in Table 4.
| Year | Partially disabled (10,000 people) | Completely disability (10,000 people) | ||
|---|---|---|---|---|
| The first care category | The second care category | The third care category | ||
| 2016 | 41.297 | 14.3106 | 0.865766 | 1.799435 |
| 2017 | 43.4448 | 15.05488 | 0.910794 | 1.893022 |
| 2018 | 45.5767 | 15.79369 | 0.95549 | 1.985921 |
| 2019 | 47.9865 | 16.62868 | 1.006006 | 2.090914 |
| 2020 | 50.5237 | 17.50793 | 1.059199 | 2.201472 |
| 2021 | 53.1951 | 18.43363 | 1.115202 | 2.31787 |
| 2022 | 56.0077 | 19.4083 | 1.174168 | 2.440427 |
| 2023 | 58.969 | 20.43449 | 1.23625 | 2.569461 |
| 2024 | 62.0868 | 21.51488 | 1.301612 | 2.705311 |
| 2025 | 65.3696 | 22.65242 | 1.370431 | 2.848347 |
| 2026 | 68.8259 | 23.85016 | 1.442892 | 2.998952 |
| 2027 | 72.4649 | 25.1112 | 1.519183 | 3.157517 |
Note: Forecast data after 2017.
2016–2027 Elderly disabled population forecast for different care category
3.3.3. Calculation of the number of home care workers required
According to the payment policy of the Shanghai LTCI Fund, the payment levels for community care at home and elderly care institutions are 90% and 85% respectively. Inpatient medical care is mainly determined by actual conditions since the latter two contents vary greatly with actual conditions, this article selects the home care to estimate the nursing staff. The first care category, the second care category, and the third care category of nursing standards are mainly performed in the form of door-to-door services. The standards are three times a week, five times a week, and seven times a week and each service last 1 h. If part of the disabled population is considered in the first type of care standard, based on the 40 h/week working hours per person, the number of nursing staff who need home care can be roughly estimated, as shown in Table 5.
| Year | The first care category (10,000 people) | The second care category (10,000 people) | The third care category (10,000 people) | Total (10,000 people) |
|---|---|---|---|---|
| 2016 | 4.17057 | 0.108221 | 0.314901 | 4.59369188 |
| 2017 | 4.387476 | 0.113849 | 0.331279 | 4.8326041 |
| 2018 | 4.602779 | 0.119436 | 0.347536 | 5.06975168 |
| 2019 | 4.846139 | 0.125751 | 0.36591 | 5.3377992 |
| 2020 | 5.102372 | 0.1324 | 0.385258 | 5.62002973 |
| 2021 | 5.372155 | 0.1394 | 0.405627 | 5.91718225 |
| 2022 | 5.6562 | 0.146771 | 0.427075 | 6.23004573 |
| 2023 | 5.955262 | 0.154531 | 0.449656 | 6.55944868 |
| 2024 | 6.270126 | 0.162702 | 0.473429 | 6.90625693 |
| 2025 | 6.601652 | 0.171304 | 0.498461 | 7.2714161 |
| 2026 | 6.950705 | 0.180362 | 0.524817 | 7.6558826 |
| 2027 | 7.318208 | 0.189898 | 0.552565 | 8.06067085 |
Note: Forecast data after 2017.
2016–2027 Calculation of the number of home care workers required
4. THE DILEMMA OF LONG-TERM CARE INSURANCE IN SHANGHAI
4.1. The Population Who Has Received Reimbursement from Long-term Care Insurance is Inadequate
According to the data published in the “Shanghai Elderly Population and Elderly Career Monitoring Statistics Information” in 2018–2019, the number of people above 60 years old in Shanghai receiving nursing services in 2018 totaled 234,000, accounting for 4.6% of the elderly population, the scope of the pilot program has been greatly expanded in 2019, and the number of elderly people above 60 years old in the city receiving nursing services totaled 493,000, accounting for 9.5% of the elderly population. From the results in Table 3, it can be concluded that the number of people in need of LTCI in 2018–2019 is much greater than the number of people in the pilot, the demand potential of LTCI is huge.
4.2. Supporting Facilities for LTCI are Relatively Absent
It can be seen from the above-predicted value that the difficulty of follow-up by nursing staff and nursing institutions is an important reason for the relatively lagging development of LTCI in China. Firstly, there is a large shortage of nursing staff in LTCI. Combined with the data from the Shanghai Statistical Yearbook and Table 5, the predicted number of nursing home care in 2018 alone will require more than 50,000 people, while the total number of health technicians in 2018 was only 206,500. If we add institutional care and inpatient medical care, it is unrealistic to rely solely on the current 206,500 people. Therefore, it can be judged that there is a huge shortage of nursing staff for LTCI. In terms of salaries, the 2015–2017 salaries of Shanghai residents’ service, repair and other service industries were 33,720, 37,292, and 40,478 RMB per year respectively, which were lower than other industries such as agriculture, forestry, and animal husbandry. Currently, there are relatively few people working in health and social work, and people are more inclined to move to tertiary industries with higher salaries such as wholesale and retail, it can be seen that the promotion of LTCI still needs to be achieved by attracting salary. At the same time, if the government intends to train professional nursing talents, it needs to invest a lot of money. Secondly, the number of nursing institutions is still in a small share. In 2018, the number of elderly nursing homes and hospitals in Shanghai was only 38 and two, and the number of inpatients was 26,001 and 1863. Currently, the people who can participate in institutional care are elderly people with the third type of nursing standard. According to Table 4, the predicted number of people with the third care category in 2018 is close to 20,000, which is equivalent to the overall value of the current elderly care institution. The number is not enough to support the occupancy needs of the elderly with full weight disability, and the elderly with a severe disability still largely rely on home care.
4.3. The Burden Structure of Health Expenses is Under Certain Pressure
Since the implementation of the LTCI pilot program is closely related to medical resources, public health expenditures can be used as a reference standard. As shown in Figure 4, Shanghai’s public health expenditures have been on the rise, and the trend is that the proportion of personal health expenditures has fallen, staying at about 20%, while the proportions of government health expenditures and social health expenditures have been increasing. The health expenses of Shanghai LTCI are mainly paid by the special LTCI Fund, which is a new fiscal expenditure item. The long-term care policy based on aging will have a certain impact on Shanghai’s fiscal expenditure. Correspondingly, due to the impact of the COVID-19 in China in 2020, the national medical resources may further participate in the fight against the epidemic, which will greatly increase the corresponding health expenses. Therefore, the expenditure on health expenditure is uncertain. Despite this, we can still analyze the severity of the elderly population, and more public expenditure on health can be foreseen in the next 10 years (Table A4).
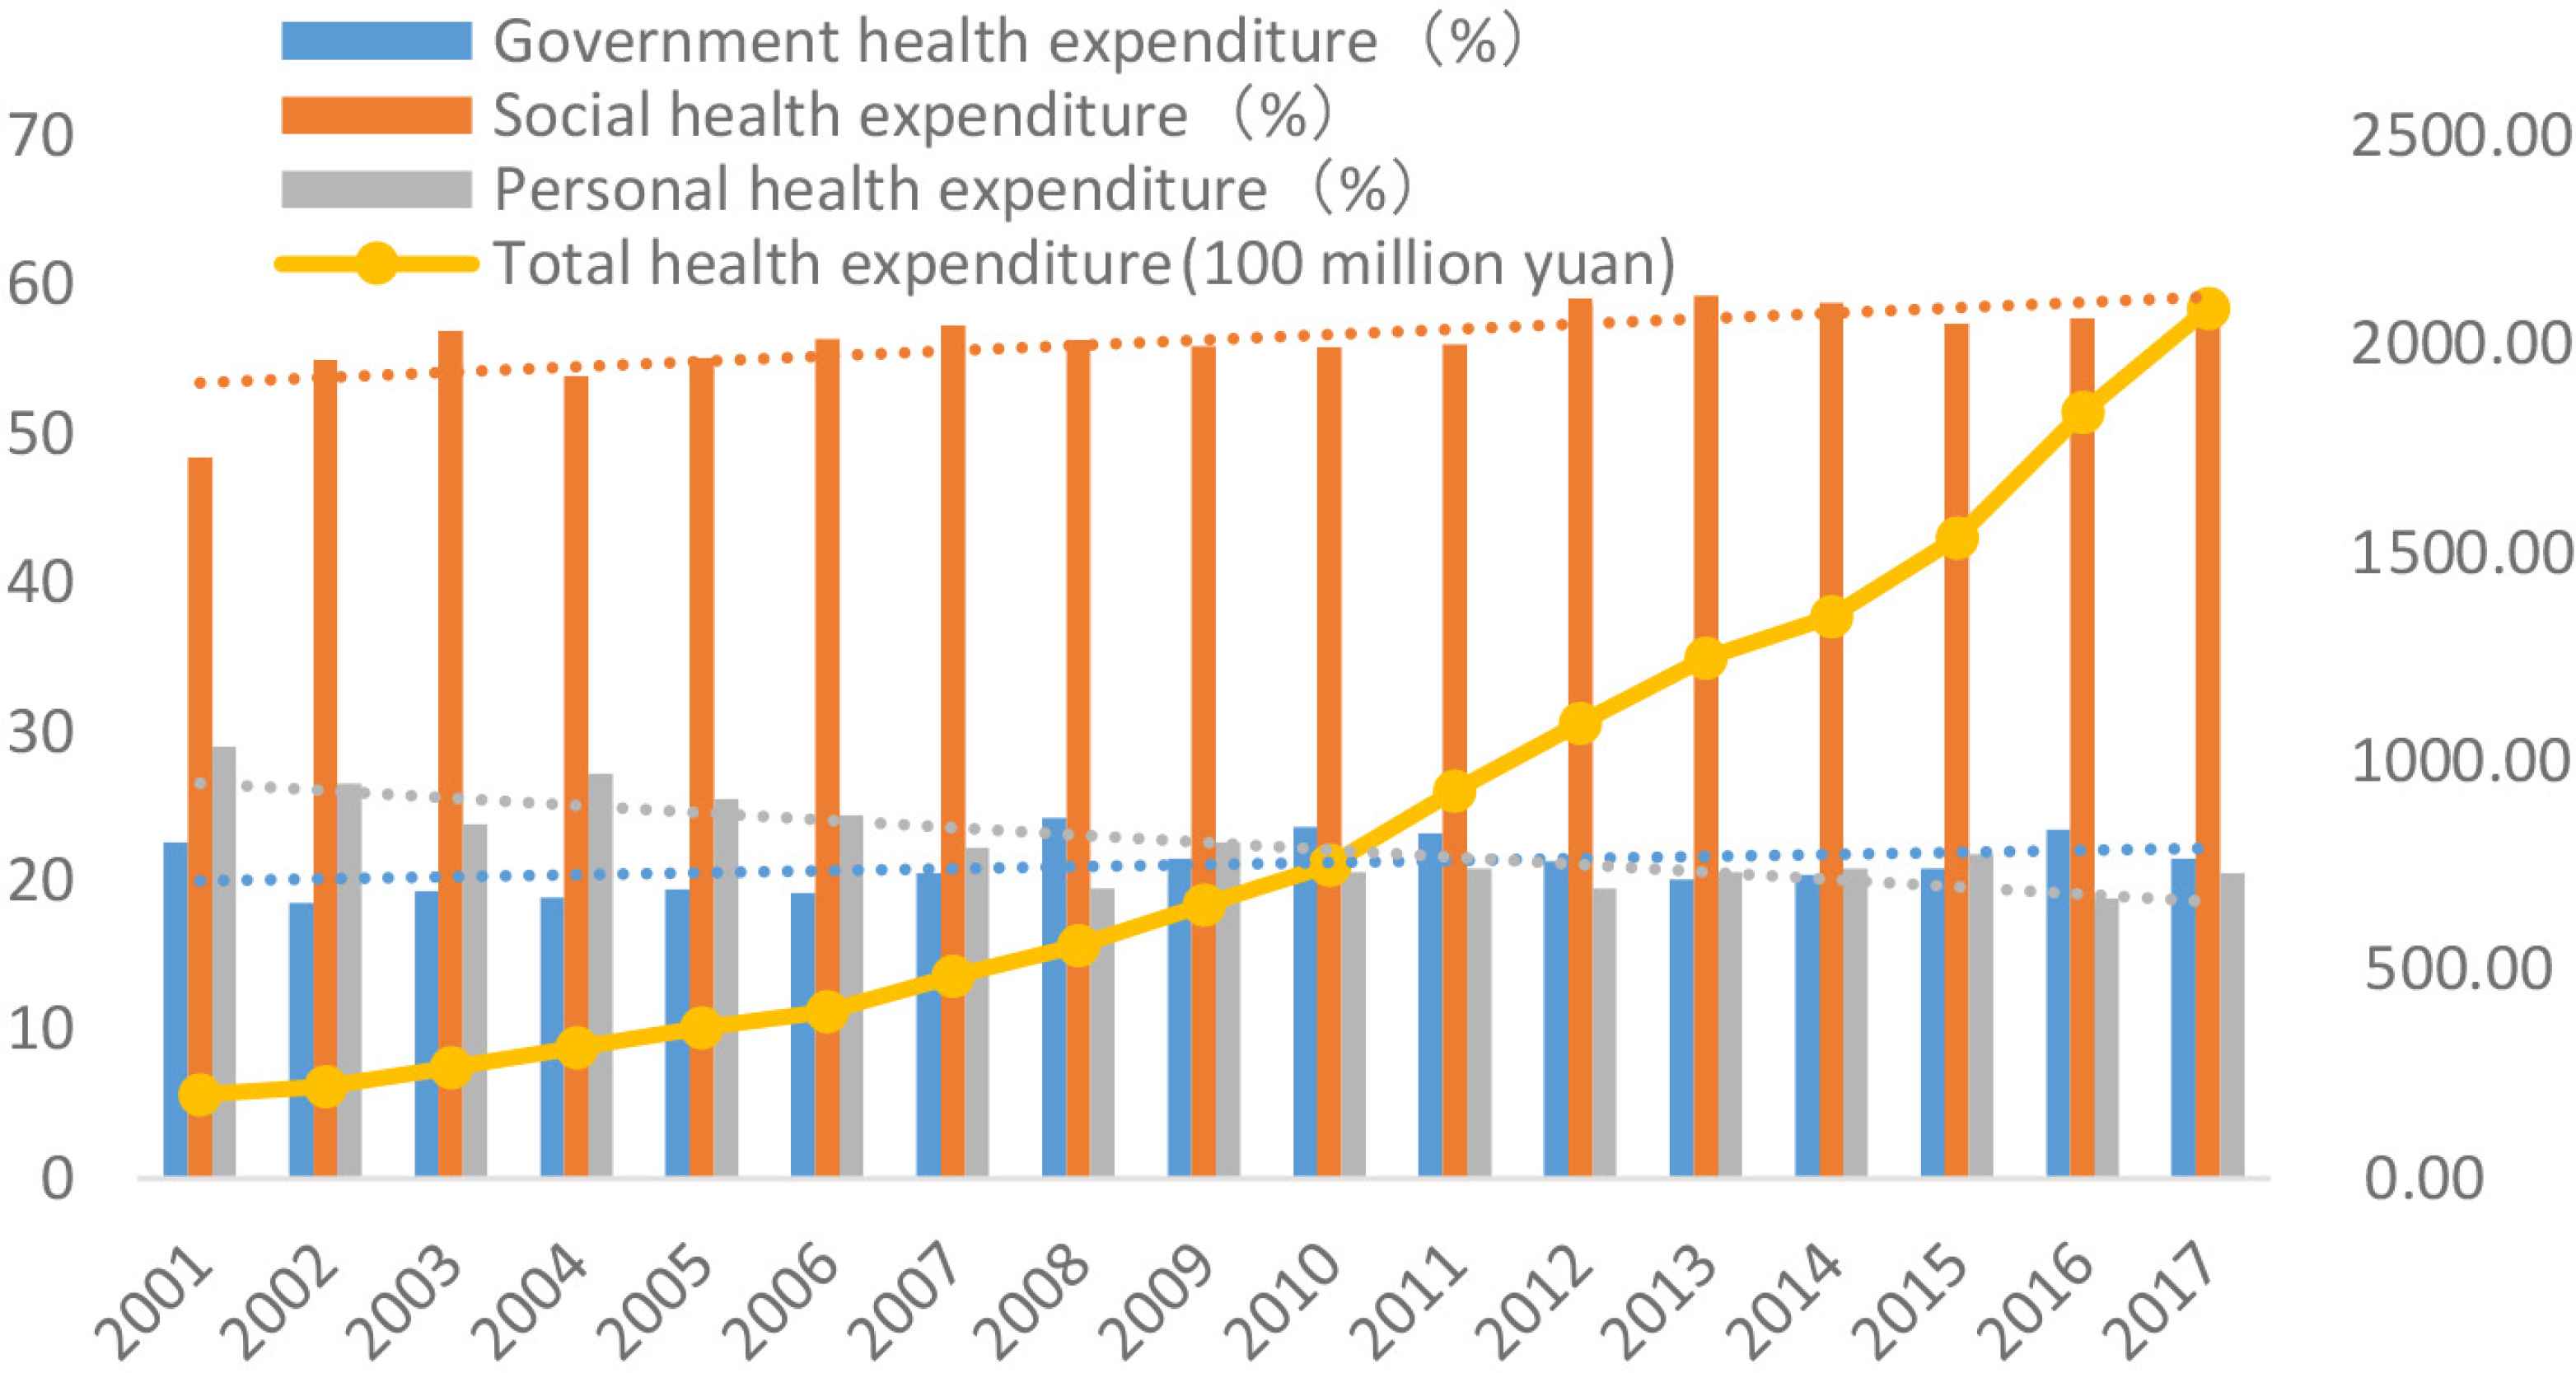
2004–2015 Shanghai health expenditure structure. Data source: Shanghai Statistical Yearbook 2005–2017.
In summary, LTCI needs corresponding aging care needs to exist objectively, meanwhile, the implementation of the policy is under great pressure: the shortage of nursing staff and the low salary, the impact of the special fund for LTCI on fiscal expenditures, and the collateral effect of COVID-19 have increased the uncertainty of public health expenditure.
5. CONCLUSION AND PROSPECT
This paper uses the GM (1,1) model to predict and analyze the total registered population and the number of elderly people aged 60 years and above in Shanghai in the next 10 years, combined with the health of the elderly population above 60 years old in the sixth census of Shanghai in 2010. Based on the census data, this article mainly draws the following conclusions:
Theoretical derivation shows that LTCI is affected by regional economic and socio-economic conditions in megacities. The micro-path and difference between LTCI products entering the enterprise production field and the household consumption field, among them, production insurance consumption depends on changes in wealth and capital stock. The larger the capital stock, the more production insurance consumption.
Empirical research shows that, first of all, the predicted population of long-term care needs in Shanghai can be obtained by calculation, which is much higher than the actual participating population in 2018 and 2019. The current gap in LTCI is large, especially for some disabled population. The largest increase indicates that the number of people in need of moderate care in the future is large, and the supply of mid-term care should be considered. Secondly, through the calculation of the expected number of people with disabilities in the nursing level and the corresponding number of people in Shanghai, combined with the current service industry salary, it is found that the nursing staff of LTCI has a large gap and low salary. Moreover, the number of corresponding nursing institutions is extremely small, and the degree of institutional care is low, which is not enough to support the current occupancy needs of disabled people for institutional care. Third, there is a certain pressure on the burden structure of Shanghai’s health expenses. Lastly, there is a certain pressure on the burden structure of Shanghai’s health expenses. The special fund expenditure for LTCI and the effect of COVID-19 have increased the uncertainty of public health expenditures. If the government increases the implementation of LTCI, it will inevitably increase the corresponding public resource expenditures. Several factors may exert a certain pressure on the development of long-term protection insurance.
Based on the above conclusions, this article gives the following suggestions:
To begin with, based on the results of theoretical derivation, the promotion of long-term protection insurance should be carried out with the idea of “large–medium–small” urban agglomerations. Good regional economy and material conditions are conducive to the consumption of LTCI. The first promotion of LTCI in big cities is to lay the foundation and to explore suitable development experience and consumption stock, which may be more beneficial to small and medium-sized cities.
Secondly, is to build a medical security system for LTCI for the elderly and improve supporting facilities. The increase in the degree of aging will promote health expenditures, especially after the outbreak of the new crown epidemic, the larger increase in health expenditures is foreseeable. In terms of public resources, China’s future trend is to further reduce personal health expenditures, the government should fully consider the proportion of personal contributions and medical pooling funds, and plan the corresponding resource allocation. In terms of the supply of supporting facilities, the salary of nursing staff should be appropriately increased based on the investment in pension welfare institutions and medical institutions.
Last but not least, it is to encourage corresponding commercial insurance policies to complement. On the one hand, from the above data, it can be seen that the government is facing greater pressure to build a comprehensive LTCI social security system, thus, we suggest to cooperate with commercial insurance companies to fully mobilize resources for LTCI exploration and play a complementary role in social security. On the other hand, is to actively try to combine with the corresponding pilot system, such as the possibility of combining with the housing pension system: Is it possible for the elderly to reverse mortgage the property and move into the designated institution of LTCI?
In summary, whether it is the form of universal social insurance in Japan or the mode of political and commercial cooperation in the United States, its core cannot be separated from the needs of people with LTCI. China’s current LTCI policy, in essence, is to draw lessons from the foreign pension system, the mode and development process of the implementation of foreign countries, are worth learning experience, especially on the elderly insurance group needs and the potential number of insurance. In the exploration of LTCI, for the insured, the degree of policy awareness is one aspect, and the definition of the insured population is another aspect. On the national side, the needs for the construction of pilot nursing service manpower, material resources, and the elderly care environment are worthy of in-depth exploration. Starting from the perspective of participants, it is extremely necessary to build a system that covers their health awareness, economic awareness, and policy awareness.
CONFLICTS OF INTEREST
The authors declare they have no conflicts of interest.
APPENDIX
| Year | Total population (10,000 people) | Population above 60 (10,000 people) | Proportion above 60 (%) | Aging growth rate (%) |
|---|---|---|---|---|
| 2004 | 1352.39 | 260.78 | 19.28 | – |
| 2005 | 1360.26 | 266.37 | 19.58 | 1.55 |
| 2006 | 1368.08 | 275.62 | 20.15 | 2.88 |
| 2007 | 1378.86 | 286.83 | 20.80 | 3.25 |
| 2008 | 1391.04 | 300.57 | 21.61 | 3.87 |
| 2009 | 1400.70 | 315.70 | 22.54 | 4.3 |
| 2010 | 1412.32 | 331.02 | 23.44 | 3.99 |
| 2011 | 1419.36 | 347.76 | 24.50 | 4.54 |
| 2012 | 1426.93 | 367.32 | 25.74 | 5.06 |
| 2013 | 1432.34 | 387.62 | 27.06 | 5.13 |
| 2014 | 1438.69 | 413.98 | 28.77 | 6.33 |
| 2015 | 1442.97 | 435.95 | 30.21 | 4.99 |
| 2016 | 1450.00 | 457.80 | 31.57 | 4.50 |
| 2017 | 1455.13 | 481.61 | 33.10 | 4.83 |
Data source: “Shanghai Statistical Yearbook 2004–2018” obtained after calculation, corresponding to Figure 1 in the article.
Shanghai’s total registered population and aging growth rate
| Year | Original population (10,000 people) | Predicted population (10,000 people) |
| 2004 | 1352.39 | 1352.39 |
| 2005 | 1360.26 | 1373.946237 |
| 2006 | 1368.08 | 1381.723156 |
| 2007 | 1378.86 | 1389.544095 |
| 2008 | 1391.04 | 1397.409303 |
| 2009 | 1400.70 | 1405.31903 |
| 2010 | 1412.32 | 1413.273528 |
| 2011 | 1419.36 | 1421.273051 |
| 2012 | 1426.93 | 1429.317853 |
| 2013 | 1432.34 | 1437.408192 |
| 2014 | 1438.69 | 1445.544324 |
| 2015 | 1442.97 | 1453.726508 |
| 2016 | 1450.00 | 1461.955006 |
| 2017 | 1455.13 | 1470.23008 |
| 2018 | * | 1478.551993 |
| 2019 | * | 1486.92101 |
| 2020 | * | 1495.337398 |
| 2021 | * | 1503.801426 |
| 2022 | * | 1512.313362 |
| Year | Original population (10,000 people) | Predicted population (10,000 people) |
| 2023 | * | 1520.873478 |
| 2024 | * | 1529.482046 |
| 2025 | * | 1538.139342 |
| 2026 | * | 1546.84564 |
| 2027 | * | 1555.601219 |
| Year | Original population above 60 (10,000 people) | Predicted population above 60 (10,000 people) |
| 2004 | 260.78 | 260.78 |
| 2005 | 266.37 | 258.5896295 |
| 2006 | 275.62 | 272.2621027 |
| 2007 | 286.83 | 286.657484 |
| 2008 | 300.57 | 301.8139958 |
| 2009 | 315.7 | 317.7718816 |
| 2010 | 331.02 | 334.5735126 |
| 2011 | 347.76 | 352.2635005 |
| 2012 | 367.32 | 370.8888154 |
| 2013 | 387.62 | 390.4989111 |
| 2014 | 413.98 | 411.1458563 |
| 2015 | 435.95 | 432.8844725 |
| 2016 | 457.8 | 455.77248 |
| 2017 | 481.61 | 479.8706506 |
| 2018 | * | 505.2429698 |
| 2019 | * | 531.9568059 |
| 2020 | * | 560.0830893 |
| 2021 | * | 589.6965005 |
| 2022 | * | 620.875669 |
| 2023 | * | 653.7033813 |
| 2024 | * | 688.2668013 |
| 2025 | * | 724.6577016 |
| 2026 | * | 762.9727068 |
| 2027 | * | 803.3135509 |
| Year | Original proportion above 60 (%) | Predicted proportion above 60 (%) |
| 2004 | 19.28 | 19.28 |
| 2005 | 19.58 | 18.82 |
| 2006 | 20.15 | 19.70 |
| 2007 | 20.80 | 20.63 |
| 2008 | 21.61 | 21.60 |
| 2009 | 22.54 | 22.61 |
| 2010 | 23.44 | 23.67 |
| 2011 | 24.50 | 24.79 |
| 2012 | 25.74 | 25.95 |
| 2013 | 27.06 | 27.17 |
| 2014 | 28.77 | 28.44 |
| 2015 | 30.21 | 29.78 |
| 2016 | 31.57 | 31.18 |
| 2017 | 33.10 | 32.64 |
| 2018 | * | 34.17 |
| 2019 | * | 35.78 |
| 2020 | * | 37.46 |
| 2021 | * | 39.21 |
| 2022 | * | 41.05 |
| 2023 | * | 42.98 |
| 2024 | * | 45.00 |
| 2025 | * | 47.11 |
| 2026 | * | 49.32 |
| 2027 | * | 51.64 |
Note: Forecast data after 2017, corresponding to Figure 2 in the article. *represents data not yet available.
Population forecast
| Age distribution | Total (10,000 people) | Health (10,000 people) | Not disabled (10,000 people) | Partially disabled (10,000 people) | Completely disabled (10,000 people) |
|---|---|---|---|---|---|
| Total | 345592 | 150971 | 150631 | 31175 | 12815 |
| 60–64 years old | 113829 | 71877 | 37371 | 3842 | 739 |
| 65–69 years old | 66121 | 34007 | 27648 | 3681 | 785 |
| 70–74 years old | 52401 | 19720 | 26785 | 4679 | 1217 |
| 75–79 years old | 55363 | 15428 | 29867 | 7583 | 2485 |
| 80–84 years old | 34796 | 6714 | 18462 | 6468 | 3152 |
| 85–89 years old | 16979 | 2606 | 8119 | 3607 | 2647 |
| 90–94 years old | 5071 | 538 | 2050 | 1105 | 1378 |
| 95–99 years old | 958 | 76 | 301 | 201 | 380 |
| Above 100 years old | 74 | 5 | 28 | 9 | 32 |
Data source: Shanghai Bureau of Statistics-“The Sixth Census Bulletin” is compiled and calculated.
Distribution of disability among the elderly population
| Year | Total health expenditure (billion yuan) | Health expenditure increase in volume (billion yuan) |
|---|---|---|
| 2004 | 315.48 | – |
| 2005 | 362.13 | 46.65 |
| 2006 | 401.46 | 39.33 |
| 2007 | 485.67 | 84.21 |
| 2008 | 559.83 | 74.16 |
| 2009 | 656.66 | 96.83 |
| 2010 | 751.99 | 95.33 |
| 2011 | 931 | 179.01 |
| 2012 | 1092.35 | 161.35 |
| 2013 | 1248.68 | 156.33 |
| 2014 | 1347.79 | 99.11 |
| 2015 | 1536.6 | 188.81 |
| 2016 | 1838 | 301.4 |
Data source: Shanghai Bureau of Statistics, corresponding to Figure 4 in the article.
Health expenditure in Shanghai
Footnotes
This article is supported by:
The “Strategic Economy and Military-civilian Integration” Interdisciplinary Discipline (GJJ2019163) of Beijing Universities’ high-precision disciplines, the “First-class Discipline” construction project of the Central University of Finance and Economics, “Research on Modernization of Catastrophe Risk Management and Natural Disaster Governance”.
The National Ethnic Affairs Commission in 2020 Supported by the project “Research on Rural Revitalization and Built-in Financial Innovation in Western Tibetan Areas in the Post-Poverty Era” (2020-GMB-030).
National Natural Science Foundation of China, general project, project name: research on the mechanism and early warning mechanism of nursing risk in elderly care institutions; project batch number: 71871147.
REFERENCES
Cite this article
TY  - JOUR
AU  - Guo Jing
AU  - Xiaojun Pan
AU  - Chengyi Pu
PY  - 2021
DA  - 2021/03/16
TI  - Analysis of Long-term Care Insurance Demand of Megalopolis in China under the Background of Aging of Population—Take Shanghai as an Example†
JO  - Journal of Risk Analysis and Crisis Response
SP  - 16
EP  - 25
VL  - 11
IS  - 1
SN  - 2210-8505
UR  - https://doi.org/10.2991/jracr.k.210310.001
DO  - 10.2991/jracr.k.210310.001
ID  - Jing2021
ER  -