
Interannual Variation and Hazard Analysis of Meteorological Disasters in East China
- DOI
- 10.2991/jracr.k.200117.004How to use a DOI?
- Keywords
- Meteorological disaster; interannual variation; hazard analysis; East China
- Abstract
Based on the historical data of meteorological disasters in East China during 2004–2015, the overall characteristics, interannual variations and the hazards of meteorological disasters in different provinces of East China were analyzed. The results indicated that flood disaster (including landslide and mud-rock flow) induced by rainstorms had caused the largest affected area and total failure area of crops, and also caused the largest number of affected people and collapsed houses. Strong convection weather (including gale, hail, thunder and lightning) disaster resulted in the largest number of deaths and typhoon disaster caused the greatest direct economic losses. There were significant decreasing trends in the affected area and the total failure area of crops, and the number of affected people and deaths during 2004–2015, while the direct economic loss caused by meteorological disasters showed no significant trend in East China. The hazards of meteorological disasters had obvious regional differences. In the northern part of East China, the hazards of drought and strong convection weather disasters were higher, but in the southern part, there were higher hazards of flood disaster. In the eastern coastal areas of East China, the hazards of typhoon disaster were higher. Hazard analysis of meteorological disasters has important significances for disaster prevention and mitigation, risk management and crisis response.
- Copyright
- © 2020 The Authors. Published by Atlantis Press SARL.
- Open Access
- This is an open access article distributed under the CC BY-NC 4.0 license (http://creativecommons.org/licenses/by-nc/4.0/).
1. INTRODUCTION
Meteorological disaster is one of the natural disasters that cause the most casualties and losses in the world [1–3]. In recent years, due to global warming and the intensification of human activities, meteorological disasters (such as floods, droughts, hurricanes, extreme heat or cold, snowstorms, etc.) in many countries have become more frequent [4–7]. These disasters pose a serious threat to people’s life and property security, agricultural production, water resources and ecosystems [8–11]. China is one of the countries in the world with frequent meteorological disasters, various kinds of disasters and severe losses from disasters. The losses caused by meteorological disasters account for about 70% of the total losses of all kinds of natural disasters in China [1]. Wu et al. [12] showed that meteorological disasters accounted for 55% of the deaths and 87% of the direct economic losses caused by natural hazards in China during 1994–2013. Hence, the variations and trends of meteorological disasters are of great significance to people’s life and property, national economic construction and ecological security in China [13–15].
Located at the southeastern edge of Eurasian continent and near the northwest Pacific Ocean, East China is significantly affected by the East Asian monsoon, and the climate has obvious interdecadal, interannual and seasonal variations [16]. For example, Li et al. [17] showed that there were significant interdecadal changes of the precipitation extremes in East China during 1960–2009, and in recent 20 years, the precipitation extremes occurred more frequently than those in the earlier 30 years. With global warming, the probability and intensity of extreme weather and climate events such as high temperature, rainstorm and typhoon in East China will also increase [18,19]. In addition, East China is one of the most densely populated and economically concentrated regions in China [16]. Meteorological disasters and secondary disasters have caused huge economic losses to East China, and caused extensive social impacts and public concerns [5,20,21]. The trend analysis of meteorological disaster is essential for regional disaster prevention and mitigation [12]. Therefore, we analyzed the overall characteristics, trends and the hazards of meteorological disasters in different provinces of East China based on historical data of various meteorological disasters during 2004–2015, to provide reference for regional disaster prevention and reduction and sustainable development strategy [22].
2. DATA AND METHODS
2.1. Data
Annual total losses of all meteorological disasters in each province (municipality) of East China during 2004–2015 were used in this paper. In addition, annual losses of flood (including landslide and mud-rock flow) induced by rainstorms, drought, strong convection weather (including gale, hail and thunder and lightning), typhoon and low-temperature and snow disaster respectively in each province (municipality) were also applied here. These data were from the Yearbook of Meteorological Disasters in China [23], and disaster losses mainly included the affected area of crops, the total failure area of crops, the affected population, the dead population, the number of houses collapsed and damaged, the direct economic losses and so on.
2.2. Methods
In this study, East China includes six provinces, i.e. Shandong, Jiangsu, Anhui, Zhejiang, Fujian and Jiangxi province, and Shanghai municipality. The statistical data of meteorological disaster losses in the whole East China from 2004 to 2015 were obtained through directly summarizing the corresponding disaster losses of each province and municipality. The trend analysis of meteorological disasters can provide reference for disaster prevention [12]. The overall characteristics and changes of meteorological disaster losses in East China in recent 12 years were analyzed using the statistical methods such as mean value, extreme value and linear trend analysis, and the differences of disaster losses among different disaster categories and different provinces were compared and analyzed. The linear trends of the time series of meteorological disaster losses were calculated by using the ordinary least squares regression method, and the statistical significance was evaluated by the Pearson correlation coefficients between the losses and the times at the 0.05 significance level. According to the area of each province (municipality) in East China, the amount of disaster loss per unit area was calculated and was used as the hazard index of meteorological disasters. The direct economic losses were analyzed based on the annual statistical value, without adjustment by multiple price indices according to the base year.
3. RESULTS
3.1. The overall characteristics of meteorological disasters in East China
From 2004 to 2015, meteorological disasters had affected an annual averaged area of 6.52 × 10⁶ hectares of crops in all provinces of East China, of which the area with total crop failure was 55.11 × 10⁴ hectares. The number of annual affected population caused by meteorological disasters was 87.78 × 10⁶ people, of which the deaths were 398 people. Furthermore, meteorological disasters had caused 25.90 × 10⁴ houses collapsed and 72.60 × 10⁴ houses damaged, with a direct economic loss of 77.99 × 10⁹ Yuan annually (Table 1). Floods (including landslide and mud-rock flow) induced by rainstorms had caused the largest affected area and the largest total failure area of crops, and also led to the greatest number of people affected and houses collapsed during 2004–2015, accounting for 35%, 51%, 29% and 49% of the total losses from meteorological disasters respectively. Strong convection weather (including gale, hail, thunder and lightning) had resulted in the greatest number of deaths and houses damaged. Typhoons had caused the greatest direct economic losses and more deaths, and droughts also caused more people affected and more area of crops affected.
| Categories of meteorological disasters | Area of crops (104 hm2) | Number of people | Number of houses (104) | Direct economic loss (109 Yuan) | |||
|---|---|---|---|---|---|---|---|
| Affected area | Total failure area | Affected population (104) | Death population | Collapsed houses | Damaged houses | ||
| Rainstorm-induced flood | 227.8 | 27.9 | 2535.1 | 78.3 | 12.8 | 30.8 | 26.43 |
| Drought | 180.6 | 10.0 | 2154.2 | 7.61 | |||
| Strong convection weather | 58.5 | 4.8 | 1179.6 | 144.3 | 4.5 | 35.1 | 6.56 |
| Typhoon | 100.8 | 4.4 | 1800.3 | 115.6 | 6.9 | 28.87 | |
| Low-temperature and snow | 78.4 | 6.4 | 1037.0 | 6.3 | 1.7 | 6.7 | 8.41 |
| Other | 6.1 | 1.6 | 71.6 | 53.6 | 0 | 0 | 0.11 |
| Total | 652.2 | 55.1 | 8777.8 | 398.1 | 25.9 | 72.6 | 77.99 |
Mean annual loss from meteorological disasters in East China during 2004–2015
3.2. The interannual variations in the affected area and total failure area of crops
During 2004–2015, the affected area and the total failure area of crops caused by meteorological disasters were all decreasing, except for the total failure area caused by typhoon disaster in East China (Figure 1). The decreasing trends in the affected area and the total failure area of crops were statistically significant for the total meteorological disasters and strong convection weather (including gale, hail, thunder and lightning) disasters, but for other meteorological disasters, including floods (including landslide and mud-rock flow) induced by rainstorms, droughts, typhoons, and low-temperature and snow disasters, the trends were not significant.
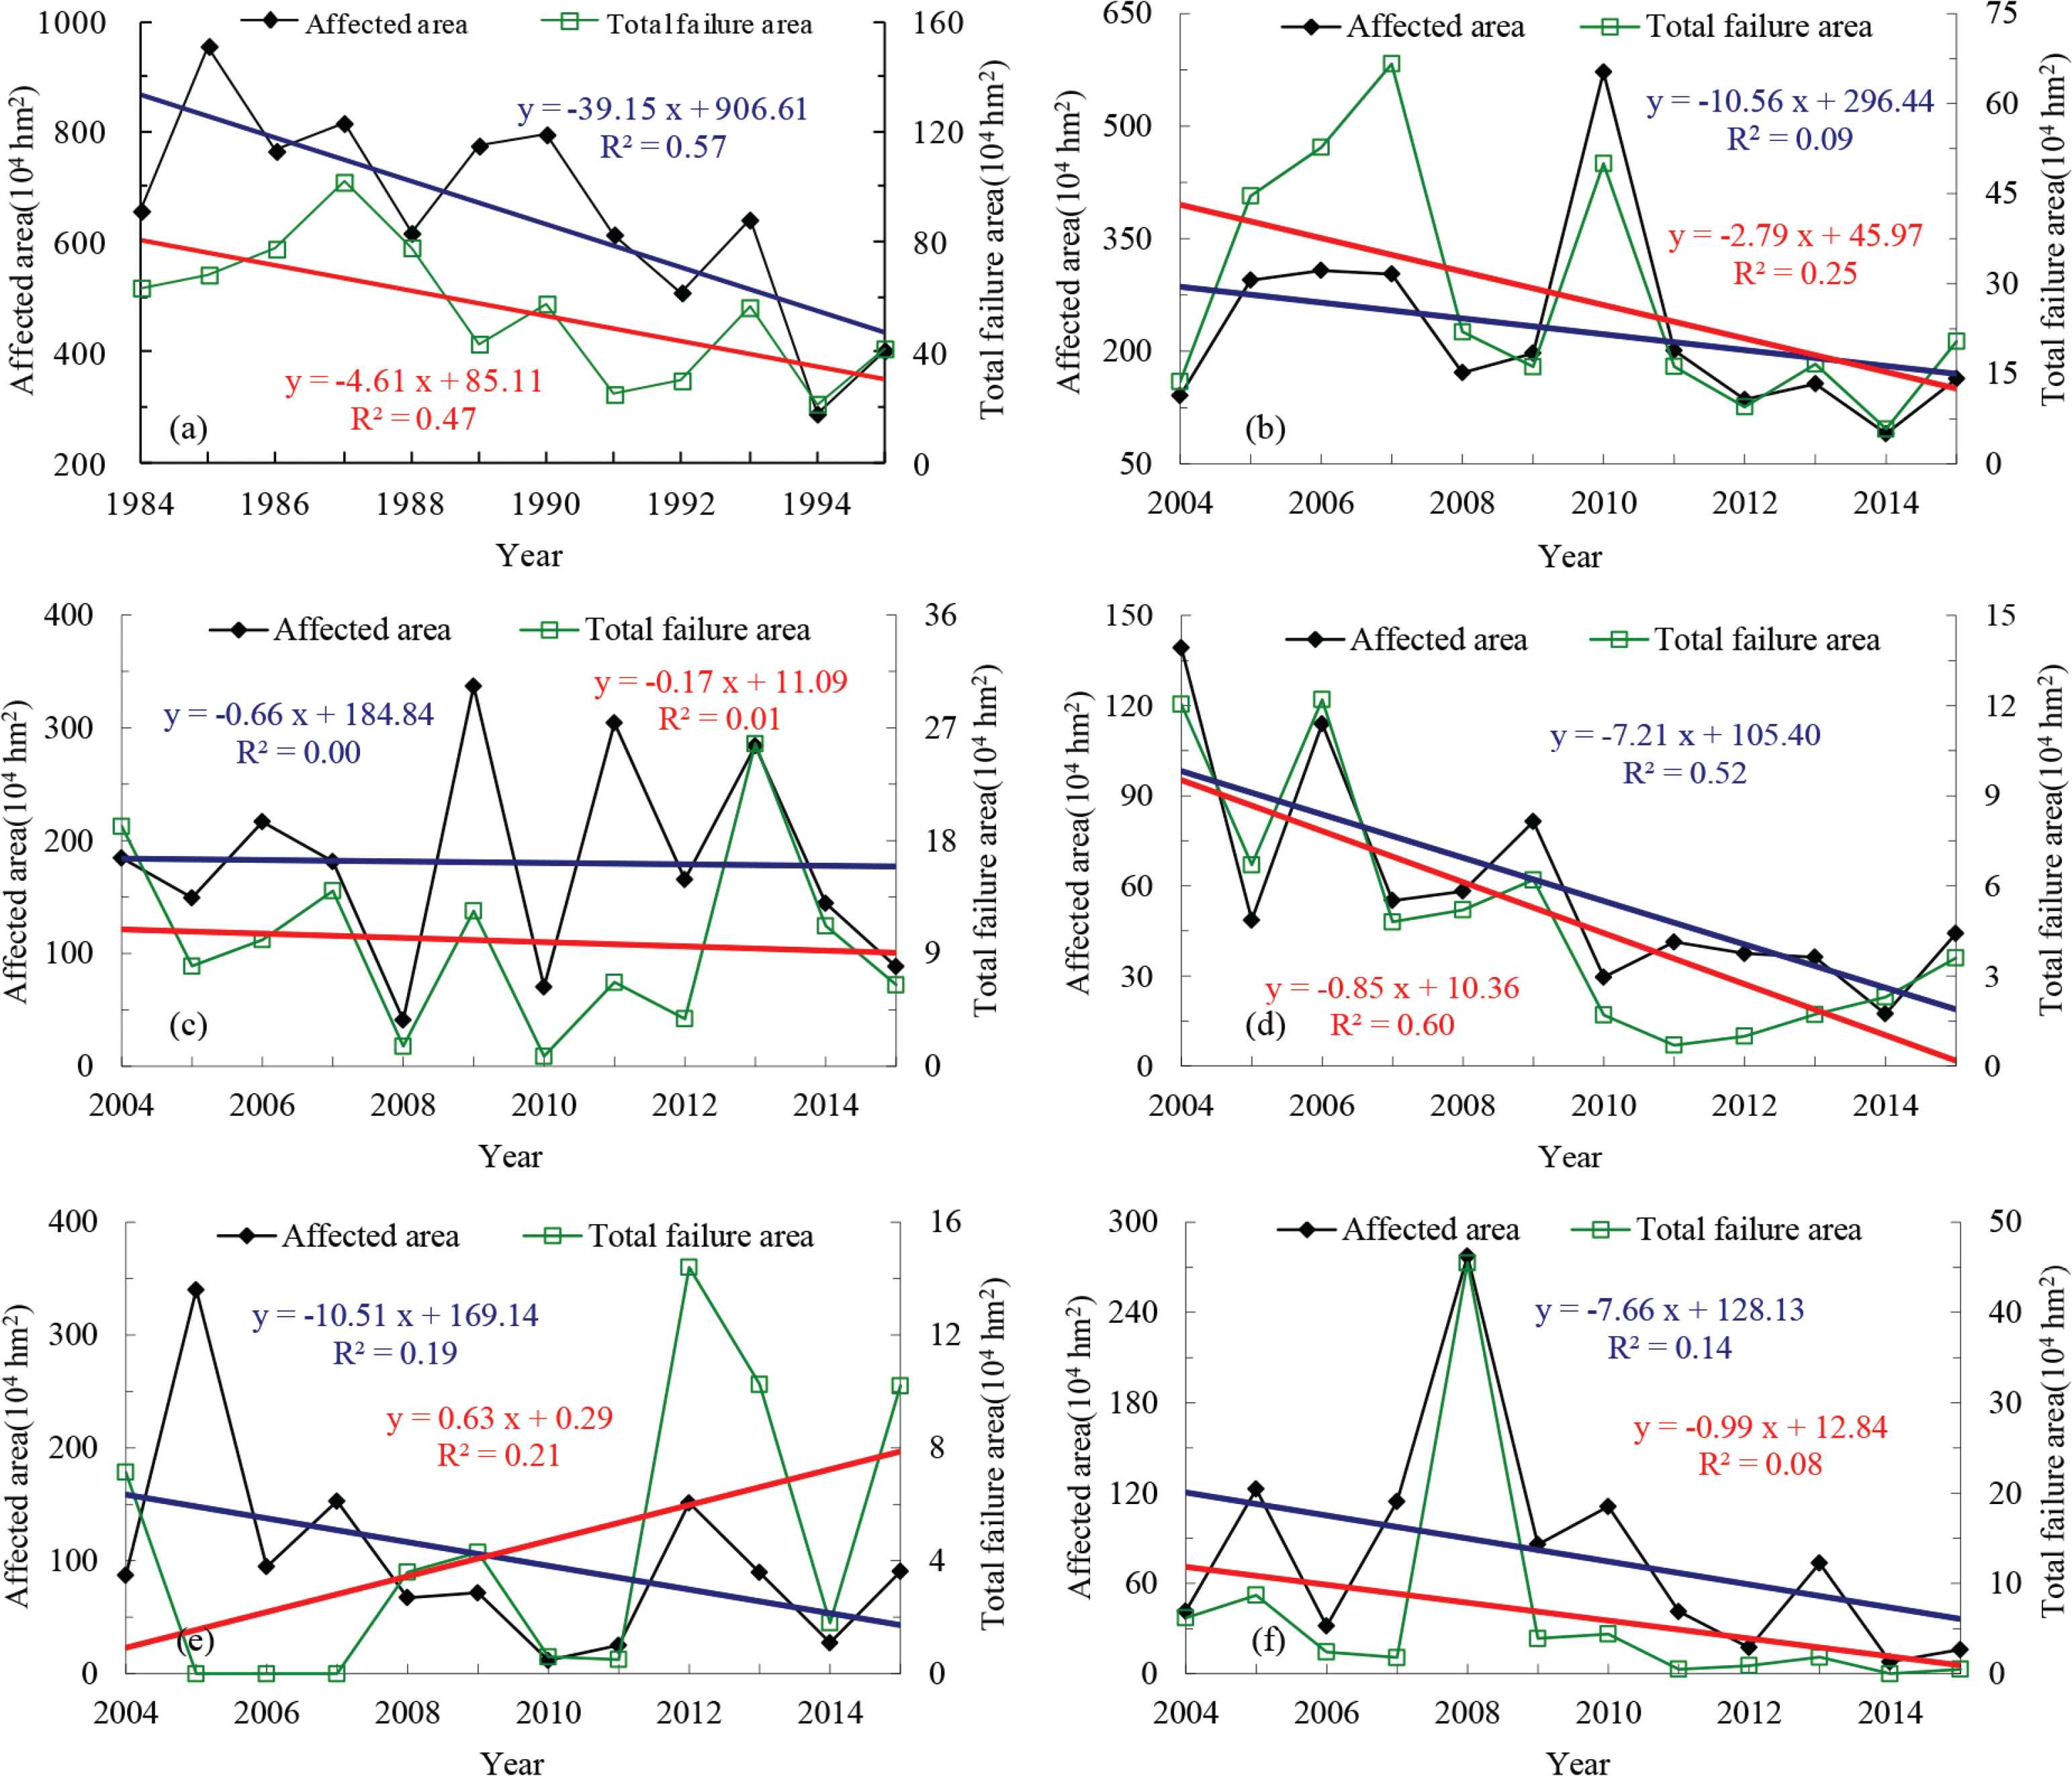
Trends in the affected area and total failure area of crops caused by meteorological disasters in East China during 2004–2015. (a) Total meteorological disasters, (b) flood disaster, (c) drought disaster, (d) strong convection weather disaster, (e) typhoon disaster, (f) low-temperature and snow disaster
The affected area and the total failure area of crops caused by total meteorological disasters had decreased at a rate of 391.5 × 10⁴ and 46.1 × 10⁴ hectares per decade, respectively, from 2004 to 2015 (Figure 1a). For the flood disaster, the affected area and the total failure area decreased at a rate of 105.6 × 10⁴ and 27.9 × 10⁴ hectares per decade respectively (Figure 1b), and the trends were 6.6 × 10⁴ and 1.7 × 10⁴ hectares per decade respectively for drought disaster (Figure 1c). The affected area and the total failure area of crops caused by strong convection weather disaster had decreased with the rate of 72.1 × 10⁴ and 8.5 × 10⁴ hectares per decade, respectively in East China (Figure 1d). For the typhoon disaster, the total affected area of crops had decreased at a rate of 105.1 × 10⁴ hectares per decade from 2004 to 2015, but the total failure area of crops had increased at a rate of 6.3 × 10⁴ hectares per decade (Figure 1e). Both the total affected area and the total failure area of crops caused by low-temperature and snow disasters in East China decreased at a rate of 76.6 × 10⁴ and 9.9 × 10⁴ hectares per decade respectively (Figure 1f).
3.3. The interannual variations in the affected population and deaths
Over the past 12 years, the number of people affected and the number of deaths by total meteorological disasters also decreased significantly in East China, at a rate of 52.8 × 10⁶ people and 631 people per decade respectively (Figure 2a). The affected population and the deaths caused by flood disaster also decreased at a rate of 6.6 × 10⁶ people and 32.9 people per decade respectively, but the trends were also not statistically significant (Figure 2b). Meanwhile, the affected population caused by drought disaster had increased at a rate of 6.3 × 10⁶ people per decade, and the population with poor drinking water had decreased at a rate of 7.9 × 10⁵ people per decade, but both trends were not significant (Figure 2c). For the strong convection weather disaster, the affected population and the deaths had decreased significantly at a rate of 13.9 × 10⁶ people and 190.8 people per decade respectively (Figure 2d), and the affected population and deaths caused by typhoon disaster also decreased significantly at a rate of 22.5 × 10⁶ people and 336.6 people per decade respectively (Figure 2e). The deaths caused by typhoon disaster was at a low level after 2008. The affected population and the deaths caused by low-temperature and snow disasters had decreased by 12.9 × 10⁶ people and 5.1 people per decade respectively, though the trends were not statistically significant (Figure 2f).
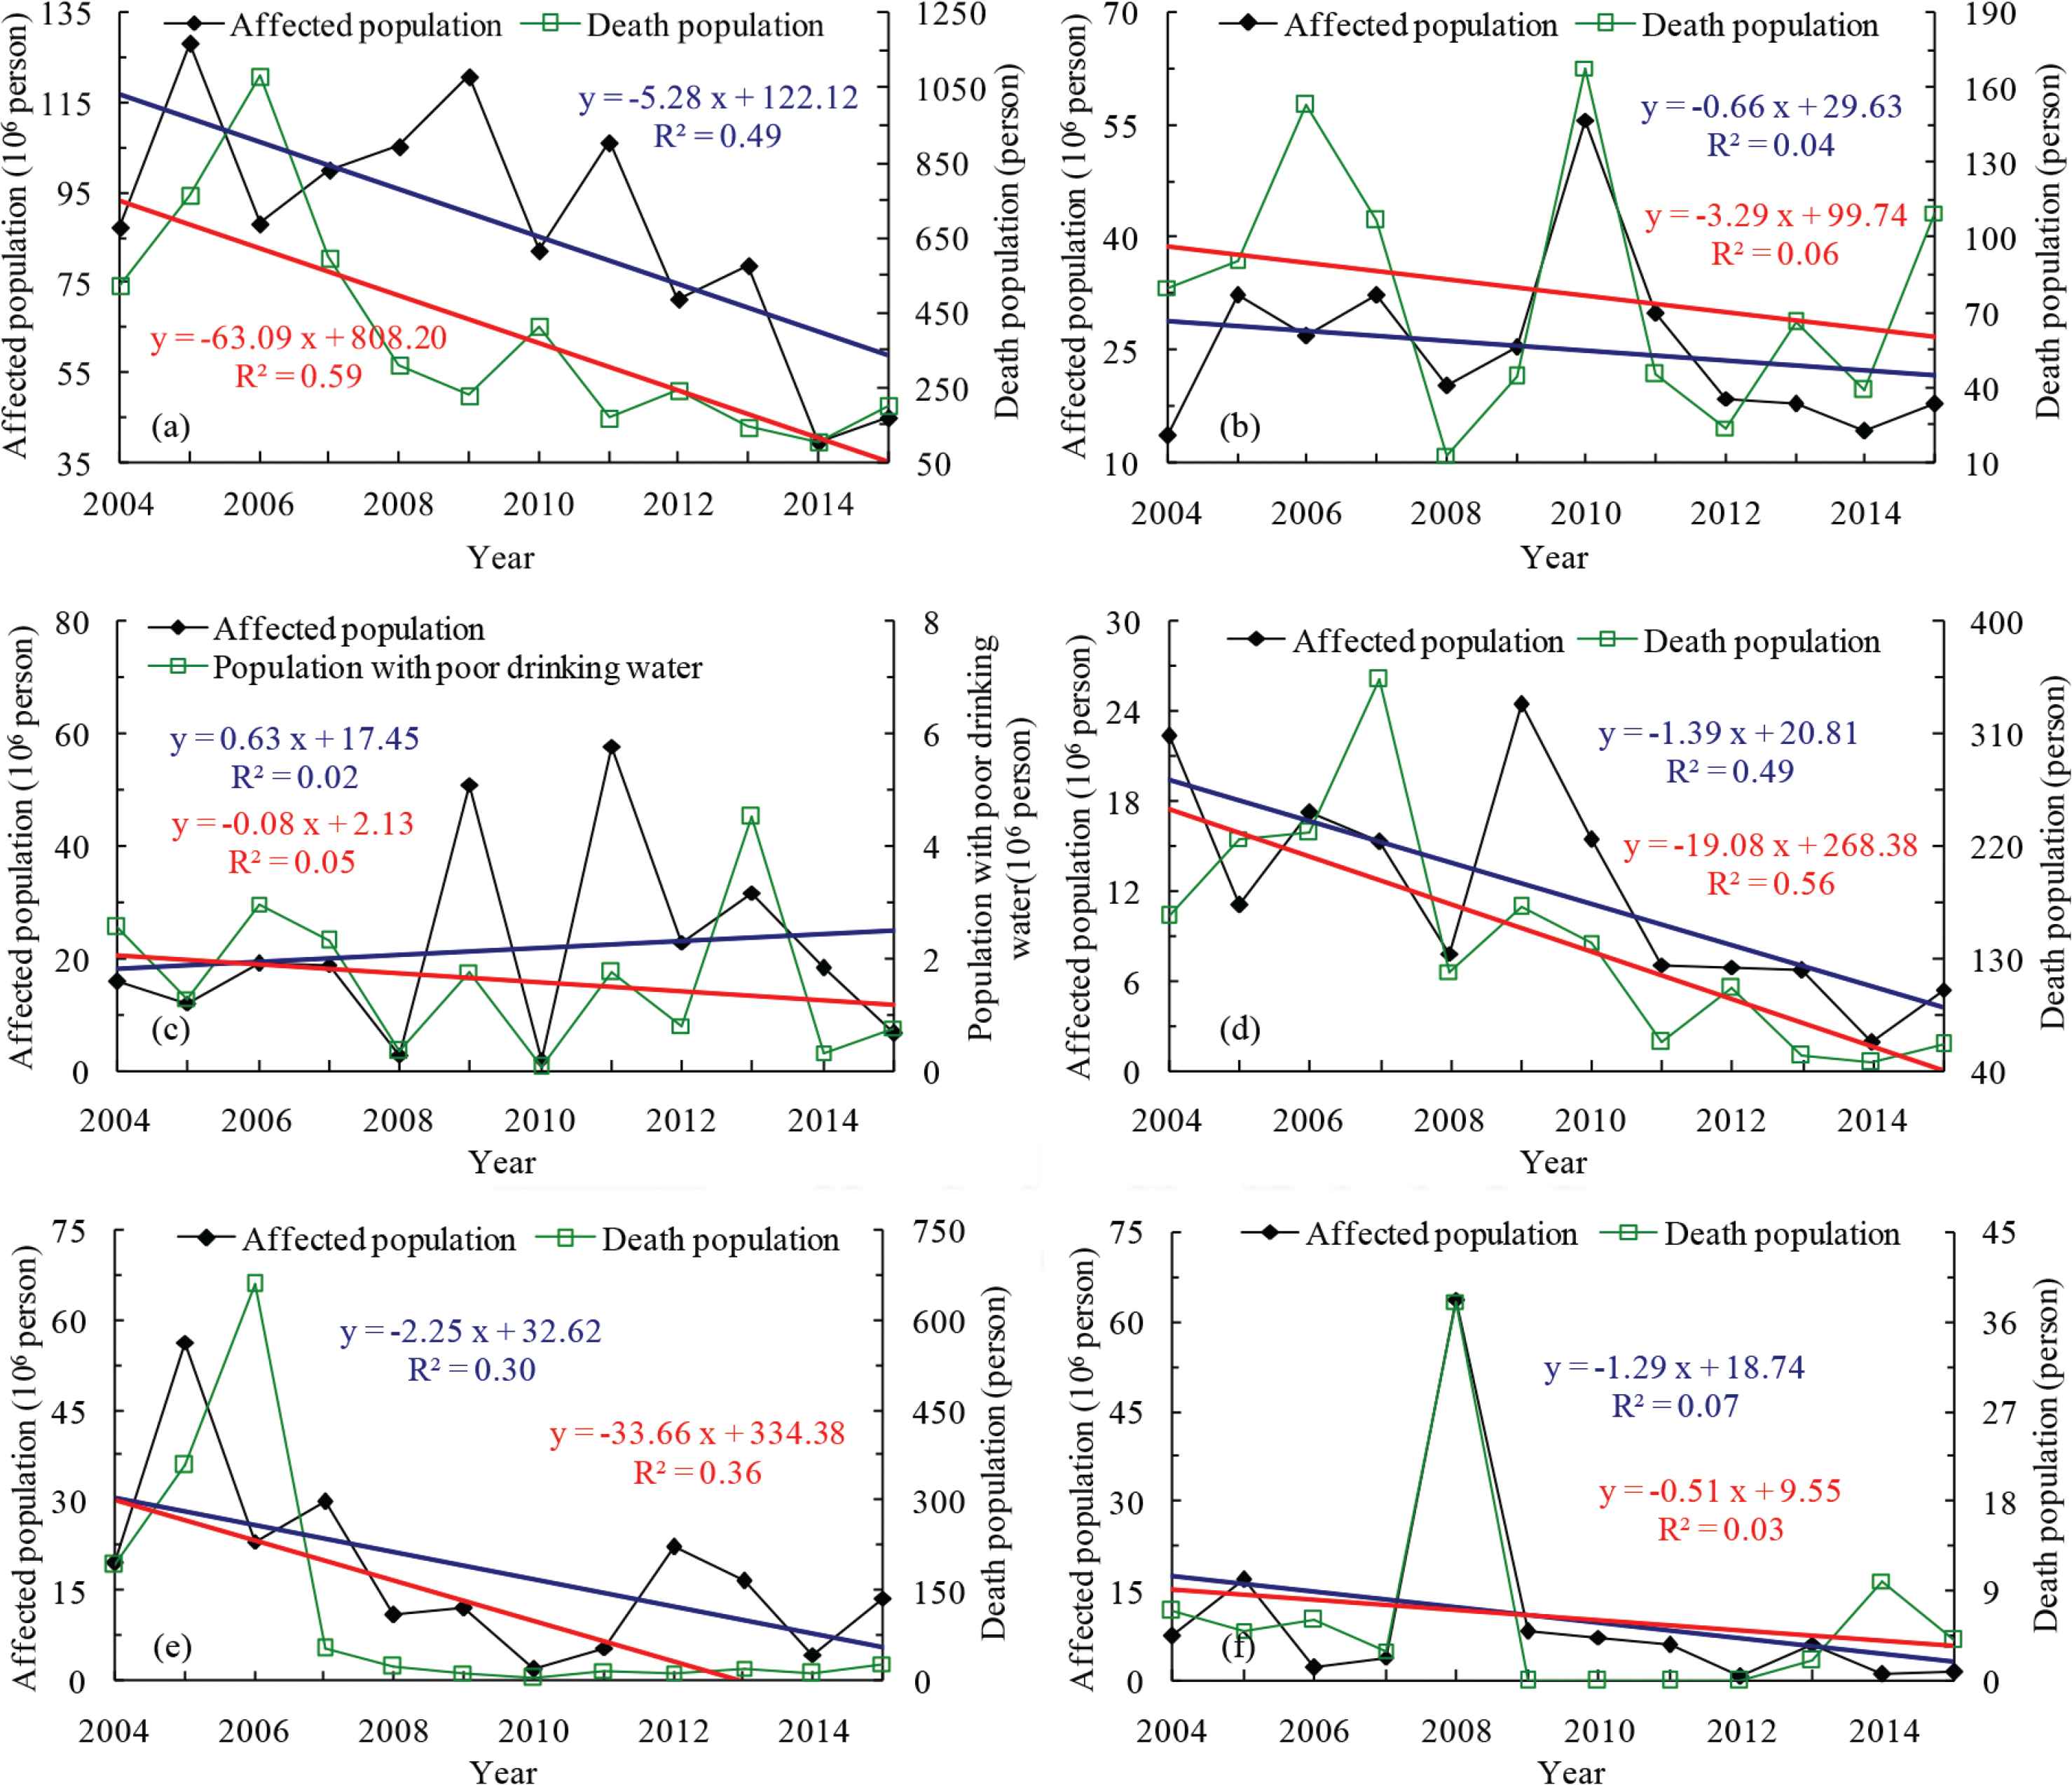
Trends in the affected population and the deaths caused by meteorological disasters in East China from 2004 to 2015. (a) Total meteorological disasters, (b) flood disaster, (c) drought disaster, (d) strong convection weather disaster, (e) typhoon disaster, (f) low-temperature and snow disaster
3.4. The interannual variations in the collapsed and damaged houses
In East China, the number of houses collapsed and damaged by flood disaster had fallen by 15.2 × 10⁴ and 25.0 × 10⁴ per decade respectively over the past 12 years, though the trends were not statistically significant (Figure 3a). The trends of the number of houses collapsed by strong convection weathers and typhoons were statistically significant, and the trends of the number of houses damaged by strong convection weathers and the emergency relocation and resettlement population caused by typhoons were also significant (Figures 3b and 3c). The number of houses collapsed and damaged by strong convection weather disaster had decreased by 11.9 × 10⁴ and 72.7 × 10⁴ respectively per decade (Figure 3b). The number of collapsed houses caused by typhoon disaster had decreased by 18.3 × 10⁴ per decade, and the number of emergency relocation and resettlement population had decreased at 442.9 × 10⁴ people per decade (Figure 3c). For low-temperature and snow disasters, the number of houses collapsed and damaged had decreased at a rate of 2.7 × 10⁴ and 10.5 × 10⁴ respectively in the past 12 years, but the change trend was not statistically significant (Figure 3d).
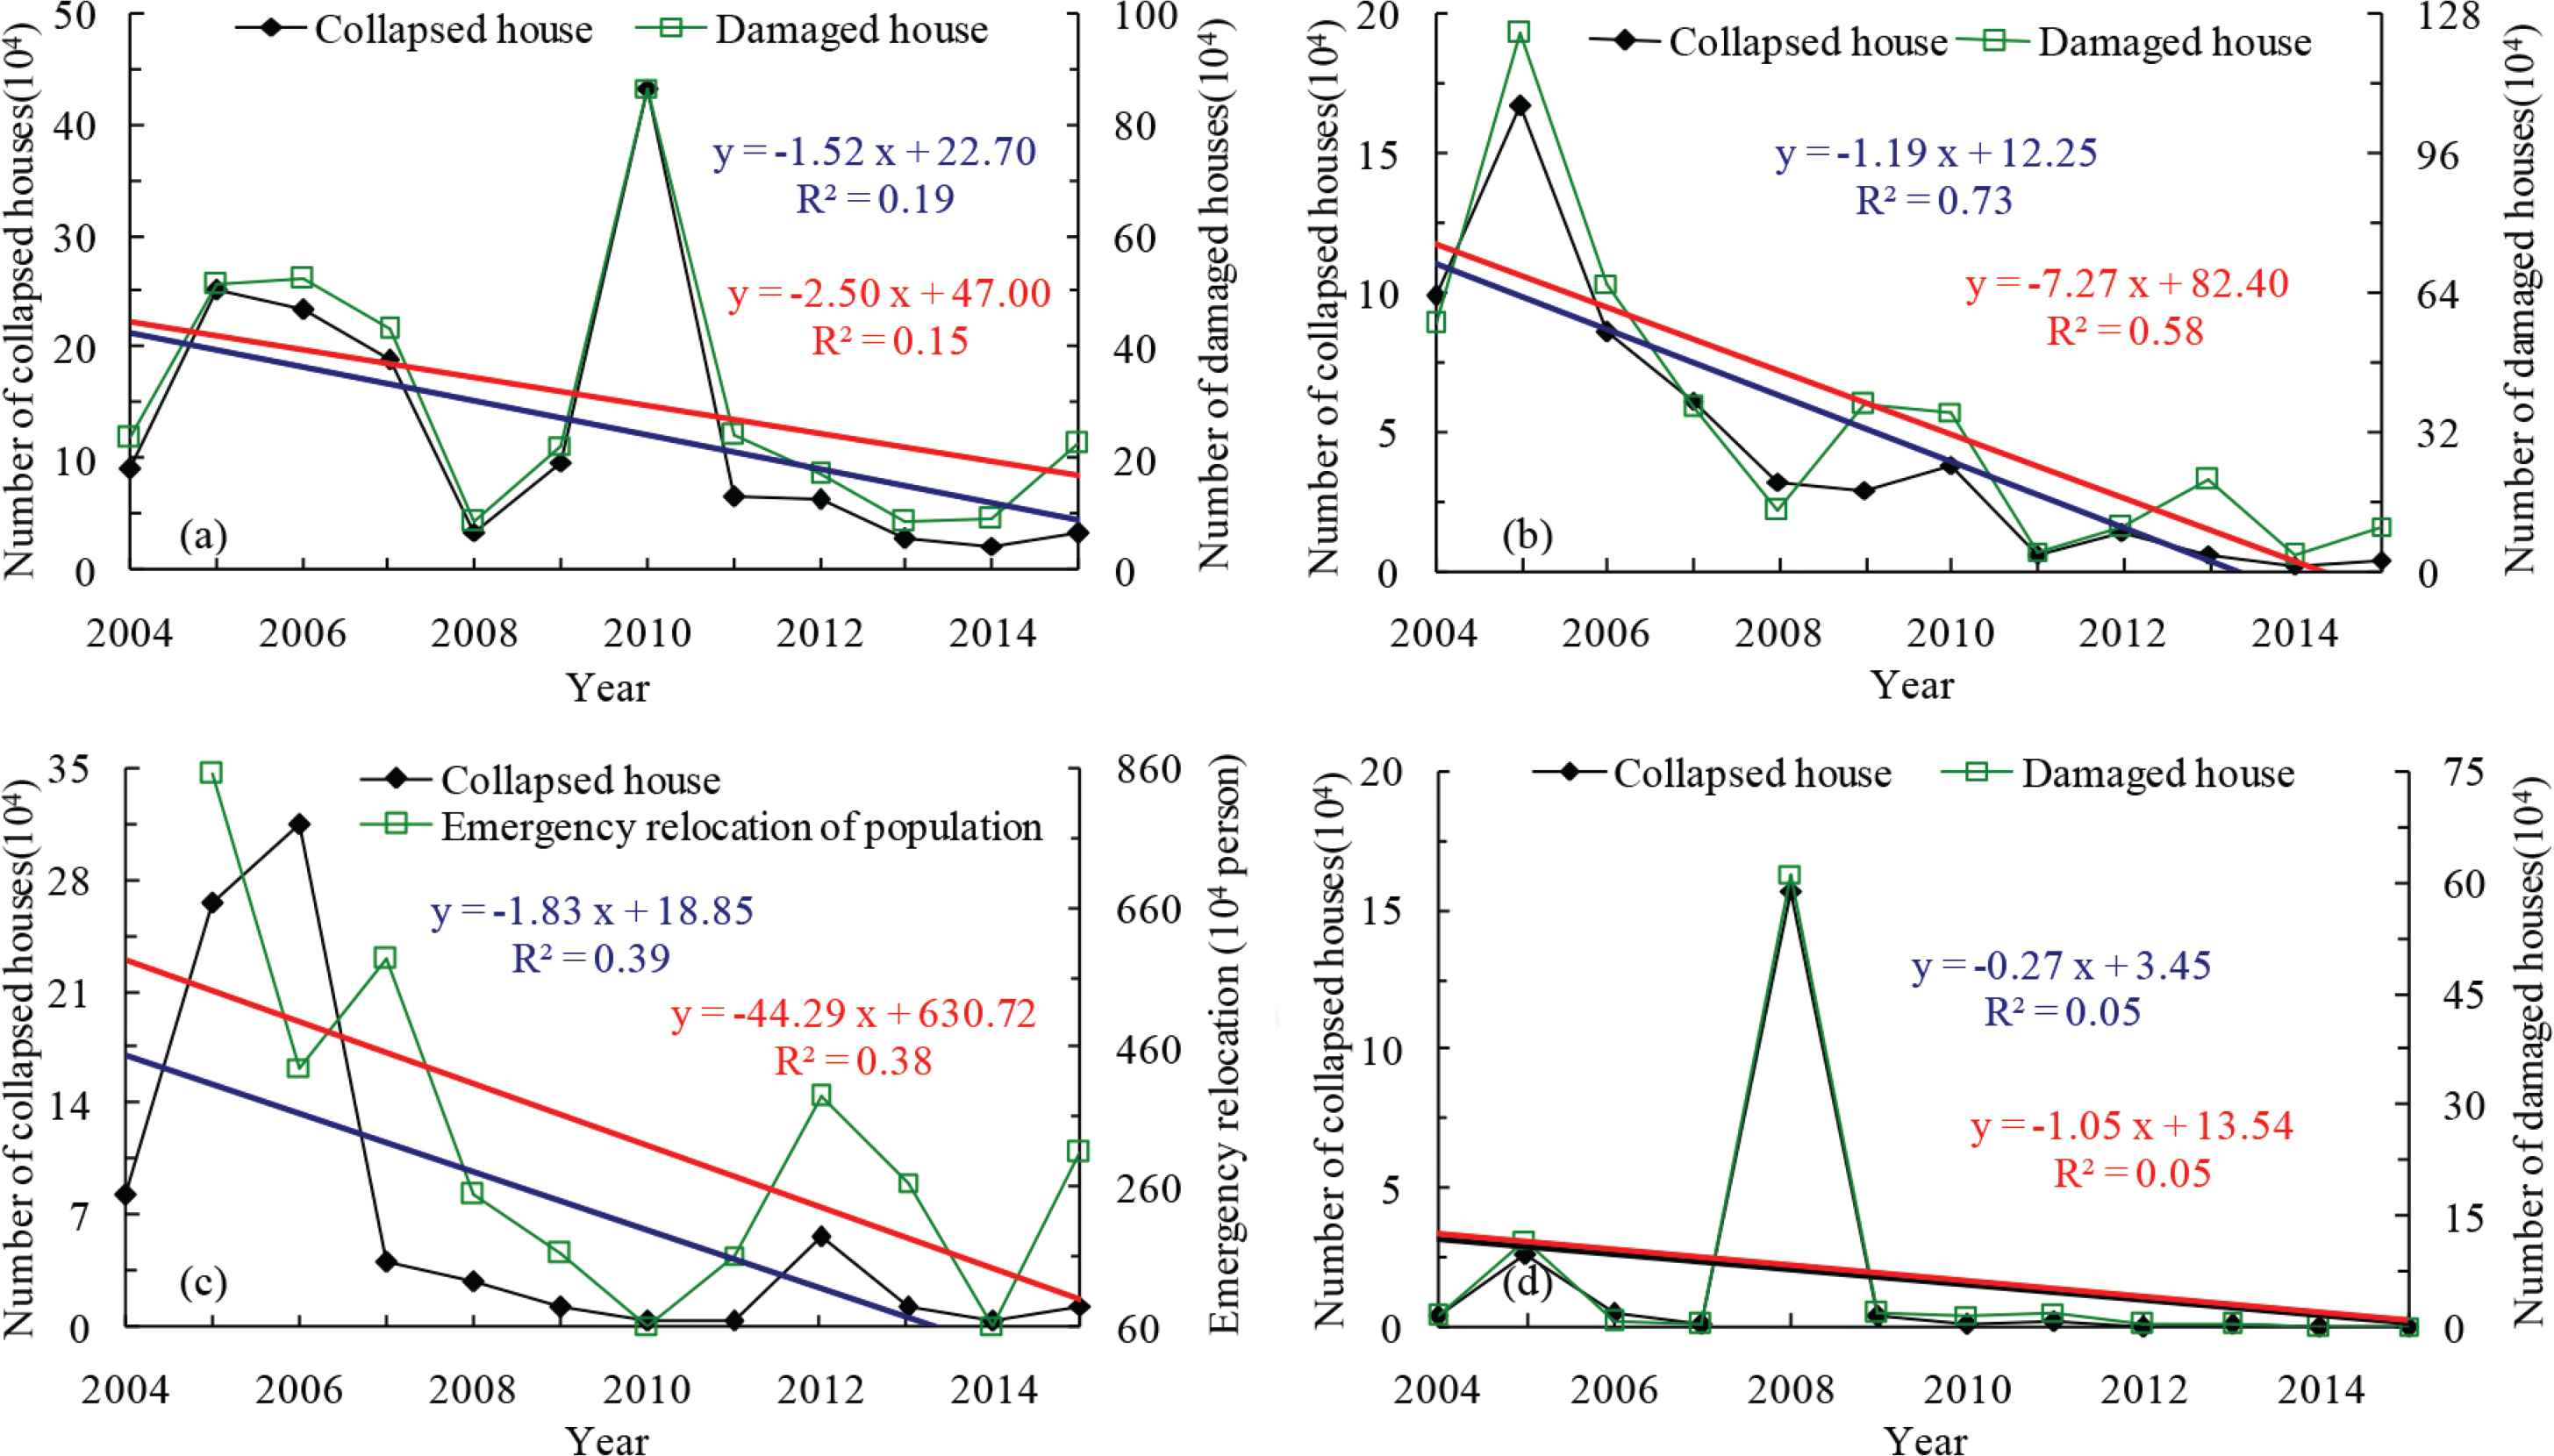
Trends in the houses collapsed and damaged caused by meteorological disasters in East China from 2004 to 2015. (a) Flood disaster, (b) strong convection weather disaster, (c) typhoon disaster, (d) low-temperature and snow disaster
3.5. The interannual variations in the direct economic loss
The direct economic loss caused by total meteorological disasters had showed no significant trend, with greater loss of 123.75 × 10⁹ Yuan in 2013 and less loss of 30.10 × 10⁹ Yuan in 2014 (Figure 4a). Direct economic loss from flood disaster had increased at a rate of 9.6 × 10⁹ Yuan per decade (Figure 4b), and it caused by drought disaster had increased at a rate of 4.8 × 10⁹ Yuan per year over the past 12 years (Figure 4c), though both trends were not statistically significant. The direct economic loss caused by strong convection weathers had decreased significantly at a rate of 4.3 × 10⁹ Yuan per decade (Figure 4d). Direct economic losses caused by typhoon and low-temperature and snow disasters were not statistically significant in East China (Figures 4e and 4f), with the most disastrous low-temperature and snow event occurred in 2008 (Figure 4f).
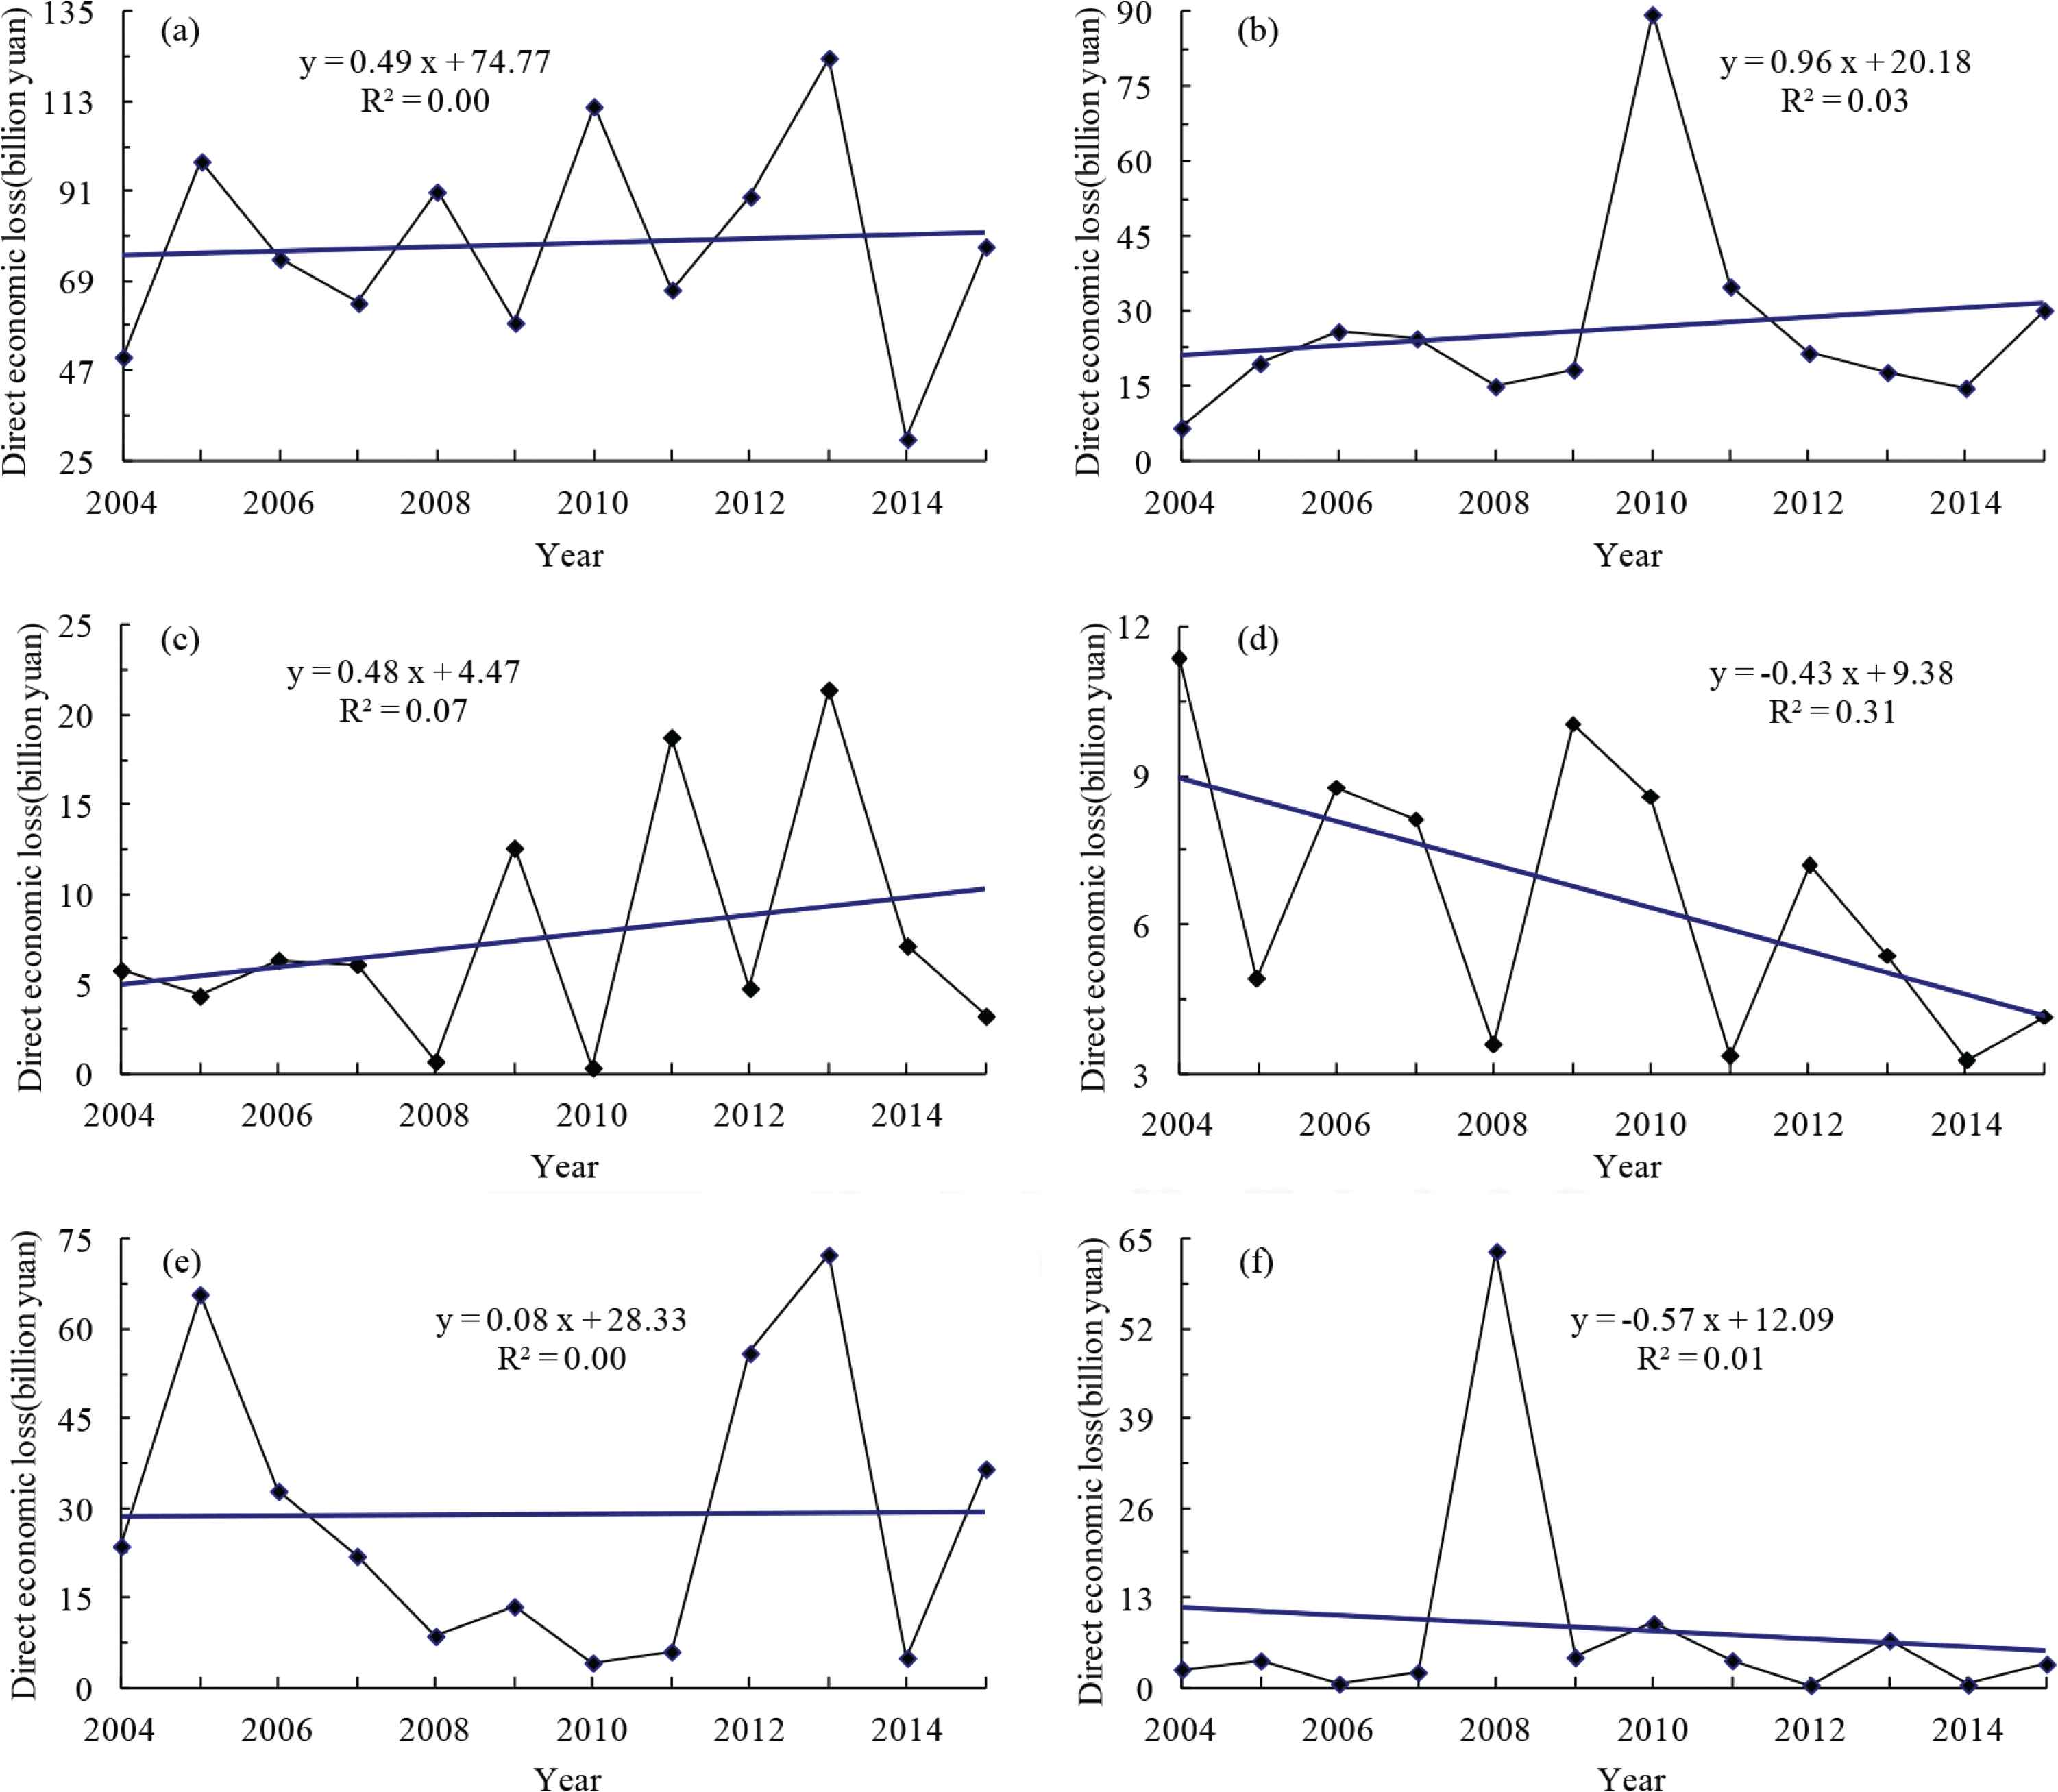
Trends in the direct economic loss caused by meteorological disasters in East China from 2004 to 2015 (a: total meteorological disasters; b: flood disaster; c: drought disaster; d: strong convection weather disaster; e: typhoon disaster; f: low-temperature and snow disaster)
3.6. The hazards of meteorological disasters in East China
According to the losses of meteorological disasters per unit area, the hazards of meteorological disasters were identified, and the results showed that the hazards of meteorological disasters had obvious regional differences in East China (Table 2). As far as crops were concerned, Anhui, Jiangxi, Shandong and Jiangsu were generally at high hazards of meteorological disasters, while Shanghai and Fujian were at low hazards. In terms of the death population, people in Shanghai, Zhejiang and Fujian were at high hazards of meteorological disasters, while people in Shandong had the lowest hazards. Comparing the direct economic loss per unit area, Zhejiang province had the highest hazards of meteorological disasters, followed by Fujian, Jiangxi, Anhui and Shandong, while Shanghai had the lowest hazards of meteorological disasters.
| Province/City | Area of crops (104 hm2/104 km2) | Number of people (person/104 km2) | Direct economic loss (109 Yuan/104 km2) | ||
|---|---|---|---|---|---|
| Affected area | Total failure area | Affected population | Death population | ||
| Shanghai | 3.24 | 0.14 | 371958 | 9.79 | 5.66 |
| Jiangsu | 9.37 | 0.59 | 949277 | 4.69 | 5.94 |
| Zhejiang | 6.53 | 0.52 | 1416699 | 7.26 | 22.52 |
| Anhui | 10.87 | 1.08 | 1545413 | 4.73 | 8.06 |
| Fujian | 3.35 | 0.25 | 537785 | 7.86 | 8.95 |
| Jiangxi | 7.19 | 0.81 | 1009326 | 4.96 | 8.47 |
| Shandong | 11.37 | 0.78 | 1195395 | 1.66 | 7.99 |
Annual losses per unit area caused by meteorological disasters in each province (municipality) of East China from 2004 to 2015
For different categories of meteorological disasters, the hazard level in different regions of East China also varied greatly. The flood disaster induced by rainstorms had higher affected area and total failure area of crops in Anhui, Shandong, Jiangxi and Jiangsu, and had higher direct economic loss in Jiangxi, Anhui, Fujian and Zhejiang, with more deaths in Fujian, Jiangxi, Shanghai and Zhejiang. Therefore, there were higher hazards of flood disaster in the southern part of East China, including Anhui, Jiangxi, Fujian and Zhejiang (Table 3).
| Province/City | Area of crops (104 hm2/104 km2) | Number of people (person/104 km2) | Number of houses (104/104 km2) | Direct economic loss (109 Yuan/104 km2) | |||
|---|---|---|---|---|---|---|---|
| Affected area | Total failure area | Affected population | Death population | Collapsed houses | Damaged houses | ||
| Shanghai | 0.52 | 0.08 | 25397 | 1.11 | 0.00 | 0.00 | 0.44 |
| Jiangsu | 3.43 | 0.39 | 282057 | 0.32 | 0.05 | 0.29 | 2.54 |
| Zhejiang | 1.29 | 0.12 | 235912 | 1.02 | 0.04 | 0.14 | 3.70 |
| Anhui | 5.61 | 0.92 | 626430 | 0.79 | 0.21 | 0.47 | 3.97 |
| Fujian | 1.13 | 0.13 | 160322 | 2.86 | 0.23 | 0.36 | 3.75 |
| Jiangxi | 3.89 | 0.43 | 489269 | 1.47 | 0.30 | 0.74 | 6.10 |
| Shandong | 4.41 | 0.43 | 405644 | 0.60 | 0.23 | 0.60 | 3.27 |
Annual losses per unit area caused by rainstorm-induced flood disaster in each province (municipality) of East China from 2004 to 2015
Drought disaster had higher affected area and total failure area of crops in Shandong, Anhui, Jiangxi and Jiangsu, and the affected population by drought disaster was also more in Anhui, Shandong, Jiangsu and Jiangxi, moreover, the direct economic loss caused by drought disaster was also higher in Shandong, Anhui and Jiangsu. So in the northern part of East China, including Shandong, Jiangsu and Anhui, the hazards of drought disaster were higher (Table 4).
| Province/City | Area of crops (104 hm2/104 km2) | Number of people (104 person/104 km2) | Direct economic loss (109 Yuan/104 km2) | ||
|---|---|---|---|---|---|
| Affected area | Total failure area | Affected population | Population with poor drinking water | ||
| Shanghai | 0.00 | 0.00 | 0.00 | 0.00 | 0.00 |
| Jiangsu | 3.11 | 0.12 | 28.82 | 0.48 | 1.03 |
| Zhejiang | 1.23 | 0.10 | 12.92 | 3.60 | 0.95 |
| Anhui | 3.62 | 0.19 | 61.30 | 2.43 | 1.71 |
| Fujian | 0.49 | 0.03 | 4.45 | 1.47 | 0.22 |
| Jiangxi | 2.17 | 0.19 | 24.67 | 3.31 | 0.92 |
| Shandong | 5.17 | 0.22 | 54.31 | 2.93 | 1.89 |
Annual losses per unit area caused by drought disaster in each province (municipality) of East China from 2004 to 2015
Like drought disaster, strong convection weather disaster also had higher affected area and total failure area of crops in Shandong, Jiangsu and Anhui, and the affected population and direct economic loss caused by strong convection weather disaster were also higher in Shandong, Jiangsu and Anhui. Hence the hazards of strong convection weather disaster were also higher in the northern part of East China (Table 5).
| Province/City | Area of crops (104 hm2/104 km2) | Number of people (person/104 km2) | Number of houses (104/104 km2) | Direct economic loss (109 Yuan/104 km2) | |||
|---|---|---|---|---|---|---|---|
| Affected area | Total failure area | Affected population | Death population | Collapsed houses | Damaged houses | ||
| Shanghai | 0.06 | 0.00 | 317 | 4.92 | 0.02 | 0.05 | 0.40 |
| Jiangsu | 1.33 | 0.12 | 283509 | 3.06 | 0.08 | 0.92 | 1.52 |
| Zhejiang | 0.17 | 0.00 | 44235 | 1.97 | 0.01 | 0.16 | 0.26 |
| Anhui | 0.97 | 0.06 | 237831 | 2.30 | 0.06 | 0.38 | 1.01 |
| Fujian | 0.16 | 0.01 | 25177 | 1.29 | 0.08 | 0.65 | 0.31 |
| Jiangxi | 0.61 | 0.06 | 162251 | 3.32 | 0.09 | 0.79 | 0.63 |
| Shandong | 1.91 | 0.16 | 289785 | 1.01 | 0.07 | 0.30 | 2.06 |
Annual losses per unit area caused by strong convection weathers in each province (municipality) of East China from 2004 to 2015
Typhoon disaster had higher affected area and total failure area of crops in Zhejiang, Shanghai, Fujian and Jiangsu, and the death population, collapsed and damaged houses and direct economic loss caused by typhoon disaster were also higher in Zhejiang, Fujian and Shanghai. So in the eastern coastal areas of East China, including Fujian, Zhejiang and Shanghai, the hazards of typhoon disaster were higher (Table 6).
| Province/City | Area of crops (104 hm2/104 km2) | Number of people (person/104 km2) | Number of houses (104/104 km2) | Direct economic loss (109 Yuan/104 km2) | ||||
|---|---|---|---|---|---|---|---|---|
| Affected area | Total failure area | Affected population | Death population | Relocation and resettlement population | Collapsed houses | Damaged houses | ||
| Shanghai | 2.87 | 0.09 | 420635 | 1.75 | 237619 | 0.25 | 0.05 | 5.70 |
| Jiangsu | 2.09 | 0.03 | 202076 | 0.22 | 8441 | 0.02 | 0.00 | 1.36 |
| Zhejiang | 4.13 | 0.26 | 999314 | 5.05 | 166912 | 0.23 | 0.27 | 20.17 |
| Anhui | 0.96 | 0.04 | 133164 | 0.81 | 9198 | 0.10 | 0.01 | 1.29 |
| Fujian | 1.76 | 0.06 | 348747 | 5.26 | 101443 | 0.23 | 0.10 | 5.93 |
| Jiangxi | 0.54 | 0.02 | 103844 | 0.48 | 7569 | 0.06 | 0.01 | 0.77 |
| Shandong | 0.77 | 0.05 | 81105 | 0.05 | 6723 | 0.03 | 0.00 | 1.33 |
Annual losses per unit area caused by typhoon disaster in each province (municipality) of East China from 2004 to 2015
Low-temperature and snow disasters had higher affected area and total failure area of crops in Anhui, Shandong, Jiangxi and Zhejiang, and the affected population was also higher in Zhejiang, Anhui, Jiangxi and Shandong. In addition, the direct economic loss caused by low-temperature and snow disasters was also higher in Zhejiang, Anhui, Jiangxi and Shandong. So the hazards of low-temperature and snow disasters were higher in Zhejiang, Anhui, Jiangxi and Shandong (Table 7).
| Province/City | Area of crops (104 hm2/104 km2) | Number of people (person/104 km2) | Number of houses (104/104 km2) | Direct economic loss (109 Yuan/104 km2) | |||
|---|---|---|---|---|---|---|---|
| Affected area | Total failure area | Affected population | Death population | Collapsed houses | Damaged houses | ||
| Shanghai | 0.41 | 0.00 | 0 | 0.32 | 0.00 | 0.00 | 0.25 |
| Jiangsu | 0.93 | 0.02 | 39405 | 0.13 | 0.01 | 0.02 | 0.58 |
| Zhejiang | 1.01 | 0.06 | 290912 | 0.27 | 0.00 | 0.02 | 2.06 |
| Anhui | 1.89 | 0.07 | 242105 | 0.09 | 0.07 | 0.15 | 1.69 |
| Fujian | 0.47 | 0.06 | 67164 | 0.00 | 0.02 | 0.26 | 0.52 |
| Jiangxi | 1.39 | 0.25 | 196934 | 0.06 | 0.04 | 0.14 | 1.73 |
| Shandong | 1.22 | 0.06 | 103166 | 0.06 | 0.00 | 0.01 | 0.97 |
Annual losses per unit area caused by low-temperature and snow disasters in each province (municipality) of East China during 2004–2015
4. DISCUSSION
Extreme weather conditions, such as extreme heat, excessive rainfall and strong winds, often have negative effects on the earth’s atmosphere, resulting in casualties or property losses. These disasters are called meteorological disasters. In East China, flood disaster (including landslide and mud-rock flow) induced by rainstorms had brought the largest affected area and total failure area of crops, and the largest number of affected population and collapsed houses, and strong convection weathers (including gale, hail, thunder and lightning) resulted in the largest number of deaths and typhoons had the greatest direct economic losses during 2004–2015 (Table 1). Our results are basically consistent with existing research results. For example, Guan et al. [3] showed that flood was the major disasters type that contributing to the most losses in most regions of China. Liu et al. [24] analyzed the spatiotemporal frequencies of six meteorological disasters (flood, storm, drought, typhoon, low-temperature and snow) in China during 2011–2015, and results indicated that flood and storm disasters were meteorological disasters with high frequency and large number of deaths, while flood and typhoon disasters caused the greater economic losses. Wu et al. [12] showed that floods, storms, droughts and precipitation-induced secondary geological disasters were the major cause for loss of life and economic damage in China during 1949–2013, and this effect were on the rise. Zhao et al. [25] analyzed the distribution characteristics of the comprehensive losses for various meteorological disasters in China during 2004–2013 and the results showed rainstorm flood and drought were the main meteorological disasters that affect China, The number of deaths and direct economic losses caused by rainstorm and flood were the highest, and the area of crop and number of population affected by drought were the uppermost.
The statistical analysis of the trend of meteorological disasters can provide important reference for disaster prevention, disaster mitigation planning, risk management and climate change adaptation [12]. In East China, there were significant decreasing trends in the affected area and the total failure area of crops, and the number of people affected and deaths by meteorological disasters had also decreased significantly (Figures 1 and 2). Chen and Gao [26] analyzed the losses caused by meteorological disasters in China during 1989–2008 and indicated that the number of deaths caused by meteorological disasters showed a significant decline in the past 20 years. Zhao et al. [25] showed that except the direct economic losses, the numbers of deaths and population affected by meteorological disasters, the area of crop failures and the percentage of direct economic losses to the gross domestic product all decrease from 2004 to 2013. Guan et al. [3] analyzed the temporal trends of affected area resulting from meteorological disasters in China during 1951–2013, and showed that the affected area of flood, drought and low temperature and frost showed a significant upward trend during 1951–2013, while that of hail showed a significant downward trend. Different time periods selected for analysis may cause great differences in research results. In the first 10 years from 1989 to 2008, the death population was dominant in the comprehensive losses caused by meteorological disasters in China, while the direct economic losses were dominant in the second 10 years [26].
An analysis of meteorological disaster data in China during 1949–2013 revealed that the overall economic losses amounted to 12 trillion Yuan, and the absolute direct economic loss showed a uptrend, with annual mean direct economic loss increasing from less than 100 billion Yuan in the 1950s to more than 300 billion Yuan since the 21st century, while economic losses expressed as a proportion of gross domestic product had a downward trend, and direct economic loss rate amounted to over 15% in the 1950s and then dropped to around 1% since the 21st century [12]. Chen and Gao [26] showed that the direct economic losses in China during 1989–2008 generally showed an upward trend in the first 10 years, while in the second 10 years, direct economic losses were relatively stable in the first half and showed an upward trend in the second half. Shi and Ying [27] also suggested that the annual average direct economic loss had shown an upward trend in China, from about 100 billion Yuan in the 1950–1970s to over 250 billion Yuan during the period from 1990s to early 2000s, and then to over 450 billion Yuan in 2013. However, the direct economic loss caused by meteorological disasters showed no significant trend in East China during 2004–2015 (Figure 4).
The intensity, frequency and exposure of meteorological disasters brought about by global warming and urbanization have made the hazards of meteorological disasters more complicated and become an urgent task and priority for all countries to cope with climate change [12]. In the northern part of East China, including Shandong, Jiangsu and Anhui, the hazards of drought and strong convection weathers were higher, but in the southern part of East China, including Anhui, Jiangxi, Fujian and Zhejiang, there were higher hazards of flood disaster (Tables 3–5). Liu et al. [24] showed that during 2011–2015, drought disaster mainly occurred in central and northern China, while flood disaster mainly concentrated in the southern part of the northern China and the Yangtze River basin. Meanwhile, strong wind and hail disasters occurred mainly in the northern China, northwestern China and southwestern China. Xie et al. [28] showed that the distribution characteristics were very different about different disasters in China, namely, Anhui, Shandong, Jiangsu, Henan, Jiangxi, Hubei, Hunan, Guangxi, Sichuan and Heilongjiang were seriously affected by rainstorm induced flood during 2004–2010. Zhao et al. [25] also showed the influence of rainstorm and flood was more serious in the Yangtze River Basin, and local strong convective disaster mostly affected North China and Huanghe and Huaihe river areas.
In the eastern coastal areas of East China, including Fujian, Zhejiang and Shanghai, the hazards of typhoons were higher, and the hazards of low-temperature and snow disasters were higher in Zhejiang, Anhui, Jiangxi and Shandong (Tables 6 and 7). Xie et al. [28] showed that Guangdong, Fujian, Zhejiang, Shanghai, Jiangsu and Shandong were mainly affected by tropical storms in China according to the analysis of data from 2004 to 2010. Liu et al. [24] also showed that regions most affected by the typhoon disaster were the southeast coastal areas of China, followed by the southern and eastern parts of the Shandong peninsula, and the disaster of low temperature and snow mainly happened in northern China, northeastern China and northwestern China. For low-temperature and snow disasters, Liu and Yan [2] showed that low temperature disaster in spring and autumn mainly occurred in the regions south of the Yangtze River and southern China. Guan et al. [3] also showed that there were more frequent low temperature, frost and snowstorms in northern China, northwestern China and individual areas in southern China. Zhao et al. [25] also showed that the frequency of typhoon was the highest in the southeast coastal areas of China, and the Yangtze River Basin often suffered the low temperature and freezing disasters.
5. CONCLUSION
In East China, flood disaster (including landslide and mud-rock flow) induced by rainstorms was the most important meteorological disaster, which caused the largest affected area and total failure area of crops, and had the largest number of affected population and collapsed houses. Strong convection weathers (including gale, hail, thunder and lightning) resulted in the largest number of deaths and typhoons had the greatest direct economic losses in East China during 2004–2015. Drought and low-temperature and snow disasters also have great influence on the population and social economy of East China. Over the past 12 years, there were decreasing trends in the affected area and the total failure area of crops. Meanwhile, the number of people affected and deaths by meteorological disasters had also decreased, but the direct economic loss caused by meteorological disasters showed no significant trend.
The hazards of meteorological disaster had obvious regional differences in East China. Crops in Anhui, Jiangxi, Shandong and Jiangsu were at higher hazards of meteorological disasters, and people in Shanghai, Zhejiang and Fujian were at higher hazards according to the loss of meteorological disaster per unit area. For different types of meteorological disasters, the hazard level in different regions of East China was also greatly different. In the northern part of East China, the hazards of drought and severe convection weathers were higher, but in the southern part of East China, there were higher hazards of flood disaster. In the eastern coastal areas of East China, the hazards of typhoon disaster were higher, and the hazards of low-temperature and snow disasters were higher in Zhejiang, Anhui, Jiangxi and Shandong.
CONFLICTS OF INTEREST
The authors declare they have no conflicts of interest.
ACKNOWLEDGMENTS
The authors give thanks for funding provided by the
REFERENCES
Cite this article
TY  - JOUR
AU  - Jun Shi
AU  - Linli Cui
AU  - Zhongping Shen
PY  - 2020
DA  - 2020/01/30
TI  - Interannual Variation and Hazard Analysis of Meteorological Disasters in East China
JO  - Journal of Risk Analysis and Crisis Response
SP  - 168
EP  - 176
VL  - 9
IS  - 4
SN  - 2210-8505
UR  - https://doi.org/10.2991/jracr.k.200117.004
DO  - 10.2991/jracr.k.200117.004
ID  - Shi2020
ER  -