
Impact of Population Emigration from Wuhan and Medical Support on COVID-19 Infection in China
 , Yao Tian†, Jing Zhou†, Xin Diao, Ligai Di, Shengyu Wang*
These three authors contributed equally to this work.
- DOI
- 10.2991/jegh.k.201121.001How to use a DOI?
- Keywords
- COVID-19; Wuhan emigration; developmental trend; medical support; cure rate
- Abstract
Background: The novel Coronavirus Disease 2019 (COVID-19) infection broken out in Wuhan. We aimed to analyse the impact of medical support and population emigration from Wuhan on the cure rate and mortality of COVID-19 infection in China and to provide early warning on the developmental trend of the epidemic.
Methods: Data were obtained from The National Health Commission of People’s Republic of China, Chinese Center for Disease Control and Prevention and The National Health Commission of People’s Republic of Hubei Province. The Poisson distribution and normal approximate were used to analyse the relationship between population emigration from Wuhan and the probability of outbreaks and to predict the developmental trend of the epidemic situation.
Results: The outbreak were related to population emigration from Wuhan in 87% of the cities in Hubei. The result of developmental trend indicated that 95% confidence intervals of confirmed case in Xiaogan and HuangGang were 3301.678–3526.042 and 3201.189–3422.17, respectively. For province outside of Hubei, the outbreak in 76% of the provinces were related to population emigration from Wuhan. Hot spot provinces for epidemic prevention included GuangDong and HeNan. Medical support significantly improved the cure rate of patients with COVID-19 (r = 0.852, p < 0.001).
Conclusion: Population emigration from Wuhan has a certain impact on the probability of outbreaks COVID-19 in Hubei and the whole country, medical support improved the cure rate of patients with COVID-19.
- Copyright
- © 2020 The Authors. Published by Atlantis Press International B.V.
- Open Access
- This is an open access article distributed under the CC BY-NC 4.0 license (http://creativecommons.org/licenses/by-nc/4.0/).
1. INTRODUCTION
In early December 2019, a new type of coronavirus named severe acute respiratory syndrome-coronavirus-2 (SARS-CoV-2) was found to cause cases of viral pneumonia in Wuhan [1,2]. By March 8, 2020, 80,955 laboratory-confirmed cases and 3162 deaths had been documented in China. Fortunately, the epidemic in China has been effectively controlled. However, Coronavirus Disease 2019 (COVID-19) is currently prevalent worldwide and has not been effectively controlled. Therefore, the effective measures taken by China in this epidemic have certain guiding value. The aim of this study was to analyse the impact of population emigration from Wuhan and medical support on COVID-19 infection in China and explore the effectiveness of the corresponding measures.
Since the outbreak of COVID-19, the Chinese government has taken a series of measures to prevent the epidemic from further exacerbation. The Wuhan government officially announced that public transport, subway, ferry, and long-distance passenger transport operations have been suspended, the airport and railway station from the Han channel have also been temporarily closed since 10:00 hours on January 23, 2020. However, before that time, a considerable number of people from Wuhan had migrated to other cities [3,4]. Evidence has pointed to person-to-person transmission [5–7]. Therefore, we aimed to study the impact of Wuhan population migration on COVID-19 infection in China. In addition, the response of medical support in this epidemic situation was swift, and 42,000 medical staff have supported Wuhan to date. Therefore, the relationship between medical support and cure rate is also worthy of attention.
2. MATERIALS AND METHODS
2.1. Date Collection
Date from January 11 to March 8, 2020 were obtained. Confirmed cases, deaths, severe cases and cure rates of patients with COVID-19 infection were obtained from The National Health Commission of People’s Republic (http://www.nhc.gov.cn/xcs/yqfkdt/gzbd_index.shtml), China Chinese Center for Disease Control and Prevention (http://2019ncov.chinacdc.cn/nCoV/) and The Health Commission of Hubei Province (http://www.hubei.gov.cn/fbjd/dtyw/). Date regarding Wuhan population mobility were obtained from the Baidu migration map (http://qianxi.baidu.com/). The amount of medical support was assessed using data from the Press Conference of the joint prevention and Control Mechanism of the State council (https://news.youth.cn/jsxw/202002/t20200207_12188577.htm). Two researchers independently reviewed the data.
2.2. Grouping
According to the time of “Closing Wuhan” on January 23, 2020, and medical support at January 24, 2020, we used January 24 as the point at which to divide the period into two time intervals: January 11–24, and January 25–March 8.
2.3. Date Model
2.3.1. Poisson distribution
Poisson distribution is a kind of distribution that describes the occurrence regularity of small probability events. It can be used to study the distribution of the number of rare events per unit time (or unit space, volume). The outbreak or aggregation of infectious diseases is considered a rare event in unit time (space) [8]. The statistical data were assumed to follow a Poisson distribution, as follows:
P(X) can be obtained by the above formula. e ≈ 2.7182, which is a constant. The P(X) of each province in China is the same as that of the city in Hubei Province.
2.4. Normal Approximate
When μ is large, x − n (μ, μ). Therefore, when x is large (x > 50), the confidence interval of μ can be estimated by a normal approximation. Then, we use the normal approximation method to estimate the 95% confidence interval of the total number of confirmed cases in a certain city of Hubei.
μa/2 = 1.96 is a constant, and X is the average number of confirmed cases caused by 1% of population emigration from Wuhan in a certain city of Hubei. To calculate X, the first step is to calculate the average number of confirmed cases caused by 1% of population emigration from Wuhan in Hubei province. We define it as E.
The 95% confidence interval of the total number of confirmed cases in a certain area of Hubei can be obtained from normal approximate formula. The 95% confidence interval of the total number of confirmed cases in a certain province is the same as that of a city in Hubei Province
2.5. Statistical Analysis
The data were analysed using SPSS software 18.0 (SPSS Inc., Chicago, IL, USA). The Pearson correlation coefficient was used to evaluate the degree of linear relationship between two variables. Categorical variables are expressed as numbers (%) and means (minimum − maximum), and p < 0.05 was considered statistically significant.
3. RESULTS
3.1. Current Situation of COVID-19 Infection in China
Hubei was the worst-hit region for COVID-19 infection followed by Guangzhou, Henan, Zhejiang, Hunan and Anhui. From January 11 to March 8, 2020, there were 67,773 confirmed cases, 49,062 cures and 3046 deaths in Hubei. While 10910 confirmed cases, 1774 cured cases and 42 deaths out of Hubei Province. Figure 1 shows that the provinces with high confirmed cases are adjacent to Hubei.
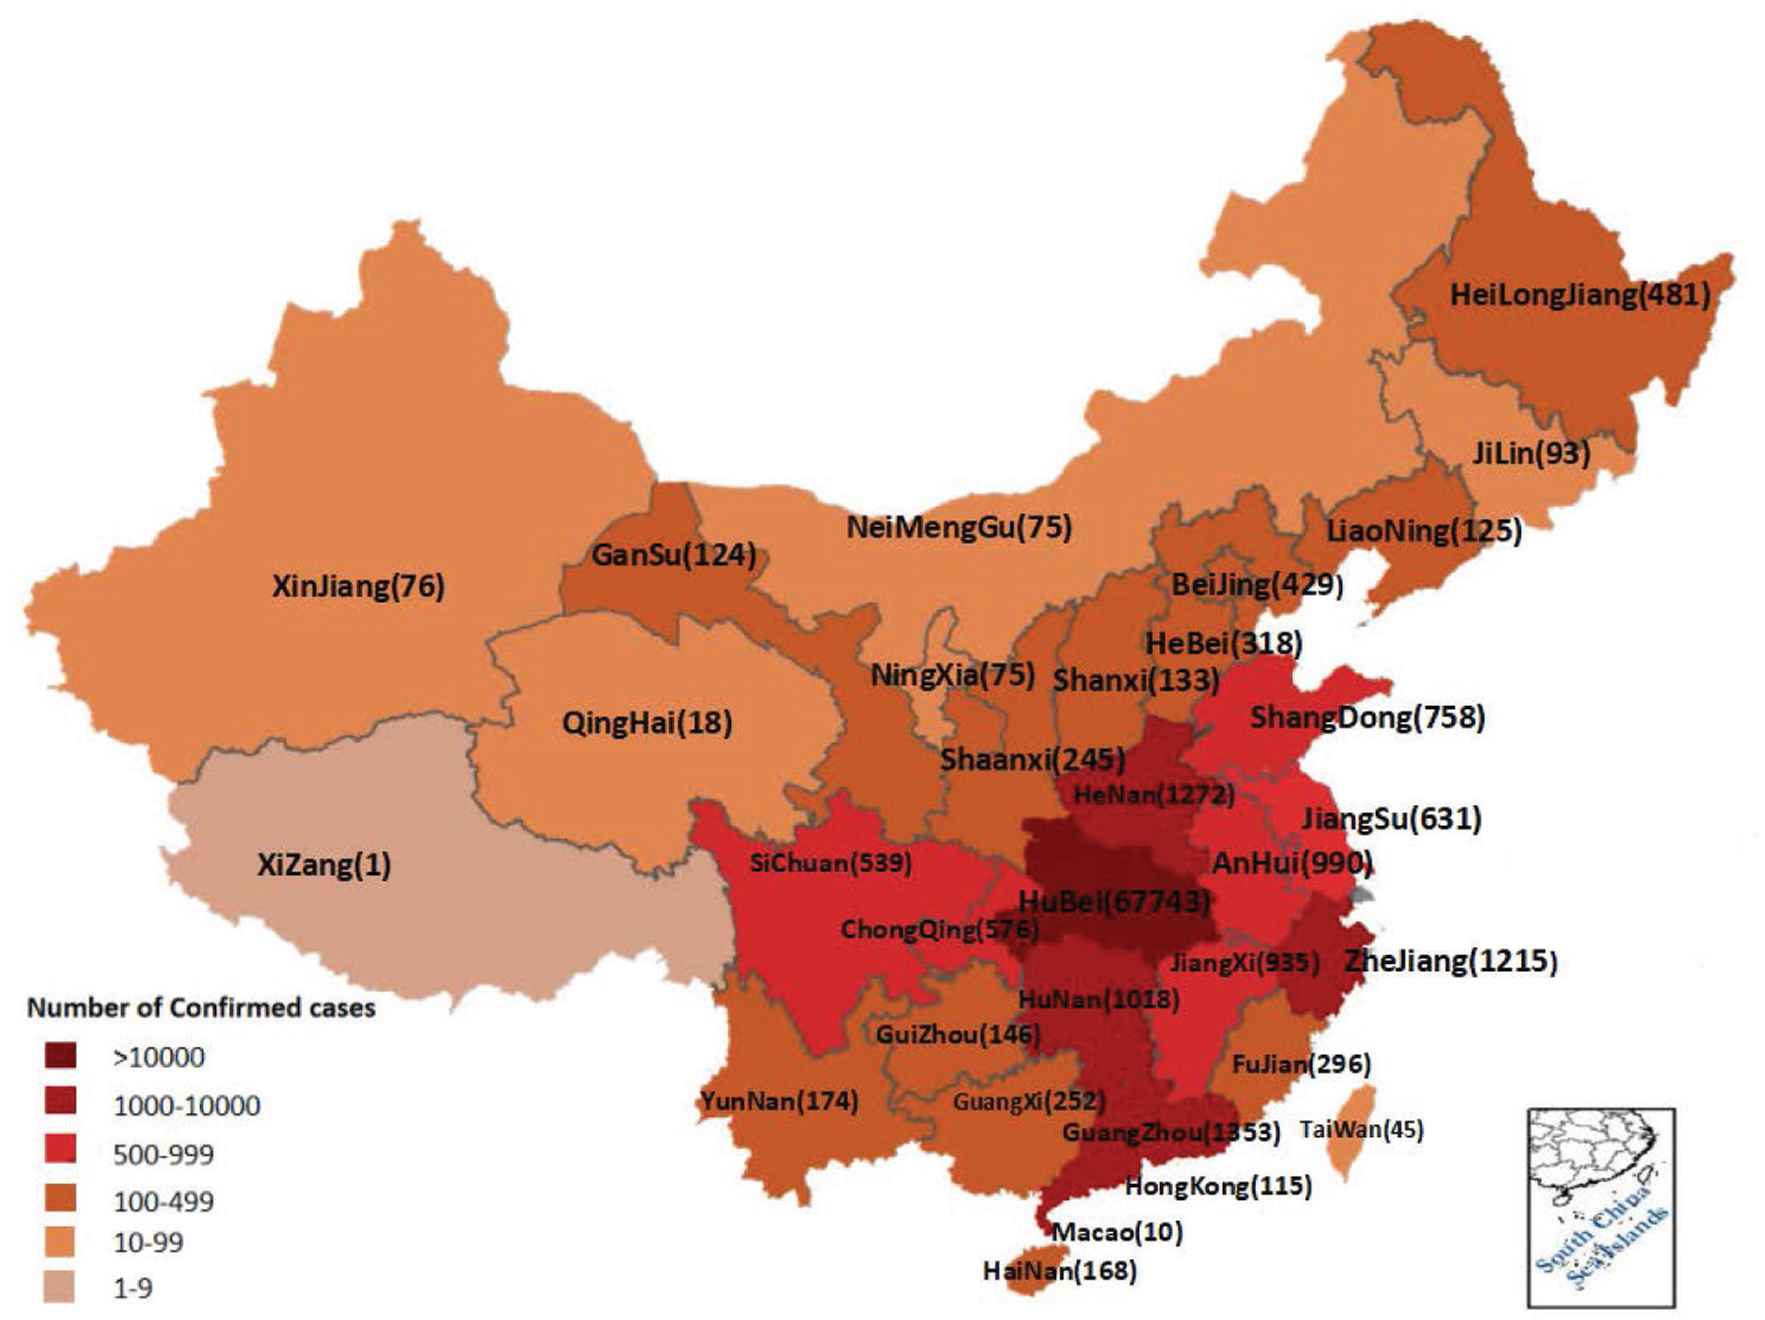
Confirmed cases in China.
The cure rate and death rate were 68.5% and 4.4% in Hubei Province, and 93.6% and 0.86% outside of Hubei Province, respectively (Table 1). The number of confirmed cases increased rapidly from January 22 to February 13. In particular, on February 12, 15,152 new confirmed cases were found, including 13,332 clinical cases in Hubei Province. Since February 14, the growth trend has slowed down, and the number of confirmed cases has been basically stable since February 27. At the same time, the number of cured cases increased significantly. However, the number of deaths was relatively few. The first mortality occurred on January 11 in Wuhan (Figure 2 and Table 2).
| In Hubei | Out of Hubei | |
|---|---|---|
| Confirmed (n) | 67,743 | 12,992 |
| Cure (n) | 46,433 | 12,167 |
| Cure ratio (%) | 68.5 | 93.6 |
| Death (n) | 3007 | 112 |
| Death ratio (%) | 4.4 | 0.86 |
The date of COVID-19 infection from January 11 to March 8, 2020 in Hubei and out of Hubei
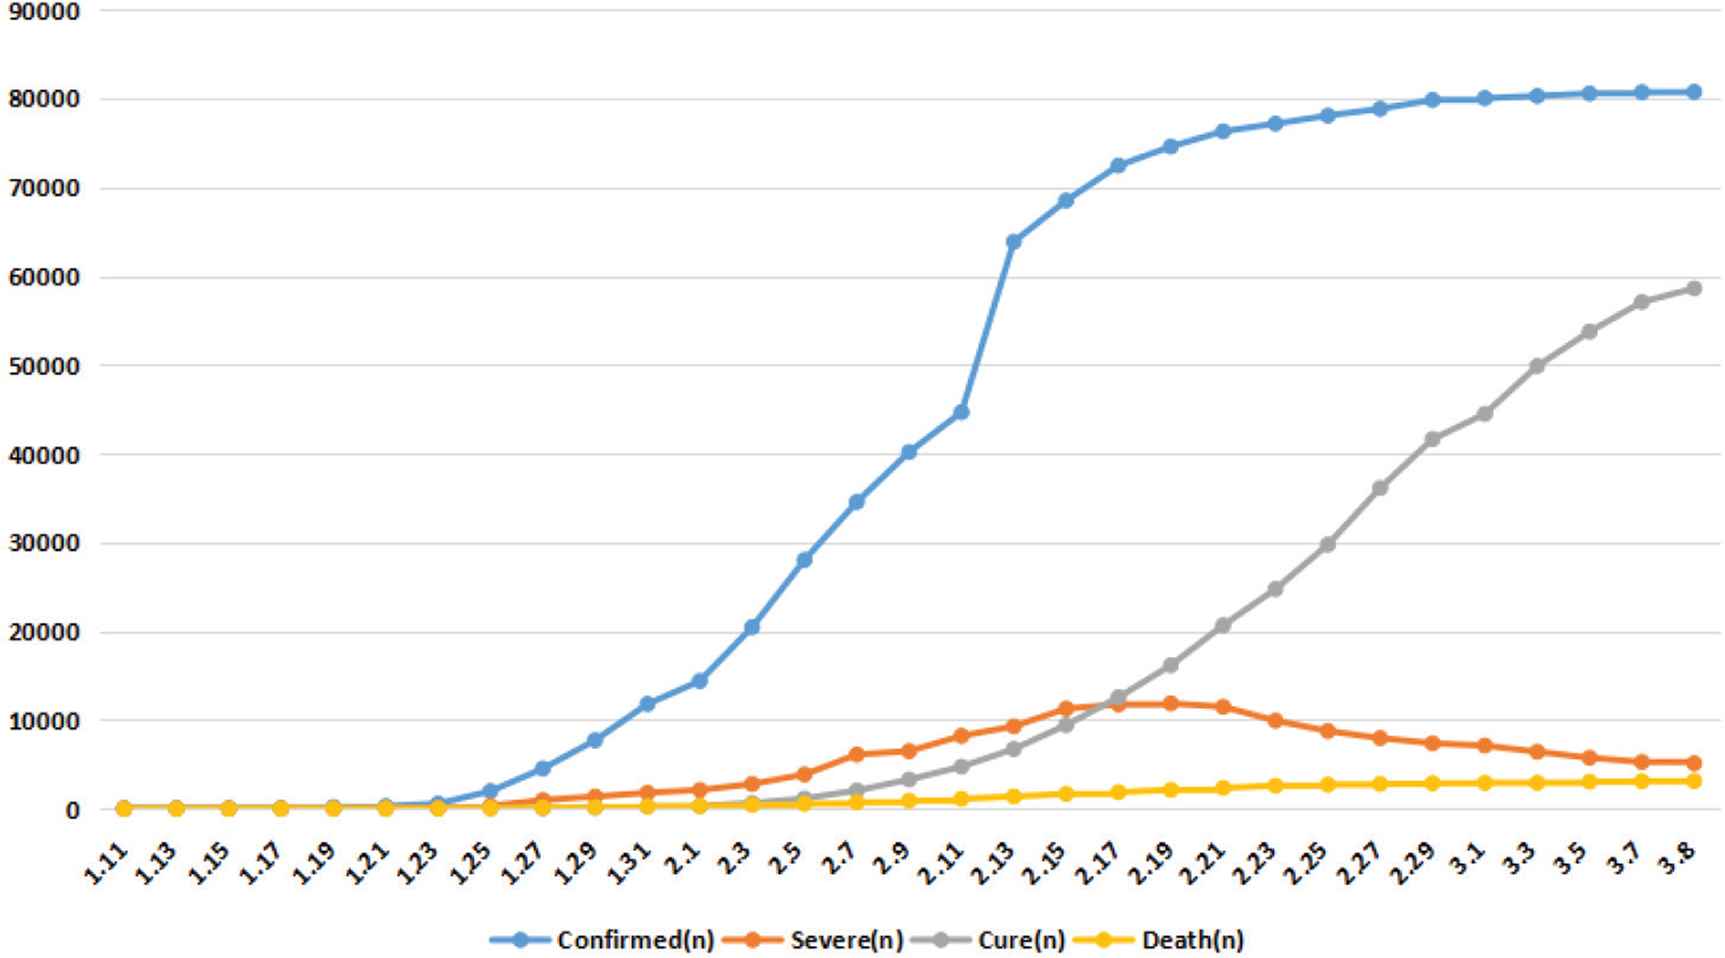
The number of confirmed, severe, death and cured cases of COVID-19 in China from January 11 to March 10, 2020. Since February 14, the growth trend has slowed, and the number of confirmed cases has remained basically stable from February 27. At the same time, the number of cured cases increased significantly.
| Date | Confirmed (n) | Severe (n) | Cure (n) | Death (n) | Cure (n) |
|---|---|---|---|---|---|
| 1.11 | 41 | 7 | 2 | 1 | 2 |
| 1.13 | 41 | 6 | 6 | 1 | 6 |
| 1.15 | 41 | 6 | 7 | 1 | 7 |
| 1.17 | 45 | 5 | 15 | 2 | 15 |
| 1.19 | 198 | 35 | 25 | 3 | 25 |
| 1.21 | 291 | 78 | 25 | 6 | 25 |
| 1.23 | 571 | 95 | 34 | 17 | 34 |
| 1.25 | 1975 | 324 | 49 | 56 | 49 |
| 1.27 | 4515 | 976 | 60 | 106 | 60 |
| 1.29 | 7711 | 1370 | 124 | 170 | 124 |
| 1.31 | 11,791 | 1795 | 243 | 259 | 243 |
| 2.1 | 14,380 | 2110 | 328 | 304 | 328 |
| 2.3 | 20,438 | 2788 | 632 | 425 | 632 |
| 2.5 | 28,018 | 3859 | 1153 | 563 | 1153 |
| 2.7 | 34,546 | 6101 | 2050 | 722 | 2050 |
| 2.9 | 40,171 | 6484 | 3281 | 908 | 3281 |
| 2.11 | 44,653 | 8204 | 4740 | 1113 | 4740 |
| 2.13 | 63,859 | 9278 | 6723 | 1380 | 6723 |
| 2.15 | 68,500 | 11,272 | 9419 | 1665 | 9419 |
| 2.17 | 72,436 | 11,742 | 12,552 | 1868 | 12,552 |
| 2.19 | 74,576 | 11,864 | 16,155 | 2118 | 16,155 |
| 2.21 | 76,288 | 11,477 | 20,659 | 2345 | 20,659 |
| 2.23 | 77,150 | 9915 | 24,734 | 2592 | 24,734 |
| 2.25 | 78,064 | 8752 | 29,745 | 2715 | 29,745 |
| 2.27 | 78,824 | 7952 | 36,117 | 2788 | 36,117 |
| 2.29 | 79,824 | 7365 | 41,625 | 2870 | 41,625 |
| 3.1 | 80,026 | 7110 | 44,462 | 2912 | 44,462 |
| 3.3 | 80,270 | 6416 | 49,856 | 2918 | 49,856 |
| 3.5 | 80,552 | 5737 | 53,726 | 3042 | 53,726 |
| 3.7 | 80,695 | 5264 | 57,065 | 3097 | 57,065 |
| 3.8 | 80,735 | 5111 | 58,600 | 3119 | 58,600 |
The number of confirmed, severe, death and cure cases of COVID-19 infect in China from January 11 to March 8, 2020
3.2. Relationship between Population Emigration from Wuhan and the Probability of Outbreaks in Hubei and the Developmental Trend
As shown in Table 3, for cities in Hubei, Xiaogan and HuangGang were the two cities with the largest population emigration from Wuhan, with emigration rate of 13.03% and 12.64%, respectively. The number of confirmed cases in these two cities was second only to Wuhan in Hubei Province. QianJiang had the lowest emigration rate and the lowest number of confirmed cases in Hubei Province. The relationship between population emigration and outbreak probability in Hubei Province was calculated bases on Poisson distribution. As indicated in Figure 3, in 13 of the 15 cities in Hubei Province, more than 50% of the outbreak probability is related to the population emigration from Wuhan. The detailed outbreak probability is shown in Table 3. The outbreak were related to population emigration from Wuhan in 87% of the cities in Hubei. We also predicted the development trend of the epidemic situation in Hubei. As depicted in Figure 4 and Table 3, Xiaogan and HuangGang appeared to be the worst hit areas in Hubei Province. The 95% confidence intervals of the confirmed case were 3301.678–3526.042 and 3201.189–3422.17, respectively.
| City in Hubei | Emigration ratio from Wuhan (%) | Confirmed number (n) | Probability of outbreak (%) | 95% confidence interval of confirm case | |
|---|---|---|---|---|---|
| Lower | Upper | ||||
| XiaoGan | 13.03 | 3518 | 52.648 | 3301.678 | 3526.042 |
| HuangGang | 12.64 | 2907 | 77.2611 | 3201.189 | 3422.171 |
| JingZhou | 6.34 | 1580 | 60.1613 | 1582.828 | 1739.332 |
| XiangNing | 5.04 | 836 | 89.5713 | 1250.71 | 1390.25 |
| EZhou | 4.1 | 1394 | 38.6337 | 1011.272 | 1137.128 |
| XiangYang | 3.87 | 1019 | 65.0618 | 952.8025 | 1075.077 |
| HuangShi | 3.74 | 1015 | 65.3595 | 919.7782 | 1039.982 |
| JinMen | 3.07 | 928 | 52.7769 | 749.8871 | 858.7929 |
| SuiZhou | 2.99 | 1307 | 26.6793 | 729.6413 | 837.1187 |
| XianTao | 2.86 | 575 | 82.0497 | 696.7625 | 801.8775 |
| YiChang | 2.79 | 931 | 52.5316 | 679.0696 | 782.8904 |
| TianMen | 2.02 | 496 | 70.5688 | 485.07 | 573.41 |
| EnShi | 1.86 | 252 | 92.6621 | 444.9354 | 529.7046 |
| ShiYan | 1.79 | 672 | 52.7424 | 427.4006 | 510.5594 |
| QianJiang | 1.12 | 198 | 82.4671 | 260.5502 | 326.3298 |
The probability of epidemic outbreak and 95% confidence interval of confirmed cases in cities of Hubei
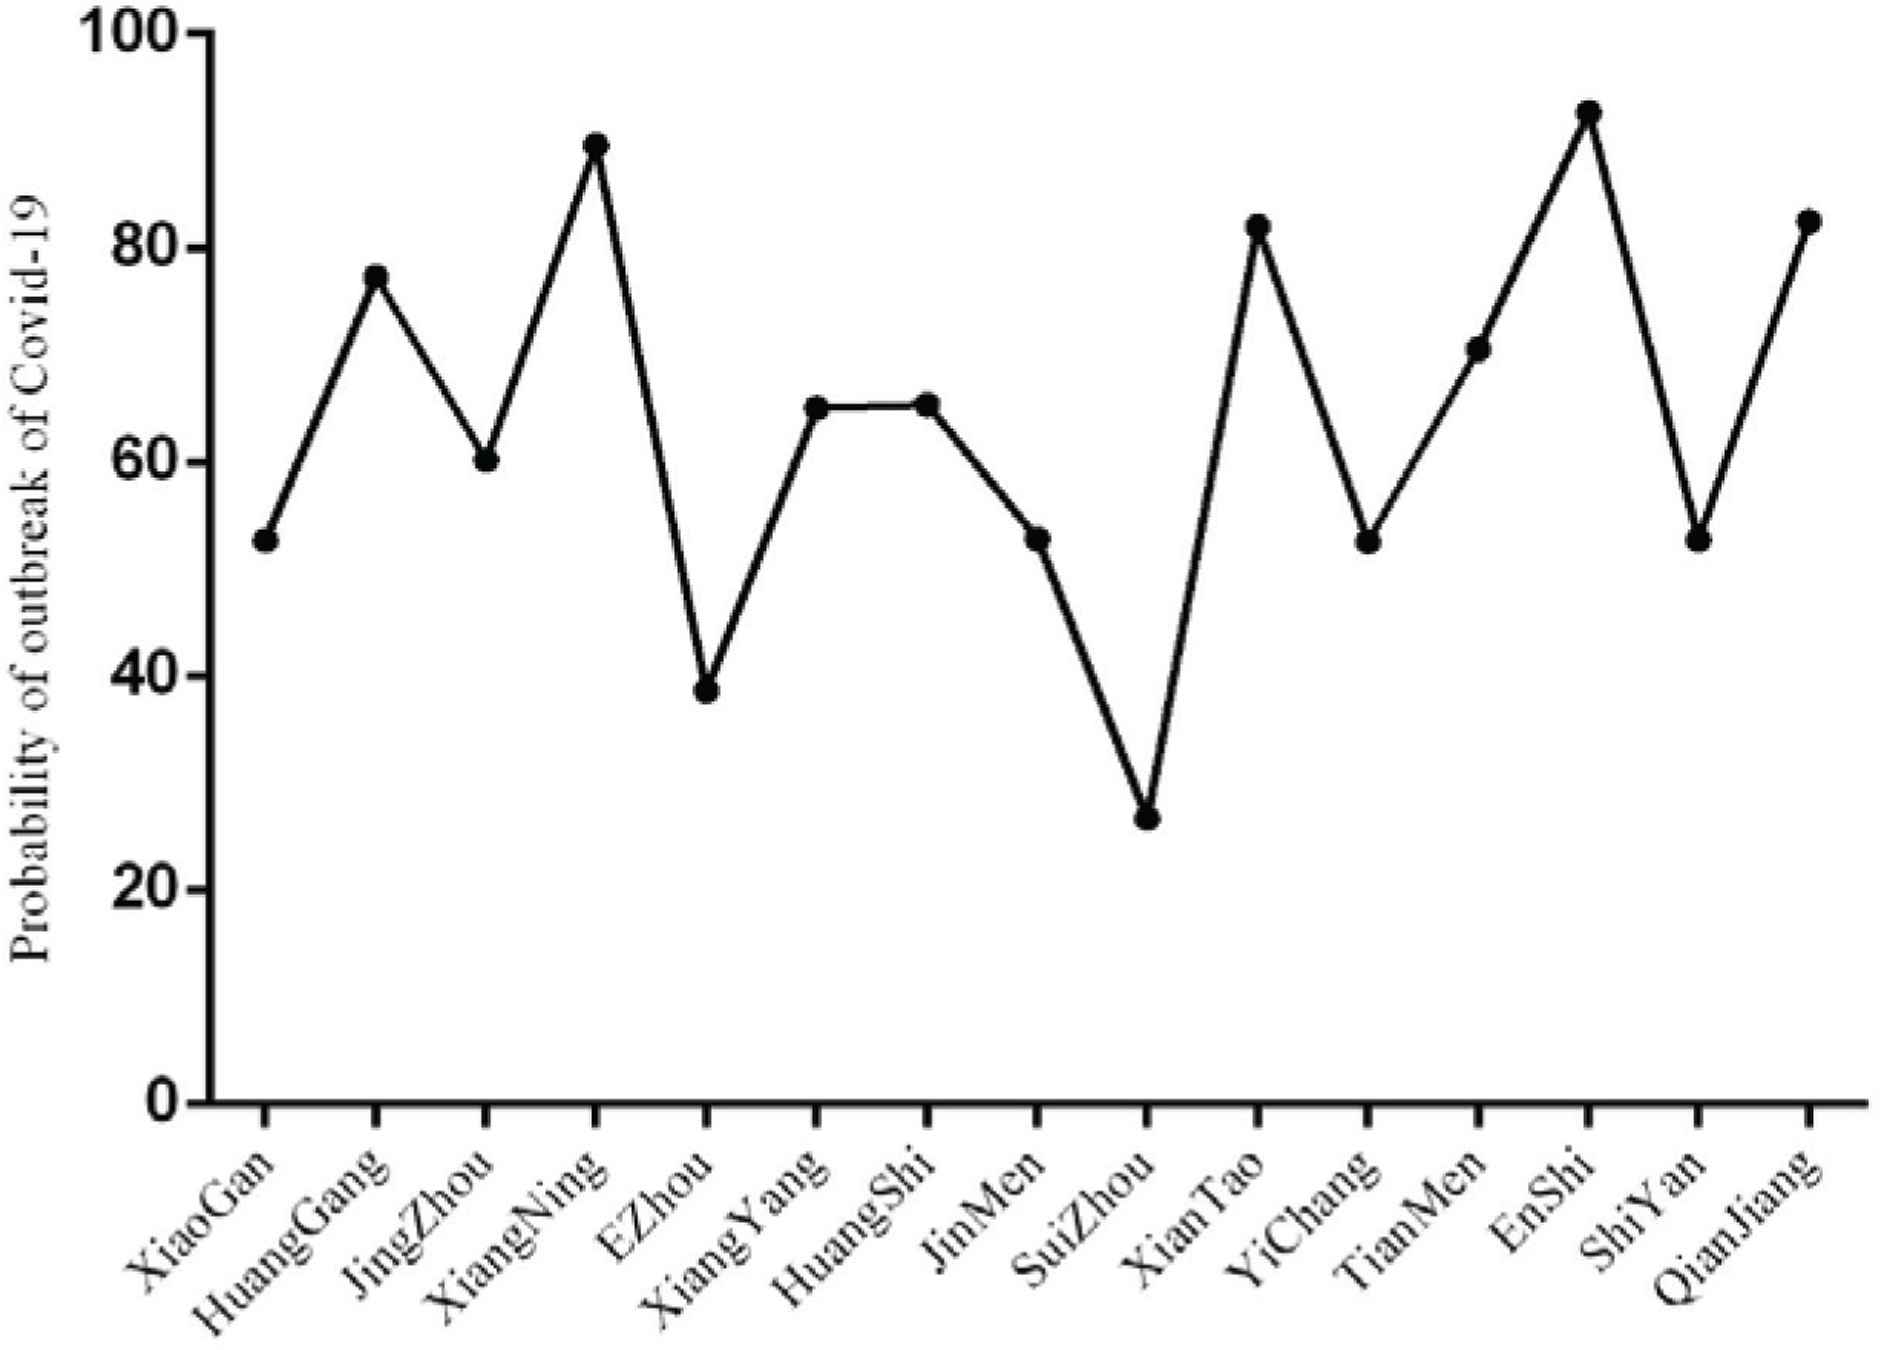
The probability of disease outbreaks caused by population emigration from Wuhan in Hubei.
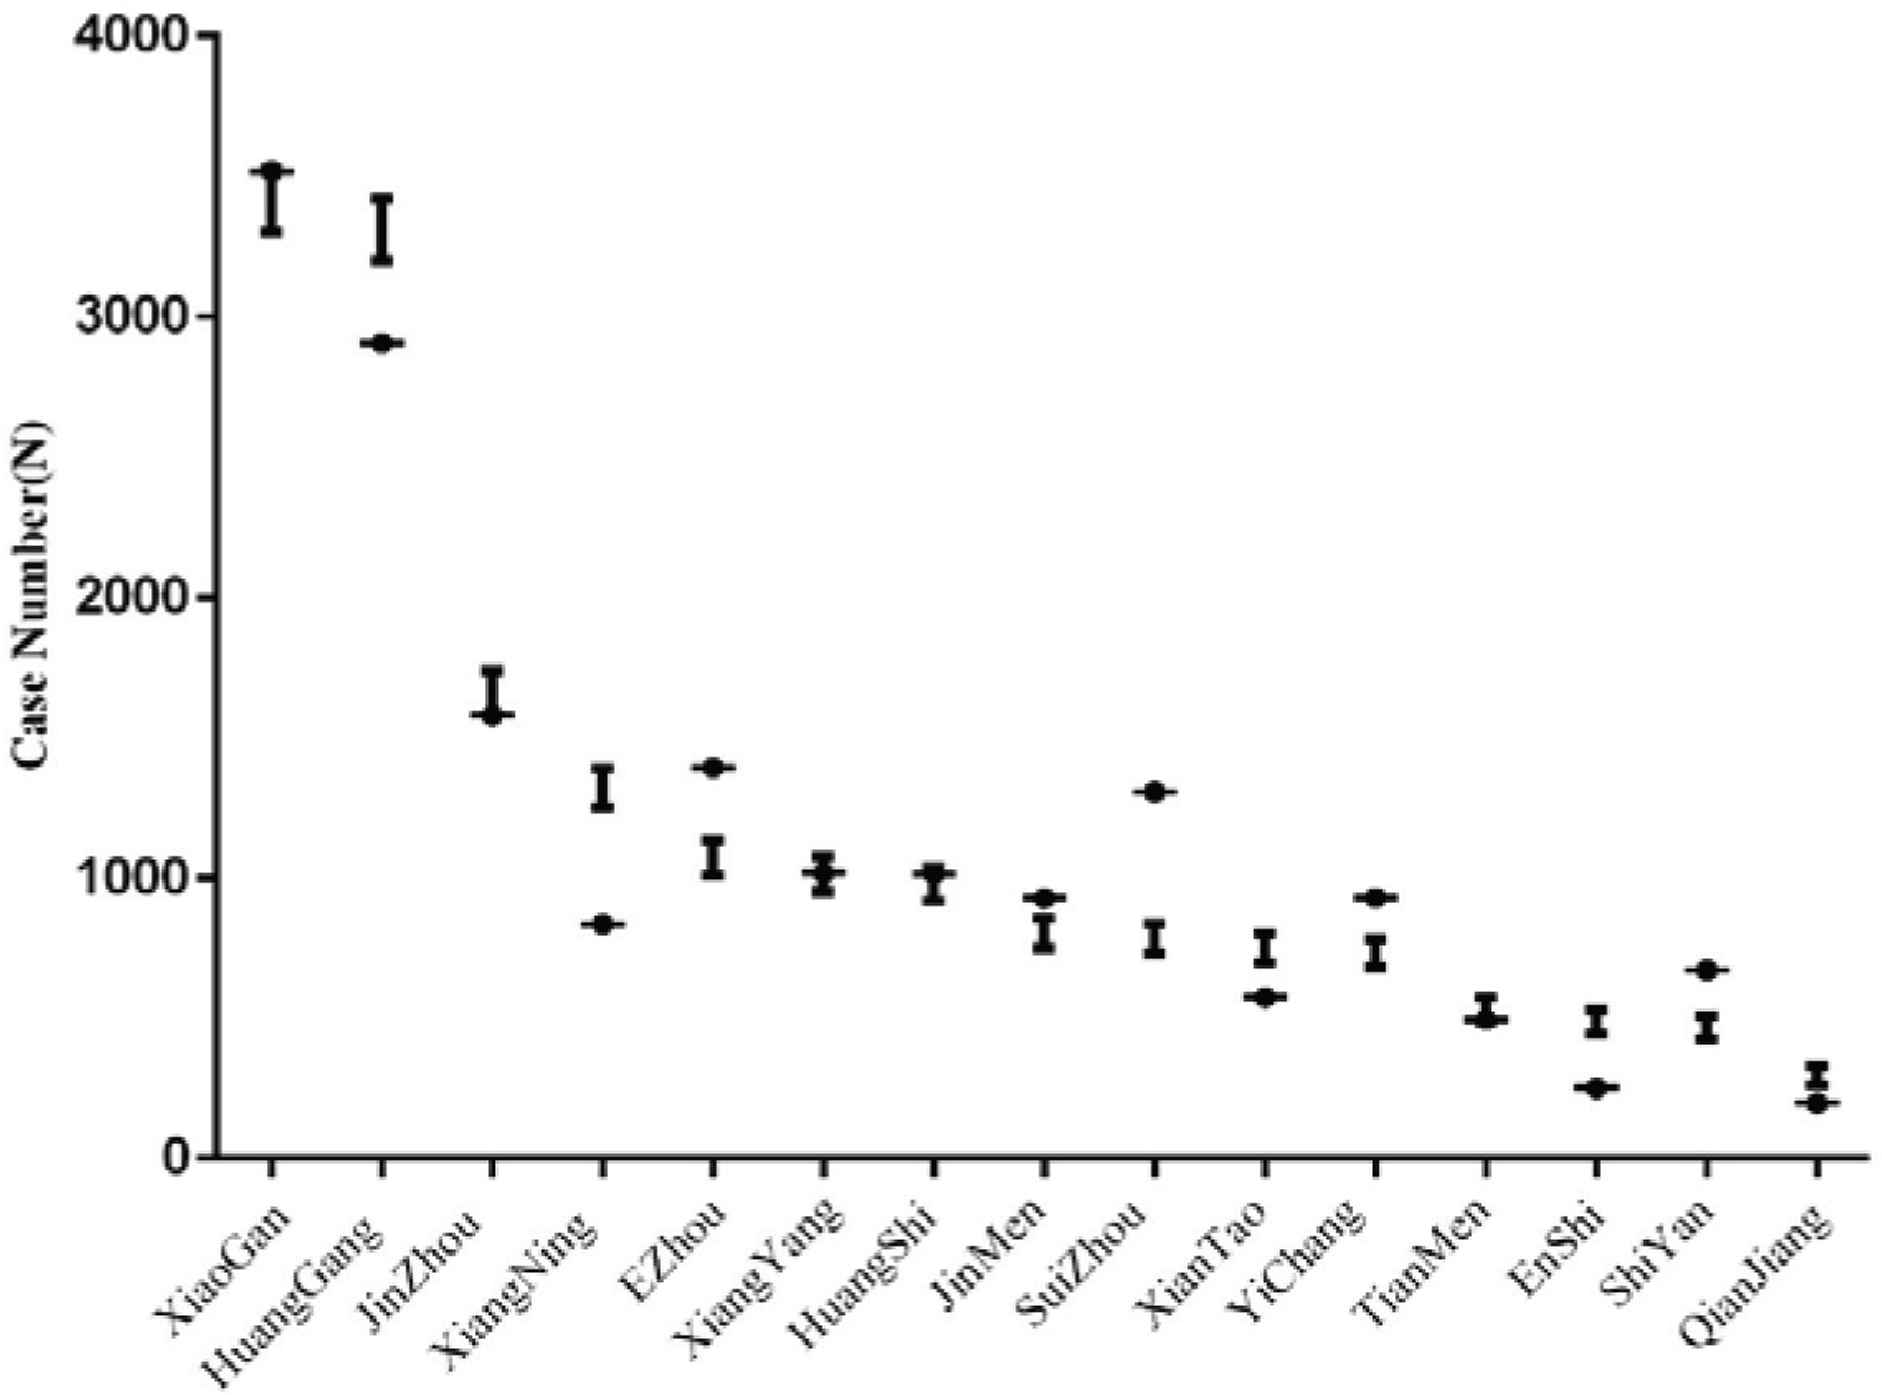
Confirmed case 95% confidence intervals for Hubei.
3.3. Impact of Population Emigration from Wuhan on the Epidemic Outbreak Rate in Provinces Out of Hubei and the Development Trend
For province outside of Hubei, as shown in Table 4 and Figure 5, more than 50% of the outbreak probability was related to population emigration from Wuhan in 23 of the 30 provinces, and the outbreaks were related to population emigration in 76% of provinces outside of Hubei. GuangDong, HeNan and ZheJiang appeared be the worst hit areas in provinces outside of Hubei (Figure 6). The 95% confidence intervals of the confirmed cases were 2467.46569–2661.934, 1138.44806–1271.752 and 1048.36289–1176.437, respectively (Table 4). Therefore, we can draw a preliminary conclusion that the movement from Wuhan correlated positively with the outbreak in each province.
| Province | Emigration ratio from Wuhan (%) | Confirmed number (n) | Probability of outbreak | 95% confidence interval of confirm case | |
|---|---|---|---|---|---|
| Lower | Upper | ||||
| GuangDong | 8.3 | 1352 | 96.562 | 2467.46569 | 2661.934 |
| HeNan | 3.9 | 1272 | 60.7762 | 1138.44806 | 1271.752 |
| ZheJiang | 3.6 | 1215 | 64.3712 | 1048.36289 | 1176.437 |
| JiangSu | 3.3 | 631 | 85.0236 | 958.389136 | 1081.011 |
| HuNan | 3.3 | 946 | 63.4888 | 958.389136 | 1081.011 |
| BeiJing | 2.5 | 428 | 94.8259 | 719.135742 | 825.8643 |
| ShangHai | 2.5 | 342 | 97.3925 | 719.135742 | 825.8643 |
| AnHui | 1.8 | 990 | 38.0487 | 510.918926 | 601.4811 |
| JiangXi | 1.7 | 935 | 41.8817 | 481.294706 | 569.3053 |
| FuJian | 1.5 | 296 | 92.7623 | 422.164224 | 504.8358 |
| ShanDong | 1.1 | 758 | 29.8144 | 304.502156 | 375.2978 |
| SiChuan | 1.0 | 539 | 48.0712 | 275.24948 | 342.7505 |
| ChongQing | 1.0 | 576 | 44.5168 | 275.24948 | 342.7505 |
| HeBei | 0.8 | 318 | 72.5834 | 217.012617 | 277.3874 |
| GuangXi | 0.8 | 252 | 80.3811 | 217.012617 | 277.3874 |
| ShaanXi | 0.72 | 133 | 93.0361 | 193.841734 | 251.1183 |
| YunNan | 0.56 | 174 | 89.0467 | 147.783424 | 198.2966 |
| GuiZhou | 042 | 146 | 62.4061 | 107.907163 | 151.6528 |
| LiaoNing | 0.41 | 125 | 66.7853 | 105.079123 | 148.3009 |
| HaiNan | 0.4 | 168 | 58.1261 | 102.254297 | 144.9457 |
| TianJin | 0.37 | 136 | 64.4544 | 93.8003602 | 134.8596 |
| ShanXi | 0.34 | 133 | 65.0819 | 85.3802341 | 124.7398 |
| HeiLongJiang | 0.2 | 481 | 21.153 | 46.7063086 | 76.89369 |
| XinJiang | 0.2 | 76 | 78.2359 | 46.7063086 | 76.89369 |
| JiLin | 0.17 | 93 | 74.0564 | 38.6143041 | 66.4457 |
| GanSu | 0.17 | 124 | 67.0013 | 38.6143041 | 66.4457 |
| NeiMengGu | 0.15 | 75 | 78.4889 | 33.2784798 | 59.42152 |
| NingXia | 0.08 | 75 | 78.4889 | 15.1739114 | 34.26609 |
| QingHai | 0.05 | 18 | 94.3526 | 7.9031543 | 22.99685 |
| XiZang | 0.02 | 1 | 99.6776 | 1.40695569 | 10.95304 |
The probability of epidemic outbreak and 95% confidence intervals of confirm case in Provinces of China
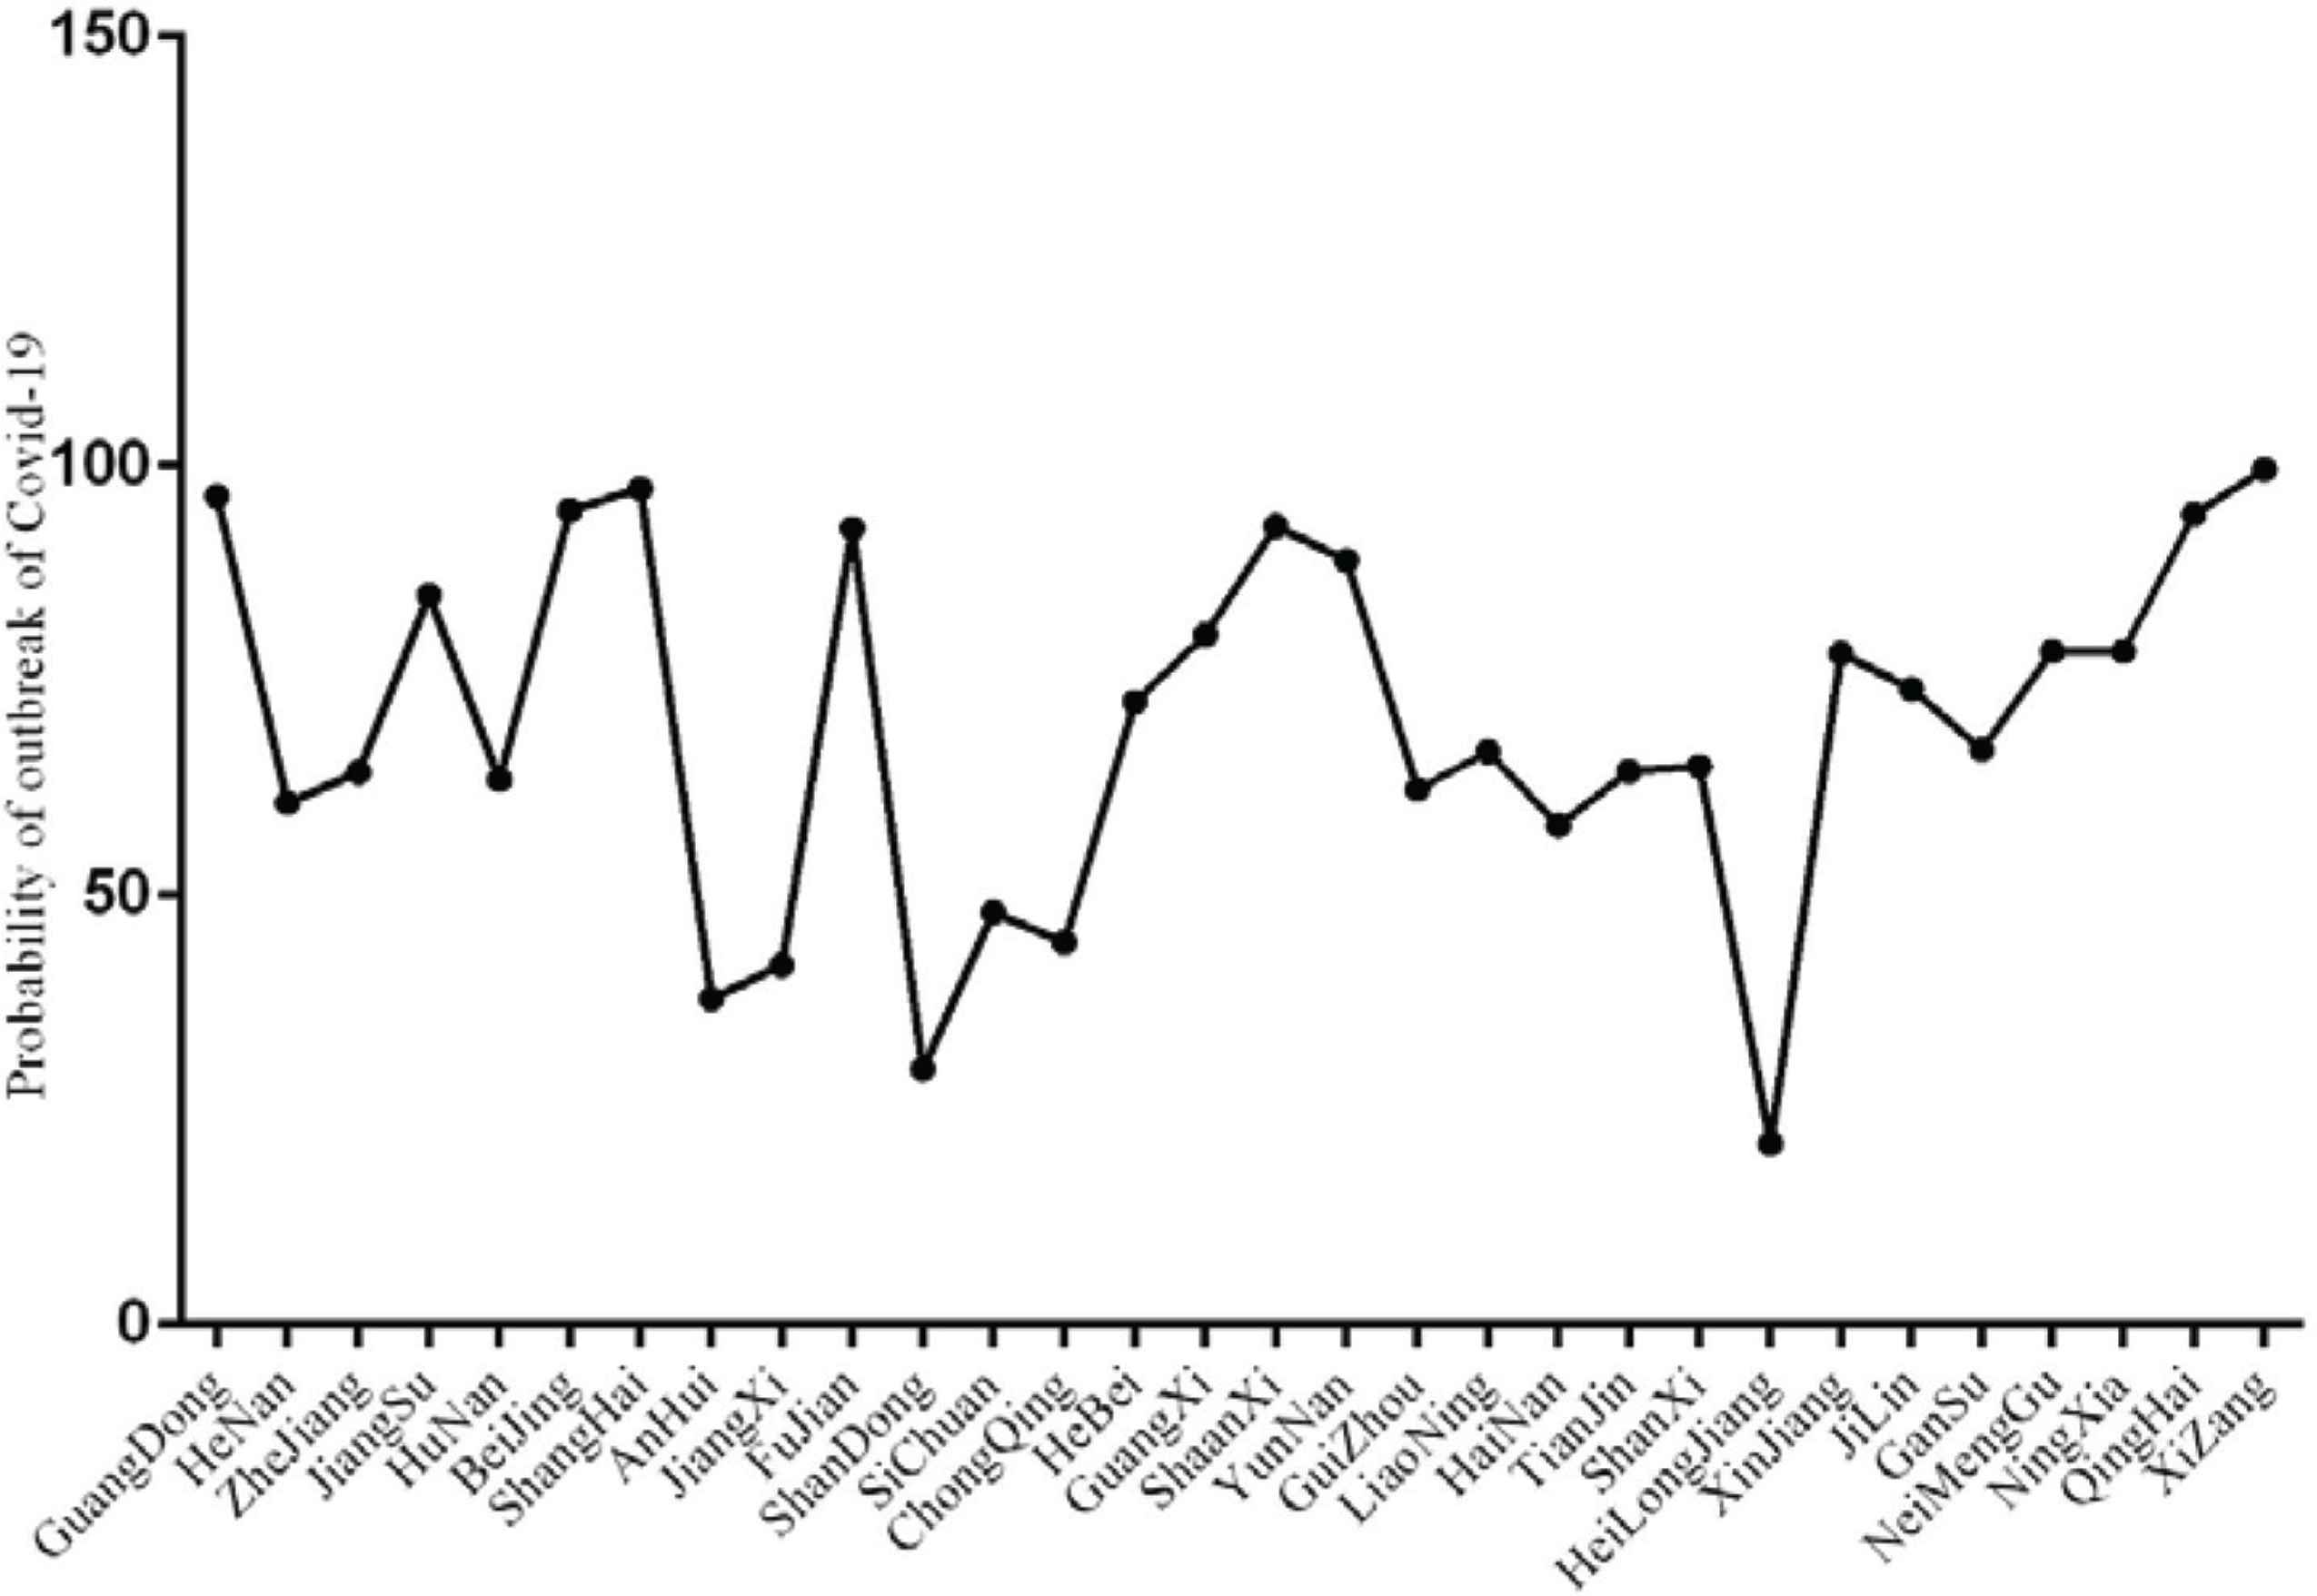
The probability of disease outbreak caused by population emigration from Wuhan in Province out of Hubei.
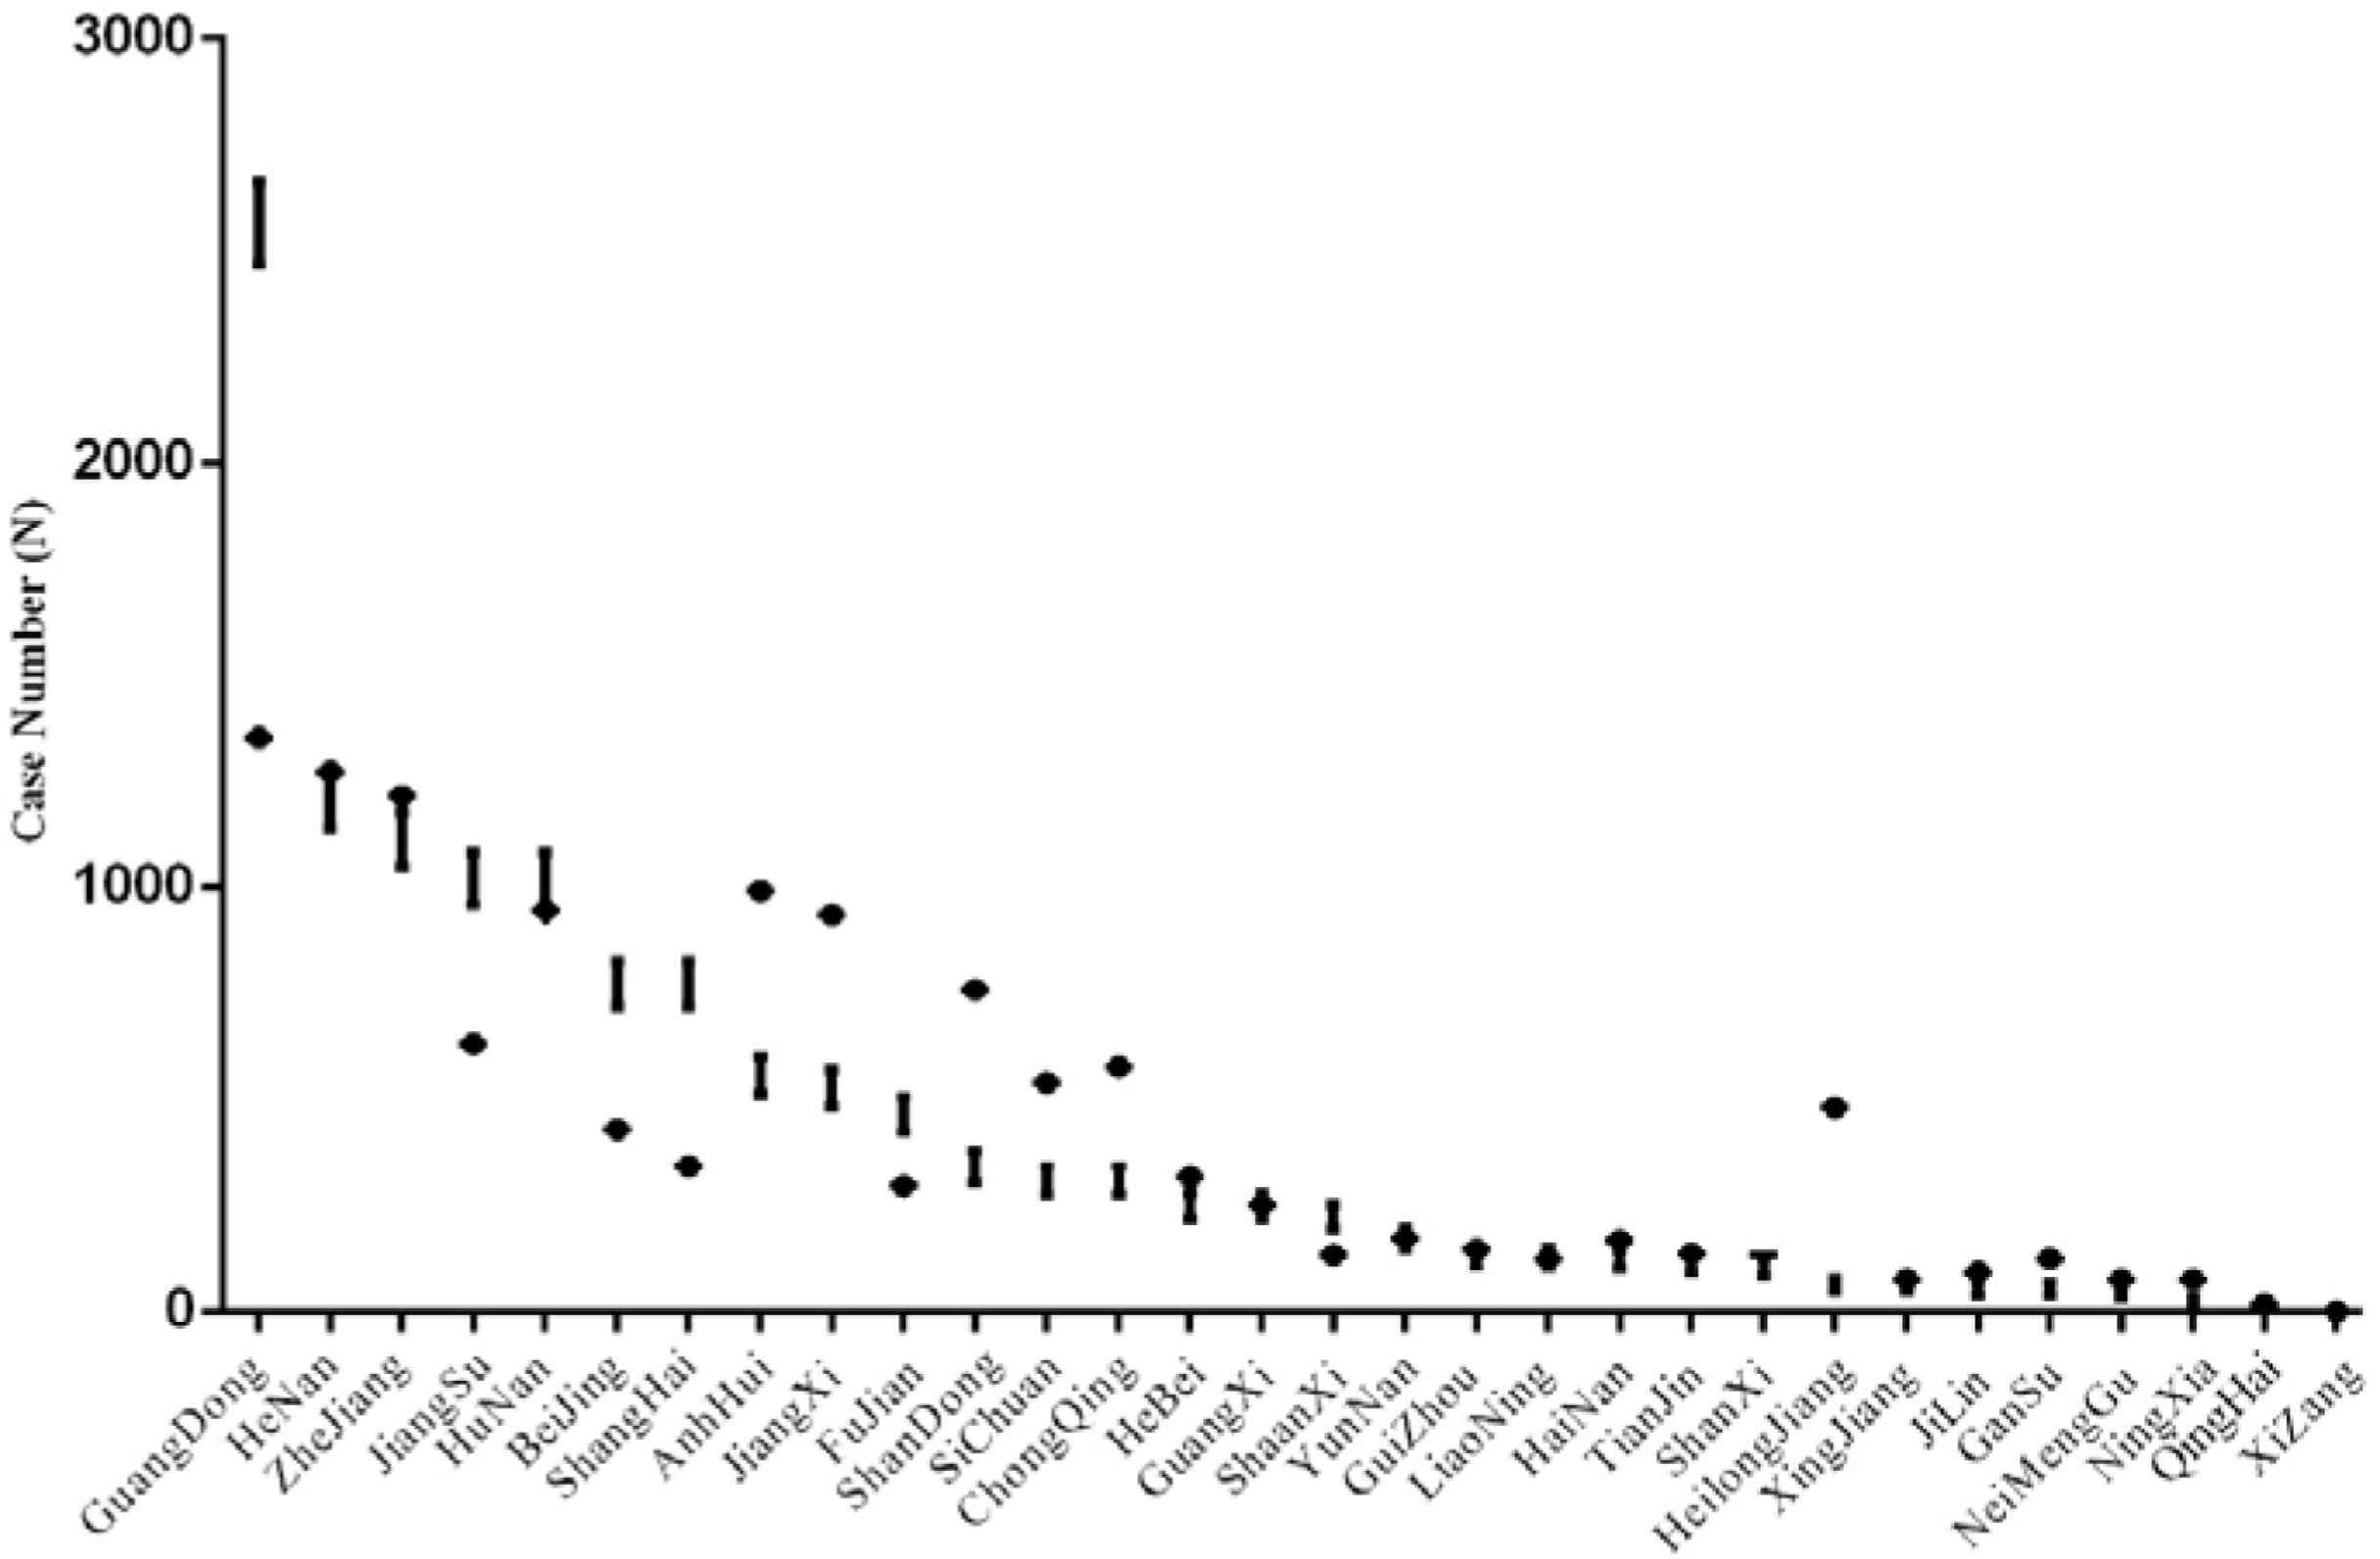
Confirmed case 95% confidence intervals for in province outside of Hubei.
3.4. Relationship between Medical Support and the Cure Rate, and Death Rate of COVID-19 Infection
As shown in Figure 7 and Table 5, before the first medical support arrived in Wuhan on January 24 (New Year’s Eve), the mortality rate in Wuhan continued to increase and the cure rate continued to decline. The obvious change occurred on January 27. Although there was fluctuation on January 28, the overall cure rate showed an upward trend, especially in the last 2 weeks of January. The mortality was stable. The cure rate and mortality between January 21 and 24 were 5.60% (4.40–9.20) and 3.8% (1.1–5.5), respectively, and 11.4% (2.0–68.5) and 3.5% (2.7–5.3) from January 25 to March 8, 2020. (p = 0.867 and 0.248). The difference between medical support and cure rate was statistically significant (r = 0.852, p < 0.001). However, significant for mortality was not observed (r = 0.145, p = 0.637). The overall cure rate and mortality trends showed improvement.
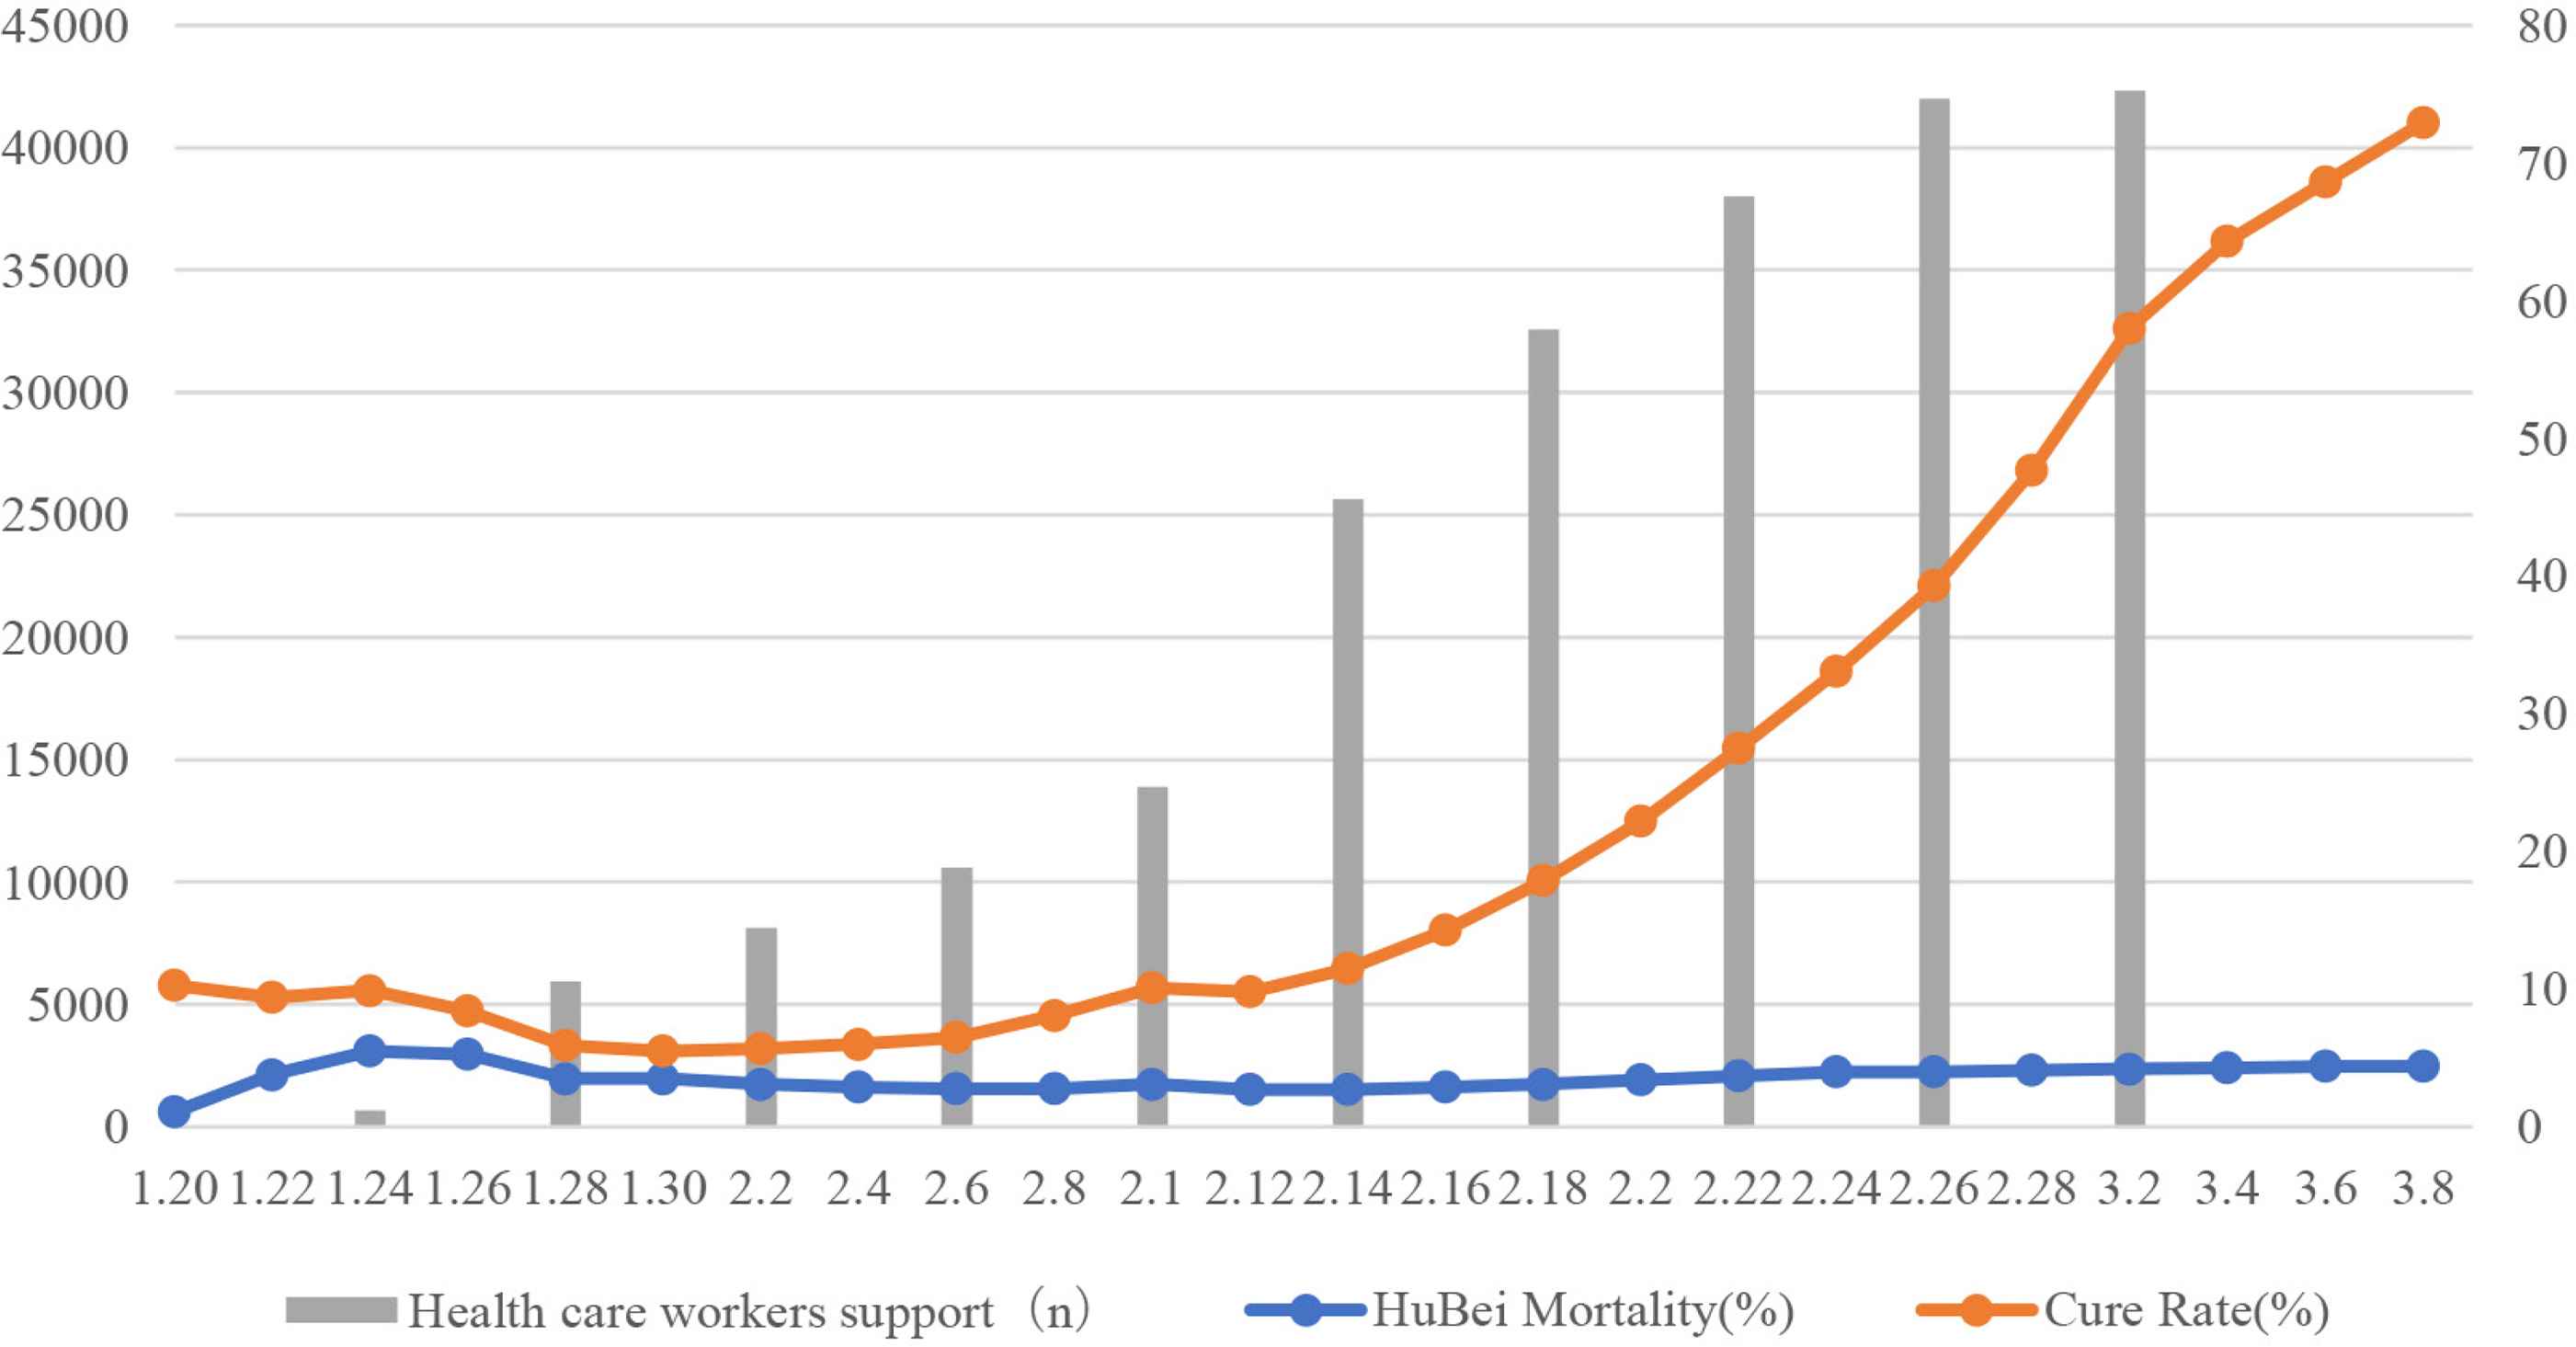
The relationship between the number of medical support, cure and mortality rates in Hubei. There was a positive correlation between medical support and cure rate (p < 0.01).
| Date | Hubei mortality (%) | Cure rate (%) | Health care workers support (n) |
|---|---|---|---|
| 1.20 | 1.1 | 9.2 | |
| 1.22 | 3.8 | 5.6 | |
| 1.24 | 5.5 | 4.4 | 675 |
| 1.26 | 5.3 | 3.1 | |
| 1.28 | 3.5 | 2.4 | 5930 |
| 1.30 | 3.5 | 2.0 | |
| 2.2 | 3.1 | 2.6 | 8130 |
| 2.4 | 2.9 | 3.1 | |
| 2.6 | 2.8 | 3.7 | 10,596 |
| 2.8 | 2.8 | 5.3 | |
| 2.10 | 3.1 | 7.0 | 13,905 |
| 2.12 | 2.7 | 7.1 | |
| 2.14 | 2.7 | 8.8 | 25,633 |
| 2.16 | 2.9 | 11.4 | |
| 2.18 | 3.1 | 14.8 | 32,572 |
| 2.20 | 3.4 | 18.8 | |
| 2.22 | 3.7 | 23.8 | 38,000 |
| 2.24 | 4.0 | 29.1 | |
| 2.26 | 4.0 | 35.3 | 42,000 |
| 2.28 | 4.1 | 43.6 | |
| 3.2 | 4.2 | 53.8 | 42,322 |
| 3.4 | 4.3 | 60.0 | |
| 3.6 | 4.4 | 64.2 | |
| 3.8 | 4.4 | 68.5 |
The date of number of Health care works support and cure rate, mortality in Hubei
4. DISCUSSION
In December 2019, a series of pneumonia cases of unknown cause emerged unexpectedly in Wuhan and spread rapidly across the country. The disease was named COVID-19 [4,9]. By March 8, 2020, more than 80,000 confirmed cases had been confirmed in China. COVID-19 infection has become a legal class B infectious disease under the law of the People’s Republic of China for the prevention and control of infectious diseases and is managed as a Class A infectious disease. The WHO has declared the new coronavirus epidemic as a Public Health Emergency of International Concern (PHEIC). The COVID-19 spreads through respiratory droplets when infected individuals cough, talk loudly or sneeze [10–12]. Close contact is also a source of transmission. Wuhan is the most serious epidemic area in China. Evidence has confirmed that COVID-19 infection in other cities can be traced to Wuhan. Before this feature was discovered, some potentially infected people in Wuhan had already travelled to other cities. However, few studies focused on the relationship between movement from Wuhan and medical support in COVID-19 cases.
This study found that population emigration from Wuhan was related to the probability of outbreaks in Hubei and other provinces. This conclusion is consistent with Chen et al. [13], who found that population movement from Wuhan was the main infection source in other cities and provinces. By establishing a scale free network, Nishiura et al. [14] also found that migration from Wuhan could partially explain the seriousness of the epidemic in Hubei Province and other regions. However, their research mainly focused on the early stage of the epidemic, time span was from January 16 to 30, and factors of medical staff support were not analysed. Fortunately, the Chinese government responded quickly. At 10:00 h on January 23, 2020, the policy of “Closing Wuhan” was implemented. We believe that this policy has played an important role in controlling the spread of the epidemic to some extent.
In addition to controlling population migration, medical support is another important measure to prevent the deterioration of the epidemic situation, medical support from all over the country went to Wuhan on January 24, 2020 (New Year’s Eve), as of March 8, the number of medical staff reached 42,000. Through our analysis, we found that medical support significantly improved the cure rate of patients with COVID-19. When interpreting these results, the following issues should be taken into consideration. The unexpected outbreak of COVID-19 in Wuhan resulted in a serious imbalance between doctors and patients. Medical support alleviated the doctor–patient rate. In addition, medical support provide more manpower for early disease screening, facilitating early intervention and treatment. Furthermore, with more medical support, exhausted personnel were relieved, and both diagnosis and treatment were improved. Medical support also provided a large amount of medical supplies, which ameliorated shortage. Finally, increase in the number of medical staff provided confidence for patients to overcome the disease. This study also indicated that medical support had little effect on mortality, which may be because the majority of cured patients had mild disease, and the number of severe cases was not significantly reduced.
In general, we should control the spread of the epidemic from the source and strengthen medical support from all regions. These two measures have a certain role in controlling the epidemic of COVID-19.
This study has several limitations. First, due to limited information, laboratory indicators were not valuated in this study. Second, the sample size was small, and a large sample size is needed to reach more reliable conclusions. Third, the data involved in this study were all from public websites. Therefore, no detailed data were obtained.
CONFLICTS OF INTEREST
The authors declare they have no conflicts of interest.
AUTHORS’ CONTRIBUTION
YY and TY designed the study, conducted analysis, and drafted the work; ZJ made substantial contribution to design of the work, interpretation of the work, and revising the draft for important intellectual content; CBG, DX, LY and DLG helped with access to the data and provided information and consulting; WSY made substantial contributions to the conception of the work, revising the draft for important intellectual content, and agreed to be accountable for all aspects of the work in ensuring that questions related to the accuracy or integrity of any part of the work are appropriately investigated and resolved.
FUNDING
This research received no specific grant from any funding agency in the public, commercial or not-for-profit sectors.
ACKNOWLEDGMENTS
Thanks for Bogan Cao, Xin Diao, Yan Liu and Ligai Di. They are the frontline medical support fighting against 2019-nCoV in Wuhan and provided us valuable information after their busy work. In addition, we pay high tribute to the medical staff who are fighting against COVID-19 in China.
ETHICS APPROVAL
Formal ethical approval is not required as no primary data will be collected.
Footnotes
REFERENCES
Cite this article
TY  - JOUR
AU  - Yang Yao
AU  - Yao Tian
AU  - Jing Zhou
AU  - Xin Diao
AU  - Ligai Di
AU  - Shengyu Wang
PY  - 2020
DA  - 2020/12/08
TI  - Impact of Population Emigration from Wuhan and Medical Support on COVID-19 Infection in China
JO  - Journal of Epidemiology and Global Health
SP  - 178
EP  - 185
VL  - 11
IS  - 2
SN  - 2210-6014
UR  - https://doi.org/10.2991/jegh.k.201121.001
DO  - 10.2991/jegh.k.201121.001
ID  - Yao2020
ER  -