
Evaluation of Noninvasive Respiratory Volume Monitoring in the PACU of a Low Resource Kenyan Hospital
Additional information: Adjunct Professor, Electrical and Computer Engineering, McGill University, Montréal, Québec, Canada
- DOI
- 10.2991/jegh.k.200203.001How to use a DOI?
- Keywords
- Respiratory volume monitor; post-anesthesia care unit; opioid-induced respiratory depression; respiratory monitoring; respiratory physiology; proactive care
- Abstract
This research aims to evaluate the use of the noninvasive respiratory volume monitor (RVM) compared to the standard of care (SOC) in the Post-Anesthesia Care Unit (PACU) of Kijabe Hospital, Kenya. The RVM provides real-time measurements for quantitative monitoring of non-intubated patients. Our evaluation was focused on the incidence of postoperative opioid-induced respiratory depression (OIRD). The RVM cohort (N = 50) received quantitative OIRD assessment via the RVM, which included respiratory rate, minute ventilation, and tidal volume. The SOC cohort (N = 46) received qualitative OIRD assessment via patient monitoring with oxygenation measurements (SpO2) and physical examination. All diagnosed cases of OIRD were in the RVM cohort (9/50). In the RVM cohort, participants stayed longer in the PACU and required more frequent airway maneuvers and supplemental oxygen, compared to SOC (all p < 0.05). The SOC cohort may have had fewer diagnoses of OIRD due to the challenging task of distinguishing hypoventilation versus OIRD in the absence of quantitative data. To account for the higher OIRD risk with general anesthesia (GA), a subgroup analysis was performed for only participants who underwent GA, which showed similar results. The use of RVM for respiratory monitoring of OIRD may allow for more proactive care.
- Copyright
- © 2020 The Authors. Published by Atlantis Press International B.V.
- Open Access
- This is an open access article distributed under the CC BY-NC 4.0 license (http://creativecommons.org/licenses/by-nc/4.0/).
1. INTRODUCTION
In 2007, Dr. Atul Gawande led the World Health Organization (WHO) to investigate avoidable deaths in surgery, which resulted in the WHO Guidelines for Safe Surgery and the Surgical Safety Checklist and distribution of pulse oximeters to low- and middle-income countries (LMIC) [1]. As a result, many Post-Anesthesia Care Units (PACUs) in austere settings assess respiratory status using pulse oximeters or qualitative clinical assessment when pulse oximetry is unavailable. However, repeated evidence that shows the detection of postsurgical complications, such as respiratory insufficiency (the focus of this study), may not be well communicated while using pulse oximeter monitoring [2–7]. Therefore, many LMIC hospitals may lack a reliable and continuous way of quantitatively monitoring ventilation in postoperative, non-intubated patients.
In the PACU, vigilant respiratory monitoring of all patients, especially those with a high risk of complications, is important to ensure proper patient care, as supported by the American Society of Anesthesiologists (ASA) [8]. This risk is elevated that pain management with opioids in the PACU can result in OIRD.
OIRD is a depression of respiratory rate (RR) below the normal 12–20 breaths/min rate and may often go unnoticed by qualitative respiratory monitoring techniques [9,10]. OIRD can result in oxygen desaturation, atelectasis, and worsening pain in at-risk patients. Patients with OIRD experience 55% longer hospital stays, 47% higher care costs, 36% increased risk of 30-day readmission, and 3.4 times higher risk of inpatient mortality compared to those with no opioid-related adverse drug events [11]. Risk factors for developing OIRD include patients with obstructive sleep apnea, obese patients, the elderly, those with lung diseases and/or sleep-related disorders, and patients who have had intravenous anesthetics, volatile agents, and opioids both intraoperatively and postoperatively [12]. OIRD may be diagnosed through respiratory monitoring and additional respiratory measures, such as minute ventilation (MV) and tidal volume (TV). MV and TV are reported on standard ventilators, but are absent from non-intubated patients [13]. In addition to limited respiratory monitoring technology in many hospitals, there is a lack of standardized diagnostic criteria in the literature, making OIRD diagnoses inconsistent and arbitrary [2,9,14].
Respiratory monitoring may be improved using the respiratory volume monitor (RVM), which has recently been developed to provide real-time measurements of MV, TV, and RR, via a standardized set of bioimpedance thoracic electrodes in non-intubated patients. The RVM, shown in Figure 1, was approved by the food and drug association (FDA) and has demonstrated accurate measurement of MV, TV, and RR [13,15–18]. The RVM can provide reproducible and comparable data to improve evaluation of respiratory status in various situations.
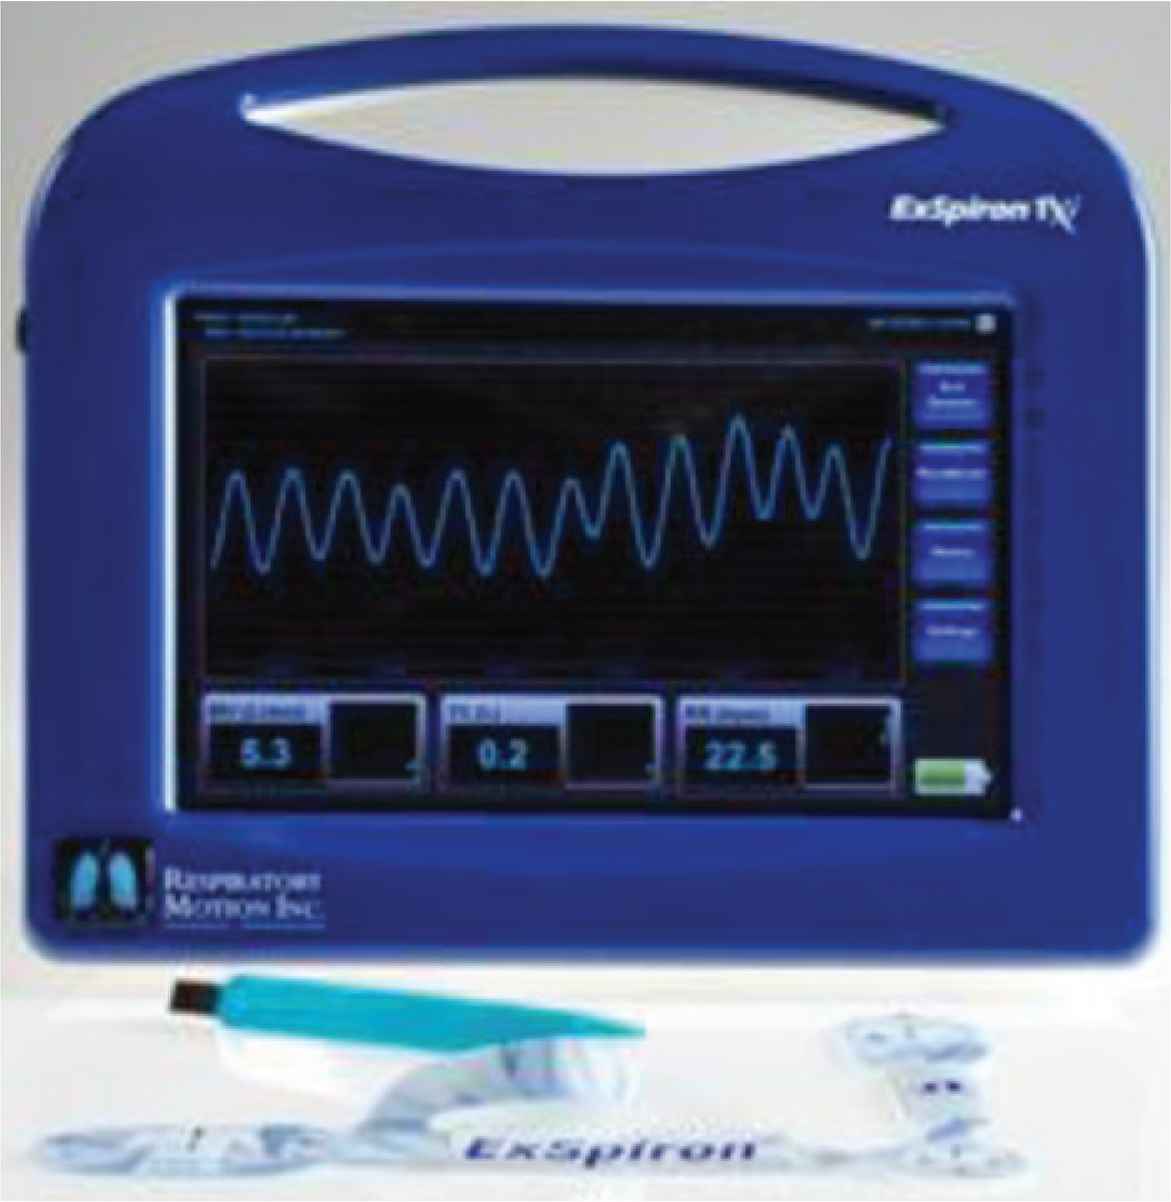
ExSpiron respiratory volume monitor (Respiratory Motion, Inc., Waltham, MA, USA) [19].
This research aims to evaluate the use of RVM compared to the standard of care (SOC) in the PACU of Kijabe Hospital, Kenya, specifically with the focus of OIRD diagnoses and related complications. The overall goal of this research is to identify potential strategies to improve respiratory monitoring and prevent postoperative complications.
2. MATERIALS AND METHODS
A prospective randomized study of an SOC cohort postsurgery compared to an RVM cohort of similar postoperative participants was used. The RVM cohort received quantitative OIRD assessment via RVM, whereas the SOC cohort received qualitative OIRD assessment through physical examination. Postoperative respiratory function of participants and complications were compared between the two cohorts. Participants were observed in the PACU by PACU nurses.
2.1. Ethical Considerations
Ethical approval was obtained from the Research and Ethics Committee of the Kijabe Hospital. Written and informed consent was also obtained from each patient or family member, if the patient could not provide consent. Participants were explained the purpose of research, duration of participation by the subject, experimental procedure, and participant role. Participants were not required to give their names nor where they came from, and each participant was given a unique identification study number. No pictures, videotapes, or audiotapes were used during the study. No additional costs were incurred by the participants during the research. Participants were informed that they were free to withdraw from the study project at any point and no consequences would result.
2.2. Research Setting
The research was performed in the PACU of Africa Inland Church Kijabe Hospital, located in the rural Kiambu County, Kenya [20]. In 2014, Kijabe Hospital received two donated noninvasive RVM ExSpiron machines from Respiratory Motion’s global outreach program aimed to improve patient care and education [19]. Kijabe Hospital was selected based on a long-term relationship that Kijabe has with Vanderbilt University Medical Center through the Vanderbilt International Anesthesia (VIA) program. There is no financial relationship between Respiratory Motion and the authors of this paper.
2.3. Participants
Participants included non-intubated PACU patients aged 16–99 years who were at risk for OIRD (calculation explained below) and who underwent surgery under general anesthesia (GA) during daytime hours (from 8 AM to 5 PM, excluding weekends and public holidays). A power analysis projected a sample size of 96 participants would be appropriate for this study; therefore, 96 participants were enrolled randomly into both cohorts of the study. Demographics of participants are provided in the Supplementary Material.
2.4. Exclusion Criteria
The following patients were excluded: All intubated patients, children aged 0–16 years, non-surgery patients, and patients undergoing emergency or elective surgery during the night, weekends or on a public holiday. In both cohorts, any subject who had low O2 saturation (below 94%) immediately postoperatively and did not have chronic obstructive pulmonary disease (COPD) was given oxygen via nasal cannula or facemask to keep O2 saturation above 94%. Also, any subject with upper airway obstruction had positioning improved by a jaw thrust and chin lift maneuver and left lateral positioning. Nasal and oral airways to help obstructions and suctioning to help secretions were also used to prevent respiratory insufficiency. Additionally, any subject who did not improve with these interventions, and was hemodynamically unstable, was intubated and transferred to the intensive care unit for further monitoring and mechanical ventilation.
2.5. SOC Cohort—Qualitative Assessment
The SOC for respiratory monitoring in the PACU consists of patient monitoring with oxygenation measurements (assessed by SpO2) and physical examination. The SOC cohort had RVM preoperatively to determine a baseline MV for each subject (calculation explained below). Postoperatively, standard monitoring, observation, and documentation of vital signs were conducted with pulse oximeters and without RVM. Several variables that are factored into a PACU discharge score were measured for comparison. These variables included activity, breathing, circulation, level of consciousness, and pulse oximetry (oxygen saturation) [21]. After initial monitoring and satisfaction of PACU discharge criteria, participants were discharged to the ward.
2.6. RVM Cohort—Quantitative Assessment
The same monitoring, observation, and documentation used in the SOC cohort were applied; however, the RVM cohort received RVM respiratory monitoring pre- and postoperatively in the PACU. The same variables and PACU discharge criteria used in the SOC cohort were applied.
2.7. Instrumentation
The Respiratory Motion ExSpiron RVM, a bioimpedance-based RVM, was used to collect digital respiratory traces from an Electrode PadSet placed on the thorax. As shown in Figure 2, one Electrode PadSet with three electrodes was placed along the sternum, the other on the level of the xiphoid process, and the other across the midaxillary line at the level of the xiphoid process. With the recommended electrode placement and calibration algorithms, the RVM measurements demonstrate a strong correlation with spirometric measurements (R > 0.96 ± 0.16, mean ± 95% confidence interval for regular and erratic breathing) [16]. Electrode placements were determined by anatomical characteristics, and sensitive areas of participants were avoided. All PACU personnel were trained in proper use and interpretation of the RVM before the study.
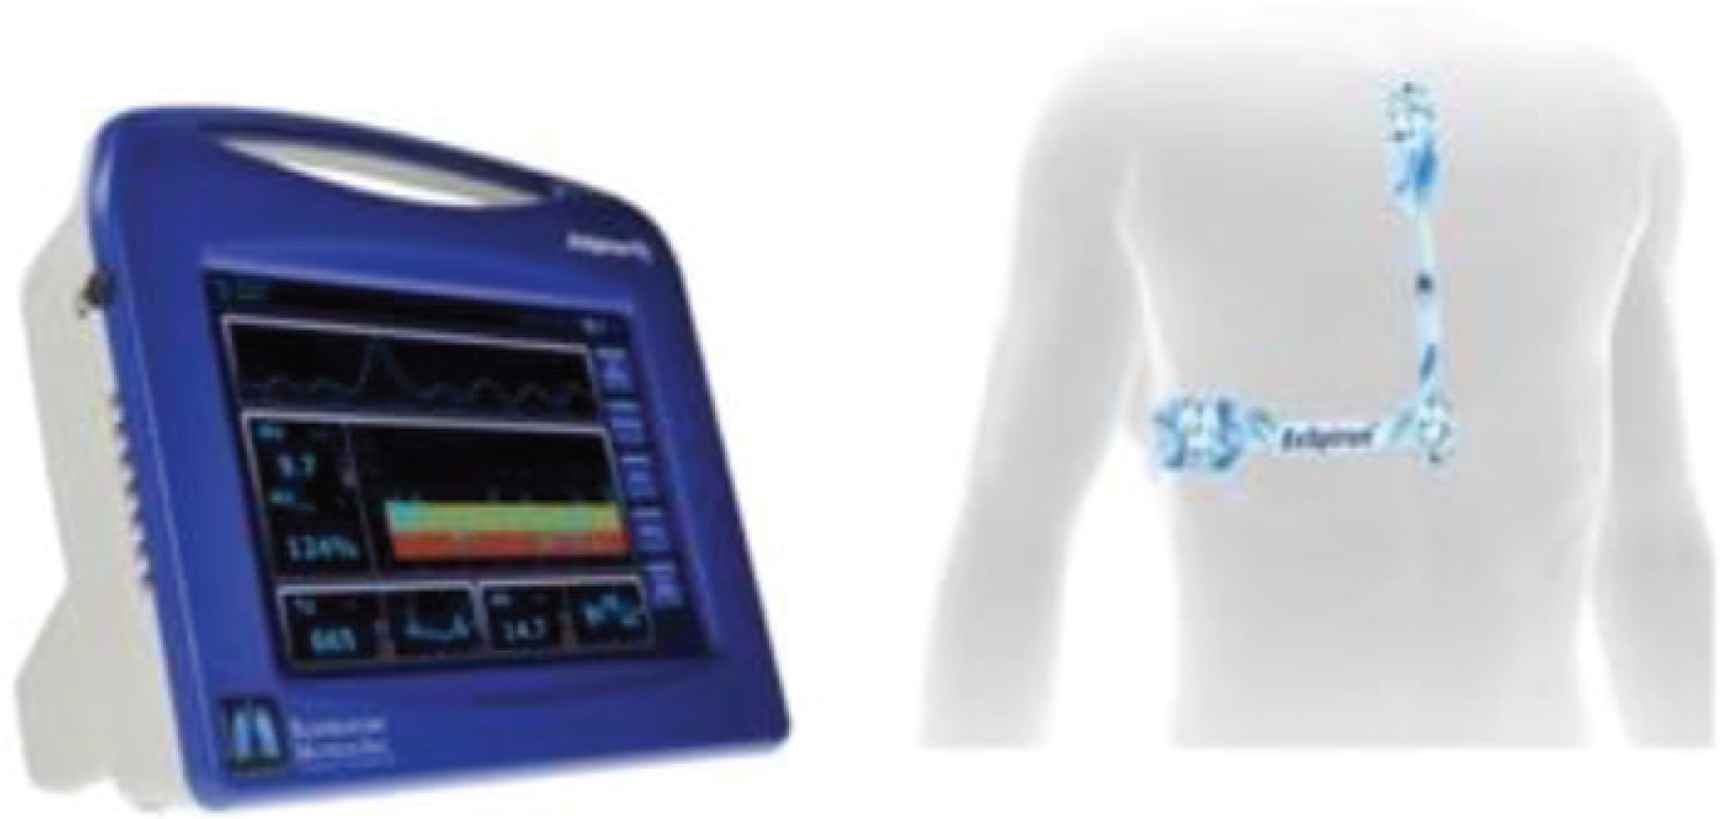
Standard PadSet placement. Noninvasive respiratory volume monitor [19].
3. PROTOCOL AND OPERATIONAL DEFINITIONS
All participants were evaluated in PACU before and after surgery while in the supine position. Standard ASA monitoring was implemented per PACU recommended practice (pulse oximetry, heart rate, and blood pressure monitoring). All data were documented via a data collection tool. For the detailed tool, see the Supplementary Material.
3.1. Preoperative (Same for Both Cohorts)
- •
Estimated MV (MVesti) was calculated using: MVesti = TV × RR, where TV was calculated using 7 ml/kg.
- •
Actual baseline MV (MVbase), TV, and RR were then measured using RVM for a period of 2 min of quiet breathing.
- •
Percentage predicted MV (MVpred) is the ratio of MVbase and MVesti at baseline and was given as MVpred = (MVbase/MVesti) × 100.
- •
At-risk classification = MV <80% of MVpred and as not at risk if their MV was >80% of MVpred.
3.2. Postoperative
- •
RVM: OIRD = MV <40% of MVbase was observed and sustained for at least 2 min.
- •
SOC: OIRD = RR below normal (12–20 breaths/min) sustained for >2 min.
3.3. Statistical Methods
Cohorts were compared using the Pearson Chi-square test and Wilcoxon test. A p value <0.05 was considered statistically significant. Confidence intervals were generated using the Wilson score method.
4. RESULTS
OIRD was diagnosed in 9 of 50 participants in the RVM cohort (18%; 95% CI: 10%, 31%) and 0 of 46 participants in the SOC cohort (95% CI: 0%, 8%; Table 1).
| Standard of care | Respiratory volume monitor | Test statistic | ||
|---|---|---|---|---|
| N = 46 | N = 50 | 1: Pearson test | ||
| 2: Wilcoxon test | ||||
| Opioid-induced respiratory depression diagnosis | χ2 = 8.9 | P1 = 0.003 | ||
| No | 1.00 (46) | 0.82 (41) | ||
| Yes | 0.00 (0) | 0.18 (9) | ||
| Post-Anesthesia Care Unit duration (min) | F = 4.6 | P2 = 0.035 | ||
| 25th percentile | 46 | 50 | ||
| Median | 50 | 62 | ||
| 75% percentile | 70 | 90 | ||
| |
59 ± 29 | 71 ± 32 | ||
| Naloxone administered | χ2 = 8.9 | P1 = 0.003 | ||
| No | 1.00 (46) | 0.82 (41) | ||
| Yes | 0.00 (0) | 0.18 (9) | ||
| Airway maneuver required | χ2 = 11 | P1 = 0.001 | ||
| No | 0.91 (42) | 0.62 (31) | ||
| Yes | 0.09 (4) | 0.38 (19) | ||
| O2 required | χ2 = 12 | P1 = 0.001 | ||
| No | 0.71 (33) | 0.36 (18) | ||
| Yes | 0.29 (13) | 0.64 (32) | ||
| Admission status | χ2 = 6 | P1 = 0.110 | ||
| Discharged | 0.20 (9) | 0.12 (6) | ||
| General ward | 0.69 (32) | 0.58 (29) | ||
| HDU | 0.09 (4) | 0.28 (14) | ||
| Intensive care unit | 0.02 (1) | 0.02 (1) | ||
HDU, High dependency unit.
Postsurgery comparison based on cohort
Comparing the SOC to the RVM cohort, participants in the RVM cohort had significantly more frequent OIRD diagnoses (p = 0.003), longer PACU stay duration (p = 0.035), and more frequent administration of naloxone (p = 0.003), supplemental oxygen (p < 0.001), and airway maneuvers (p < 0.001; Table 1 and Figure 3). There was no evidence that admission status differed significantly by cohort (p = 0.110; Table 1).
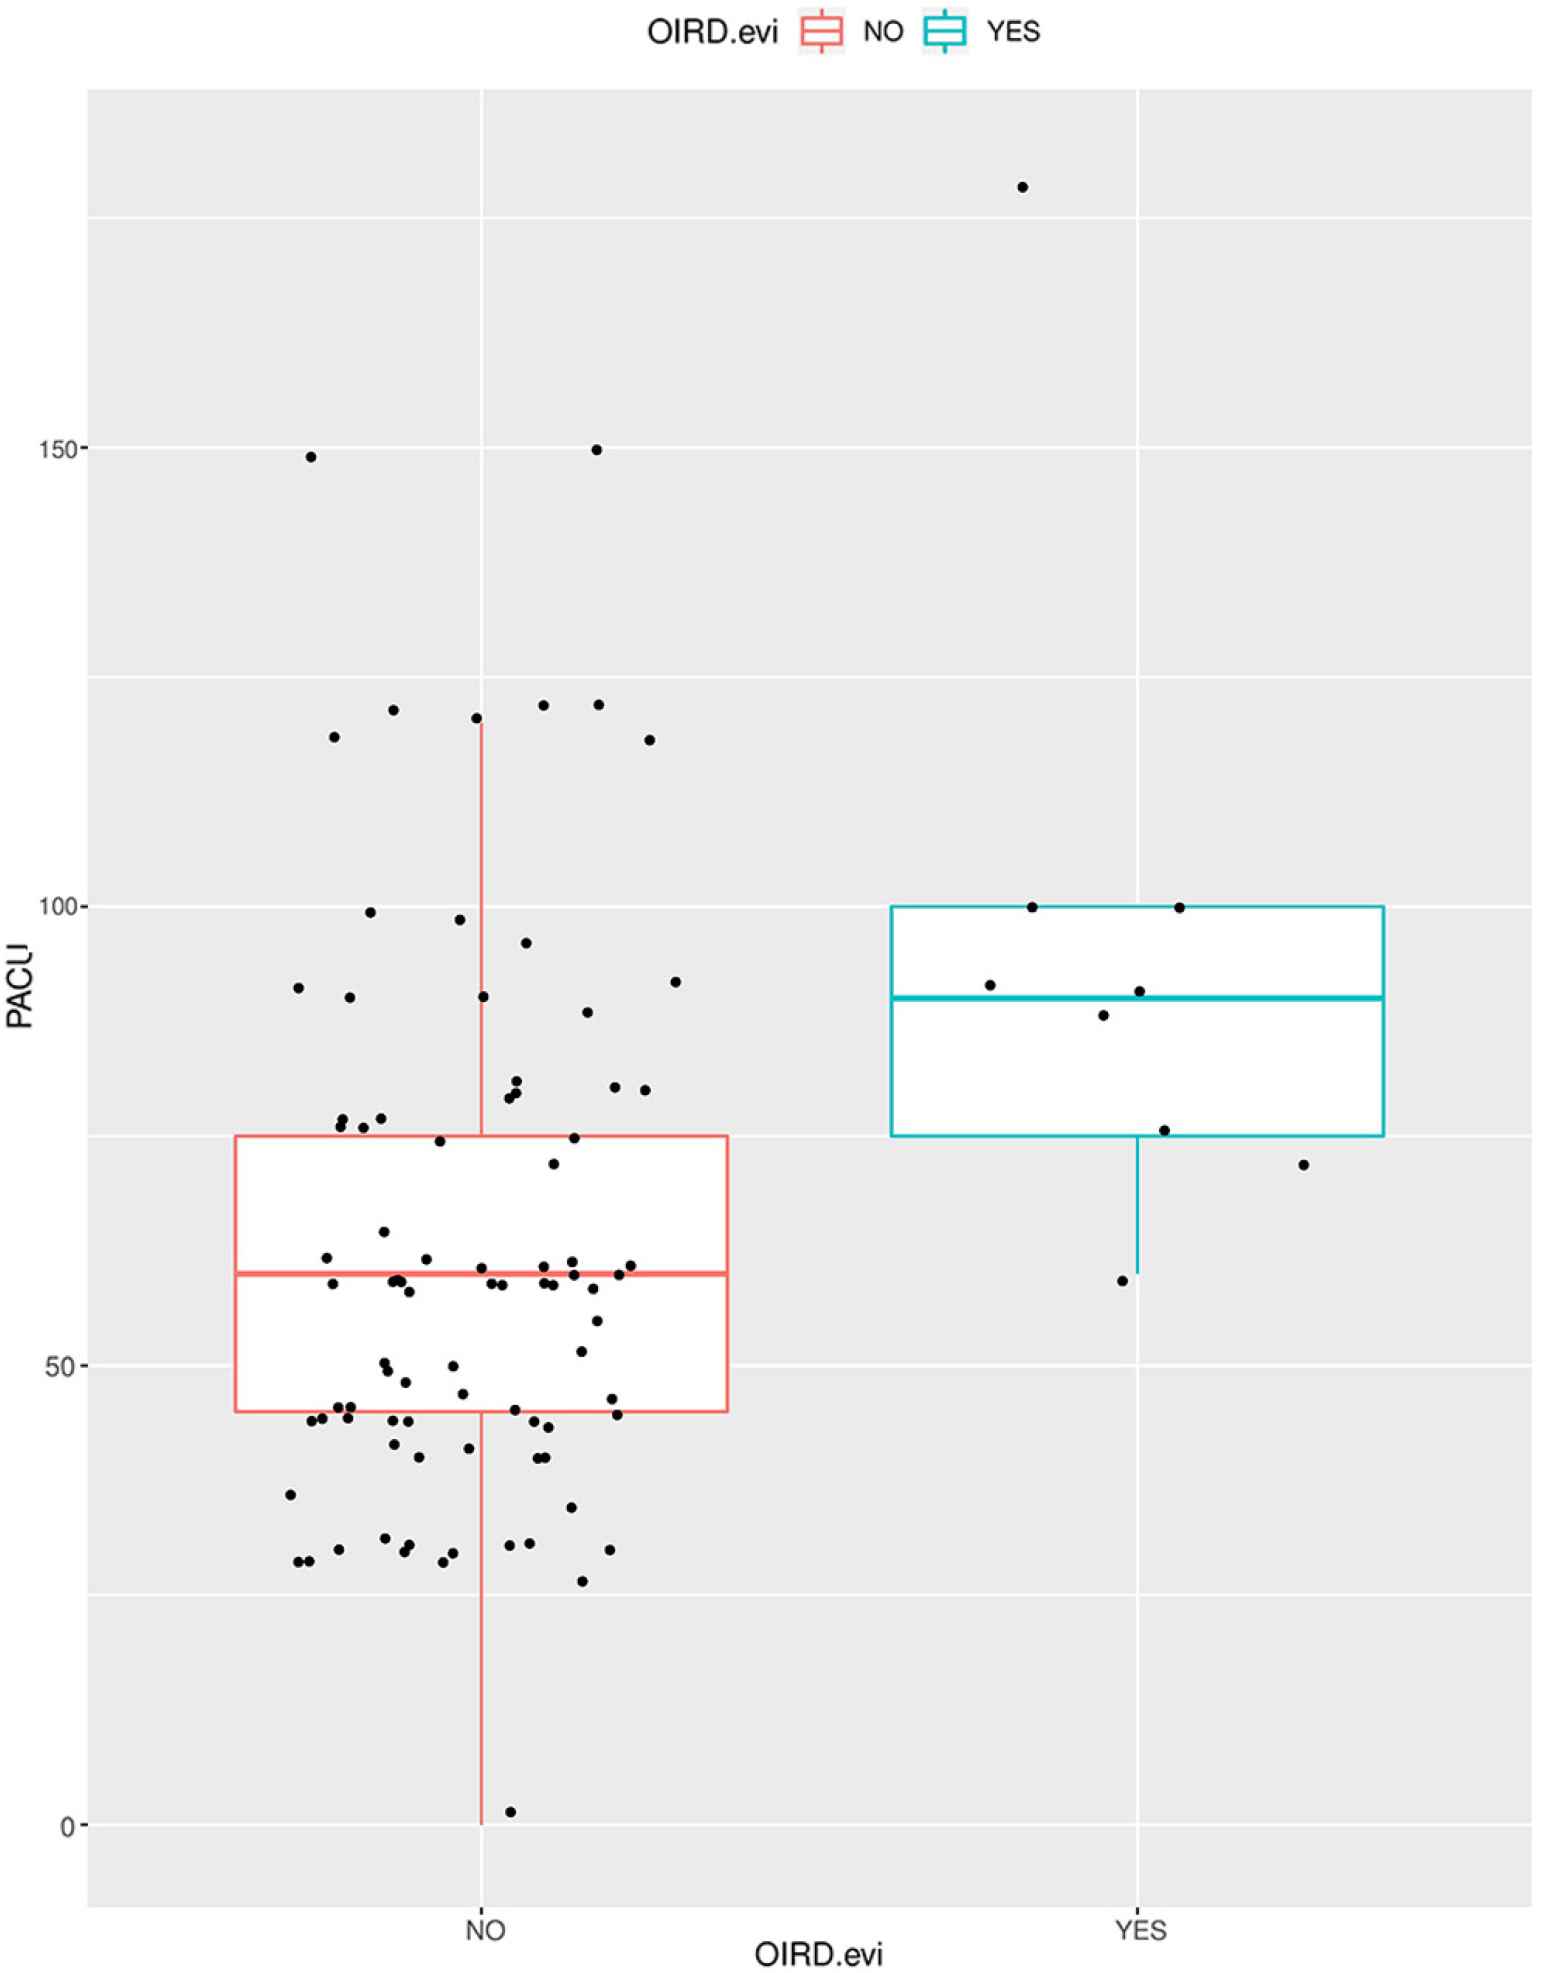
Length of stay in the Post-Anesthesia Care Unit (PACU) based on Opioid-induced respiratory depression (OIRD) diagnosis. Patients with evidence of OIRD stayed longer durations in the PACU.
Comparing participants diagnosed with OIRD to those who were not, those with OIRD received more airway maneuvers (p < 0.001), supplemental oxygen (p < 0.001), and total morphine equivalents (p = 0.024; Table 1). Those with OIRD were also more frequently administered naloxone (p < 0.001) and stayed longer in the PACU (p < 0.002; Figure 3 and Table 2).
| No OIRD diagnosis | OIRD diagnosis | Test statistic | Wald statistic | ||
|---|---|---|---|---|---|
| N = 86 | N = 9 | 1: Pearson test | |||
| 2: Wilcoxon test | |||||
| Weight (kg) | |||||
| N = 95 | F = 0.01 | P2 = 0.94 |
|
||
| Lower quartile range | 61 | 54 | |||
| Median | 70 | 66 | |||
| Upper quartile range | 80 | 95 | |||
| |
71 ± 14 | 72 ± 23 | |||
| American Society of Anesthesiologists status (I–XI) | χ2 = 1.8 | P1 = 0.41 | |||
| N = 95 | |||||
| I—Baseline | 0.16 (14) | 0.00 (0) | |||
| II—Mild | 0.50 (43) | 0.56 (5) | |||
| III—Severe | 0.34 (29) | 0.44 (4) | |||
| OIRD at risk (preoperative MV <80% of MVpred) | χ2 = 9 | P1 = 0.003 | |||
| N = 95 | |||||
| No | 0.79 (68) | 0.33 (3) | |||
| Yes | 0.21 (18) | 0.67 (6) | |||
| Respiratory volume monitor post | χ2 = 8.9 | P1 = 0.003 | |||
| N = 95 | |||||
| No | 0.52 (45) | 0.00 (0) | |||
| Yes | 0.48 (41) | 1.00 (9) | |||
| Total morphine equivalents | F = 5.3 | P2 = 0.024 | |||
| N = 94 | |||||
| Lower quartile range | 0.2 | 6 | |||
| Median | 5 | 10 | |||
| Upper quartile range | 14 | 20 | |||
| |
9 ± 14.5 | 13.7 ± 8.5 | |||
| Post-Anesthesia Care Unit duration (min) | F = 10 | P2 = 0.002 | |||
| N = 95 | |||||
| Lower quartile range | 45 | 75 | |||
| Median | 60 | 90 | |||
| Upper quartile range | 75 | 100 | |||
| |
62 ± 29 | 95 ± 35 | |||
| Naloxone administered | χ2 = 73 | P1 < 0.001 | |||
| N = 95 | |||||
| No | 0.99 (85) | 0.11 (1) | |||
| Yes | 0.01 (1) | 0.89 (8) | |||
| Airway maneuver required | χ2 = 31 | P1 < 0.001 | |||
| N = 95 | |||||
| No | 0.84 (72) | 0.00 (0) | |||
| Yes | 0.16 (14) | 1.00 (9) | |||
| O2 required | χ2 = 11 | P1 < 0.001 | |||
| N = 95 | |||||
| No | 0.58 (50) | 0.00 (0) | |||
| Yes | 0.42 (36) | 1.00 (9) | |||
| SpO2 | F = 0.11 | P2 = 0.74 | |||
| N = 95 | |||||
| Lower quartile range | 0.94 | 0.95 | |||
| Median | 0.95 | 0.96 | |||
| Upper quartile range | 0.97 | 0.97 | |||
| |
0.95 ± 0.02 | 0.95 ± 0.03 | |||
OIRD, opioid-induced respiratory depression; SD, standard deviation.
Postsurgery comparison based on OIRD diagnosis
Additionally, patients who received GA would be at a higher risk for developing OIRD due to the duel central nervous system depression primarily from GA and secondary from opioids [12,22]. Therefore, a secondary subgroup analysis was performed using only those patients that underwent GA. For this analysis, there were 27 participants in the RVM cohort and 11 participants in the SOC cohort. In this subgroup, OIRD was diagnosed in 9 of 27 participants in the RVM cohort (33%; 95% CI: 19%, 52%) and 0 of 11 participants in the SOC cohort (95% CI: 0%, 26%; Table 3). Consistent with the complete sample analysis, patients in the RVM group had significantly more frequent OIRD diagnoses (p = 0.028), longer PACU stay duration (p = 0.035), and more frequent administration of naloxone (p = 0.042) and supplemental oxygen (p = 0.007; Table 3). However, in this subgroup, there was insufficient evidence of a difference PACU stay duration (p = 0.260), frequency of airway maneuvers (p < 0.140), or admission status (p = 0.711; Table 3).
| Standard of care | Respiratory volume monitor | Test statistic | ||
|---|---|---|---|---|
| N = 11 | N = 27 | 1: Pearson test | ||
| 2: Wilcoxon test | ||||
| Opioid-induced respiratory depression diagnosis | χ2 = 4.8 | P1 = 0.028 | ||
| No | 1.00 (11) | 0.67 (18) | ||
| Yes | 0.00 (0) | 0.33 (9) | ||
| Post-Anesthesia Care Unit duration (min) | F = 1.3 | P2 = 0.26 | ||
| 25th Percentile | 52 | 60 | ||
| Median | 60 | 75 | ||
| 75% Percentile | 75 | 90 | ||
| |
65 ± 38 | 77 ± 30 | ||
| Naloxone administered | χ2 = 4.1 | P1 = 0.042 | ||
| No | 1.00 (11) | 0.70 (19) | ||
| Yes | 0.00 (0) | 0.3 (8) | ||
| Airway maneuver required | χ2 = 2.2 | P1 = 0.14 | ||
| No | 0.64 (7) | 0.37 (10) | ||
| Yes | 0.36 (4) | 0.63 (17) | ||
| O2 required | χ2 = 7.4 | P1 = 0.007 | ||
| No | 0.64 (7) | 0.19 (5) | ||
| Yes | 0.36 (4) | 0.81 (22) | ||
| Admission status | χ2 = 1.4 | P1 = 0.71 | ||
| Discharged | 0.09 (1) | 0.11 (3) | ||
| General ward | 0.55 (6) | 0.41 (11) | ||
| HDU | 0.27 (3) | 0.44 (12) | ||
| Intensive care unit | 0.09 (1) | 0.04 (1) | ||
HDU, High dependency unit.
General anesthesia–only analysis postsurgery comparison based on cohort
5. DISCUSSION
The study aimed to evaluate the feasibility of using novel monitoring techniques like the RVM in an austere setting, such as Kijabe Hospital, Kenya. This study demonstrates a difference in postoperative diagnostic results, indicating that respiratory monitoring may be improved using such technology. Additionally, the costs incurred for such monitors may be justified by the reduction of additional laboratory testing (such as arterial blood gas measurements), and maintenance is available free and available 24 h/day, 7 days per week via telephone and online help platforms.
Indicated by the results, 18% (95% CI: 10%, 31%) of participants in the RVM cohort were diagnosed with OIRD, while none were diagnosed in the SOC cohort. The estimated incidence of OIRD diagnosis under SOC and RVM is 0.00 (95% CI: 0.00, 0.08) and 0.18 (95% CI: 0.10, 0.31), respectively. The number needed to treat under RVM is 5.6 participants (95% CI: 3.2, 10.2). Additionally, although OIRD risk was somewhat greater in the RVM cohort despite randomization, 20% of participants in the SOC cohort were classified as at risk for OIRD; yet, there were still no OIRD diagnoses. This may indicate that some OIRD diagnoses were missed in the SOC cohort, and therefore, our results may present an underdiagnosis of OIRD. This may alternatively indicate that, despite randomization, there truly were no cases of OIRD in the SOC cohort.
An alternative explanation would be that the RVM monitoring could have been too sensitive to respiratory depression, indicating an overdiagnosis. Previous studies were using similar OIRD criteria as this study found an incidence of 5.6–22%, with an average rate of 11.5% [23]. Our incidence of 18% is above average, but not outside of the previously indicated range. If RVM monitoring were to overdiagnosis OIRD, this may limit the benefits by adding costs of care and extended stay for the patient. Considering the data presented in the study and previous work, we would hypothesize that the SOC cohort being under diagnosis, rather than the RVM cohort being overdiagnosed.
One possible explanation for this underdiagnosis may be that in the SOC cohort, it was challenging to differentiate between hypoventilation and OIRD diagnosis in the absence of quantitative data. For example, qualitative measuring of a postoperative patient breathing at a below average rate would be classified as hypoventilation. However, if the patient were to manifest signs of hypercarbia (no definitive qualitative test), the patient would meet diagnostic criteria for OIRD and should be treated with naloxone. With this challenge, an SOC patient may be classified as hypoventilating, yet not diagnosed with OIRD due to a lack of quantitative data. Furthermore, the elevated CO2 levels can lead to acidemia, which may lead to dysrhythmia. This dysrhythmia may not be detected given available electrocardiogram monitoring equipment, unreliable equipment (minimally functional equipment often gets donated [24]), and high patient to nurse ratios. By implementing RVM in clinical practice, the early indications of postoperative complications, such as OIRD, may be identified at a higher rate possibly resulting in appropriate treatment and improved patient outcomes.
Furthermore, the need for additional testing incurs additional costs and time for both the patient and hospital. Hypoventilation and acidemia are frequently assessed via arterial blood gas testing and may lead to dysrhythmia and electrolyte imbalance and right heart failure from pulmonary hypertension. This additional testing may not be required due to the real-time data of the RVM. This observation also contributes a possible financial benefit of increasing the amount of quantitative data that is available to providers by lowering the amount of additional testing.
An additional challenge of RVM use is that CO2 monitoring requires a unimodal burden on visual attention, which may be tedious to a provider trying to monitor multiple patients and vital signs, especially with high patient to nurse ratios. Regardless of how well a visual display may be, visual attention will be limited by a high number of patients and tasks. Development of a combined visual and auditory display for ventilation in devices such as the RVM and pulse oximeters may alleviate this strain. Ideally, this multisensory display would be present before the need of a warning alarm, notifying a dangerous change in vital signs and communicating continuous monitoring.
As mentioned in the Introduction section, there is a lack of cohesiveness within the literature surrounding the effect of anesthesia on respiratory mechanics. While OIRD is understood to be a decrease in RR, this definition only favors continuous, qualitative assessment without accounting for TV. In hospital units such as the PACU, respiratory monitoring via qualitative observations may not provide a sufficient level of care. Along with the suggestions in this paper in favor of quantitative RVM, the literature should also agree upon a stricter and clearer definition of conditions such as OIRD.
6. LIMITATIONS
This study was limited by the fact that it was unfunded and a first in kind at Kijabe Hospital. Therefore, dedicated research nurses were not available to record the interaction time of PACU nurses with participants. It is possible that a novel monitor may increase the time and attention the PACU personnel dedicated to these participants, which could explain the increased rates of OIRD detection. Additionally, Kenyan patients tend to be healthier than western patients (e.g., lower rates of hypertension, coronary artery disease, diabetes mellitus). While we do not believe this statistic to have a significant effect on our data, it is an important consideration when translating our data into diverse populations. Finally, regardless of our results, this is not a direct suggestion for hospitals to specifically invest in the ExSpiron RVM.
7. CONCLUSION
Our evaluation of using a noninvasive RVM in an austere hospital setting indicated an increase in data available to assist respiratory monitoring and patient diagnosis. The RVM provided quantitative data to be used by providers for their consideration of a postoperative complication diagnosis. Specifically, our results showed a higher rate of OIRD diagnosis in the RVM group. The SOC cohort may have had fewer diagnoses of OIRD due to the challenging task of distinguishing hypoventilation versus OIRD. Therefore, the difference in respiratory monitoring via the noninvasive, quantitative RVM may be the benefit of subtle diagnoses and intervention. The benefit to subtle diagnoses is specifically significant for LMIC where overall care is improving, through the generous work of donations, charitable groups, and missionary clinicians, and therefore, healthcare needs to now be more sensitive to decreasing morbidity, rather than just mortality.
More work must be done with the goals of developing clear diagnostic criteria for OIRD; a cost-effective, quantitative ventilation monitor for non-intubated patients; and an auditory display for ventilation devices (such as the RVM and pulse oximeter) with continuous monitoring to signal a maladaptive change before a warning alarm or need for intervention. Opportunities to implement proactive care into hospital workflows may improve patient care, monitoring, and safety.
CONFLICTS OF INTEREST
The authors declare they have no conflicts of interest.
AUTHORS’ CONTRIBUTION
KJB, MST and JJS contributed to literature search. KJB, XSF and MSS contributed in the analysis of data. KJB, MSS and JJS contributed in manuscript preparation. MST and JJS designed the study. MST and JJS contributed in data collection. KJB, XSF, MSS and JJS reviewed the manuscript.
ACKNOWLEDGMENTS
The research team observed that no documented research has been done previously on opioid-related respiratory depression in Kijabe Hospital. Great appreciation to Francis Njenga, Lilian Theuri, and Sarah Nyaga Peris Mukera for their sincere dedication, support, and sacrifice in all the phases of doing this research. Technical support and assistance from Dr. Mark Newton, Mary Mungai, and Gabriel Okombo are also highly appreciated. Finally, the authors thank Jenny Freeman and Respiratory Motion for the donation of two RVM monitors.
SUPPLEMENTARY MATERIALS
Supplementary data related to this article can be found at
Footnotes
Data availability statement: All data are available at https://osf.io/4wyxa/.
REFERENCES
Cite this article
TY  - JOUR
AU  - Kendall J. Burdick
AU  - Muchai Stephen Thuo
AU  - Xiaoke Sarah Feng
AU  - Matthew S. Shotwell
AU  - Joseph J. Schlesinger
PY  - 2020
DA  - 2020/02/21
TI  - Evaluation of Noninvasive Respiratory Volume Monitoring in the PACU of a Low Resource Kenyan Hospital
JO  - Journal of Epidemiology and Global Health
SP  - 236
EP  - 243
VL  - 10
IS  - 3
SN  - 2210-6014
UR  - https://doi.org/10.2991/jegh.k.200203.001
DO  - 10.2991/jegh.k.200203.001
ID  - Burdick2020
ER  -