
Body shape dissatisfaction is a ‘normative discontent’ in a young-adult Nigerian population: A study of prevalence and effects on health-related quality of life
- DOI
- 10.1016/j.jegh.2015.07.003How to use a DOI?
- Keywords
- Body-shape dissatisfaction; Weight preference; Weight misperception
- Abstract
This study investigates the prevalence of weight misperception, weight preference, and body shape dissatisfaction (BSD) among young-adult Nigerians and assesses the impact of these factors on population quality-of-life (QOL). Relevant anthropometric data were collected according to internationally accepted protocols. Weight perception, weight preference, and BSD were measured using Stunkard silhouettes, while QOL was determined by subjective self-reporting. The results show that 26.7% of the population (18.8% for males and 34.5% for females) misperceived their weight. Among overweight participants, 56.6% (males) and 38.3% (females) thought they were thinner, while 11.5% (males) and 43.3% (females) thought they were heavier. Thin and obese males misperceived their weights more than their female counterparts. BSD was found in 62% of the population (52% for males and 71% for females) and was highest among obese participants (91.9%) and lowest among normal-weight participants (58.2%), irrespective of sex. In participants with BSD, QOL was worse in thin and normal-weight respondents who preferred to be heavier and in overweight respondents who preferred to be thinner. The high prevalence of weight misperception may lead to inappropriate weight loss habits, while BSD, a normative discontent in this population, negatively impacts subject QOL.
- Copyright
- © 2015 Ministry of Health, Saudi Arabia. Published by Elsevier Ltd.
- Open Access
- This is an open access article under the CC BY-NC-ND license (http://creativecommons.org/licenses/by-nc-nd/4.0/).
1. Introduction
Obesity, thought to be problematic for only economically advanced countries, is currently a global public health problem with prevalence data indicating that low- and middle-income countries (LMICs) have burdens that equal or sometimes exceed those of economically advanced countries [1]. In Nigeria, for example, a World Health Organization estimate reports the prevalence of overweight/obese individuals was 29% and 45.1% in men and women, respectively [2]. In a young-adult Nigerian population, a recent study reported a prevalence of 28.4% and 20.7% for overweight/obese individuals, respectively, using bioelectrical impedance analysis and body mass index (BMI) methods [3]. There is a need for appropriate health-protective weight management practices development and adoption for populations at risk or those already burdened by obesity.
Two likely impediments to health-protective weight management practices among target populations are weight misperception and wrong weight preference leading to body-shape dissatisfaction (BSD). These factors result in individuals attempting to lose, gain, or maintain weight, as the case may be, often with deleterious consequences [4]. Weight misperception and BSD vary by sex. Females often desire to be thin, resulting in BSD, while in males, the distribution of body weight rather than aggregate weight, causes BSD [5]. Weight preference and BSD, ordinarily culturally driven, are currently driven by mass media emphasis on weight loss, portraying (often through advertising) slim ladies and muscular men as beauty standards. What is worrisome is that while obesity may result in a number of somatic diseases [6], its impact on the psycho-social well-being of the individual [7] may be driven by weight misperception and BSD. In fact, BSD is known to result in eating disorders and depression [8] and is so widespread in the general population that it has been referred to as a “normative discontent” [9]. BMI-classified overweight/obese individuals are more likely to underestimate their weight, while those who correctly estimate their weight are more likely to desire and attempt weight loss [4,10]. Implicit in this is the importance of proper weight perception.
Although there are reports on weight misperception, weight preference, and BSD from many parts of the world [4–6,11,12[ there are no reports on these concepts among Nigerians. With the rising prevalence of obesity in LMICs, including Nigeria, and the known deleterious consequences of obesity on both somatic and psychosocial health, it is important to investigate the prevalence of weight misperception, weight preference, and BSD among Nigerians and to assess the impact of these factors on population quality of life (QOL). Given the need for proper weight perception in tackling obesity and that a lack thereof could lead to a reduced QOL, which in turn negatively impacts productivity and is inimical to economic advancement, understanding these factors is important to developing countries, such as Nigeria. Such knowledge would help in formulating policies to ensure that the majority of the population, specifically the labour force, is healthy. This study attempts to fill the aforementioned vacuum and its results are expected to be useful in public health research, policy formulation, and action.
2. Methods
2.1. Participants
Students of Michael Okpara University of Agriculture, Umudike, Abia State, Nigeria, were randomly selected for this study. The purpose and rationale of the study was explained to them and those providing informed consent recruited if they met the inclusion criteria. Exclusion criteria included apparent ill-health, use of weight-loss medication, being a current cigarette smoker, drinking alcoholic beverages in excess of four 600 mL bottles/week, history of or present substance abuse, and pregnancy. These conditions were assessed by self-reporting. A total of 2380 students were screened and 84% (2000) of them (50% females; mean age, 21.7 ± 2.6 years; mean BMI, 22.6 ± 2.9 kg/m2) meeting the inclusion criteria were recruited. No honorarium was paid to participants, however, the students were offered health education based on their nutritional status as determined by the study.
2.2. Methods
BSD was measured using the Stunkard scale [13], consisting of visual figures representing nine gender-specific body-shape silhouettes ranging from very thin (assigned a value of 1) to very big (assigned a value of 9) (Fig. 1). The scale is valid for use in epidemiological studies, has adequate test–retest reliability [12,14], and has been validated in a West African population [15]. Respondents were asked to choose from the nine body shapes which silhouette best represented their “current shape” and then their “preferred shape”. The difference between perceived body shape and preferred body shape was used to determine the degree of BSD. Based on these results, participants were then classified into three groups: (1) satisfied with current body shape (current = preferred), (2) desired to be thinner (current > preferred), and (3) desired to be heavier (current < preferred). Likewise, weight misperception was diagnosed if there was variation between subject choice of “current weight” and their measured weight status. Based on this, participants were again classified into three groups: (1) correct weight perception (current = measured), (2) thought to be thinner (current < measured), and (3) thought to be heavier (current > measured).
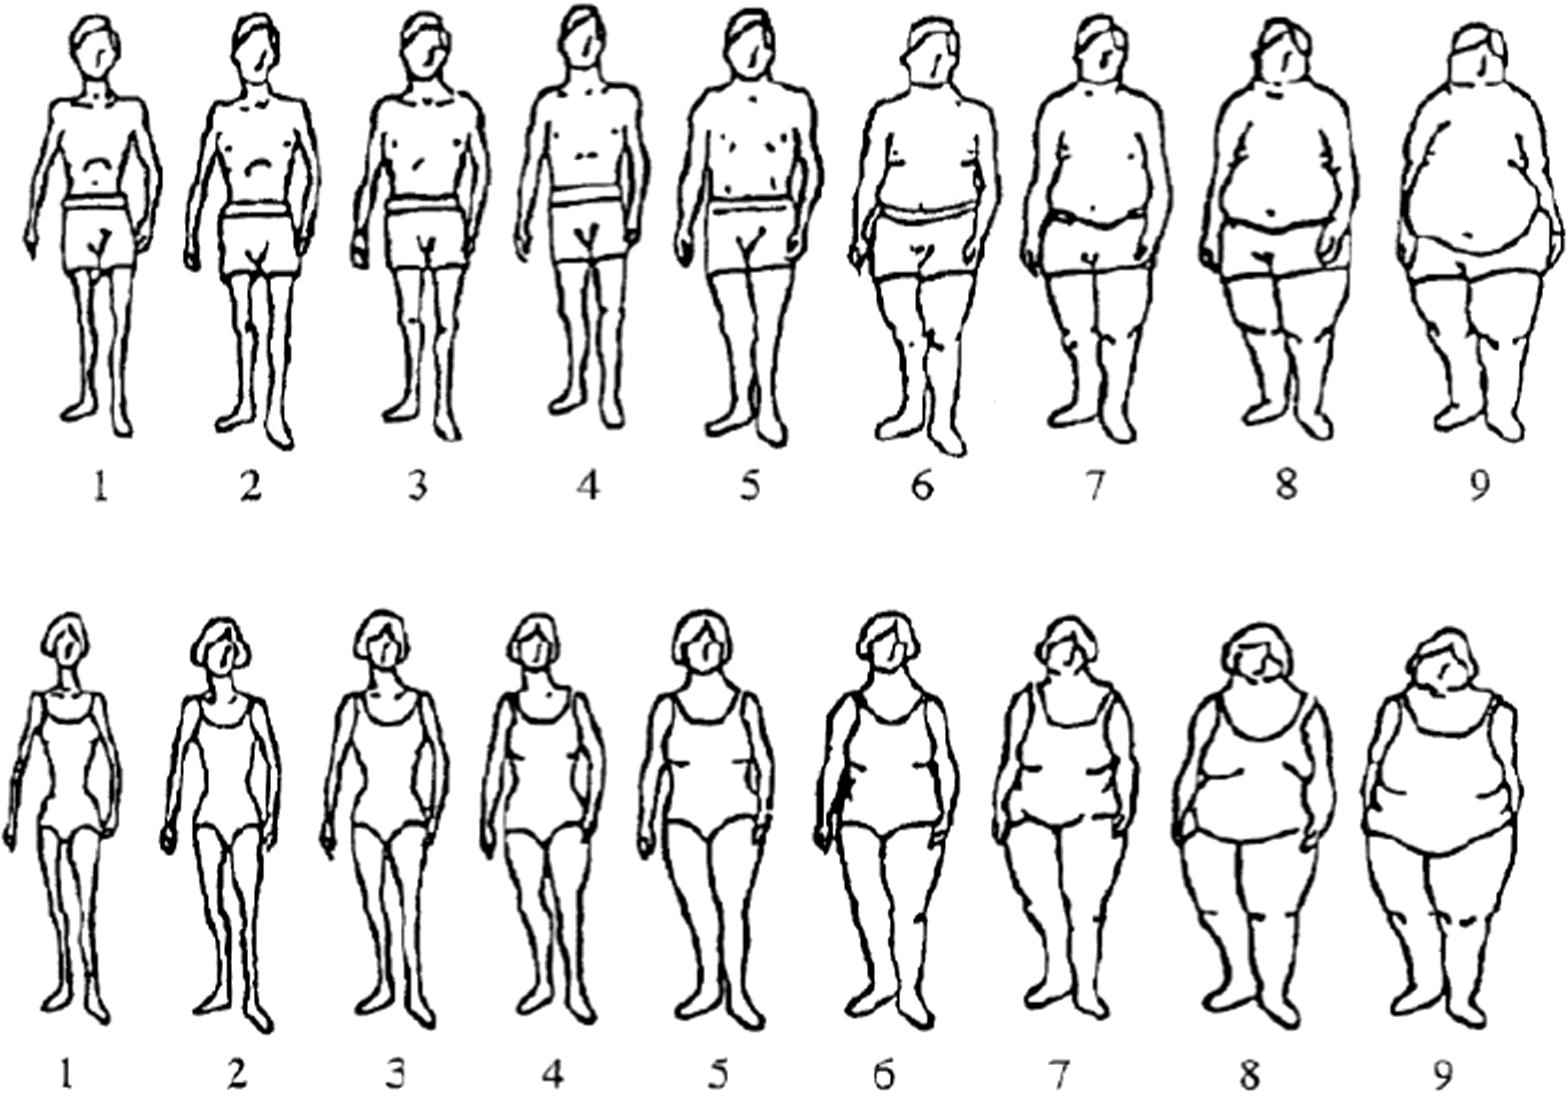
The Stunkard scale of gender-specific body-shape silhouettes.
Age for each participant was recorded. An improvised stadiometer was used to measure height (standing on bare feet) to the nearest 0.1 cm. Weight was measured to the nearest 0.1 kg using a digital-display bathroom scale, with the participant dressed in light clothing without shoes or sandals. Scales were calibrated each morning using known weights and following the manufacturer’s instructions. All measurements were collected by the same personnel. From the height and weight measurement data, BMI for each person was calculated as: BMI = weight (kg)/[height (m)]2. Participants with 30 > BMI ⩾ 25 were classified as overweight, while those with BMI ⩾ 30 were classified as obese. Normal weight therefore is a BMI >18 but <25.
Assessment of QOL was accomplished based on answering a single question: If you were to spend the rest of your life with your weight status just the way it is now, how would you feel about that? Response options ranged from 0 to 6, denoting “delighted” to “terrible”.
2.3. Statistical analysis
Descriptive statistical analysis was done on the data generated. Continuous data are reported as means ± standard deviations, while categorical data are presented as percentages. Differences between means were separated by a one-way analysis of variance for continuous variables, with the significance threshold was fixed at p < 0.05. Data analyses were undertaken using IBM-SPSS version 20.0 (IBM Corp., Atlanta, GA, USA).
3. Results
Weight misperception was found in 26.7% (18.8% for males and 34.5% for females) of the general population. A greater proportion of thin and obese males misperceived their weights relative to their female counterparts. Conversely, a greater proportion of normal-weight and overweight females misperceived their weights relative to their male counterparts. Irrespective of sex, normal-weight and obese participants misperceived their weight least often, while overweight participants misperceived their weight most often (Fig. 2). All thin participants who misperceived their weight thought they were heavier. Conversely, all obese participants who misperceived their weight thought they were thinner. Among overweight participants, 56.6% of the males and 38.3% of the females thought they were thinner, while 11.5% of the males and 43.3% of the females thought they were heavier (Fig. 3).
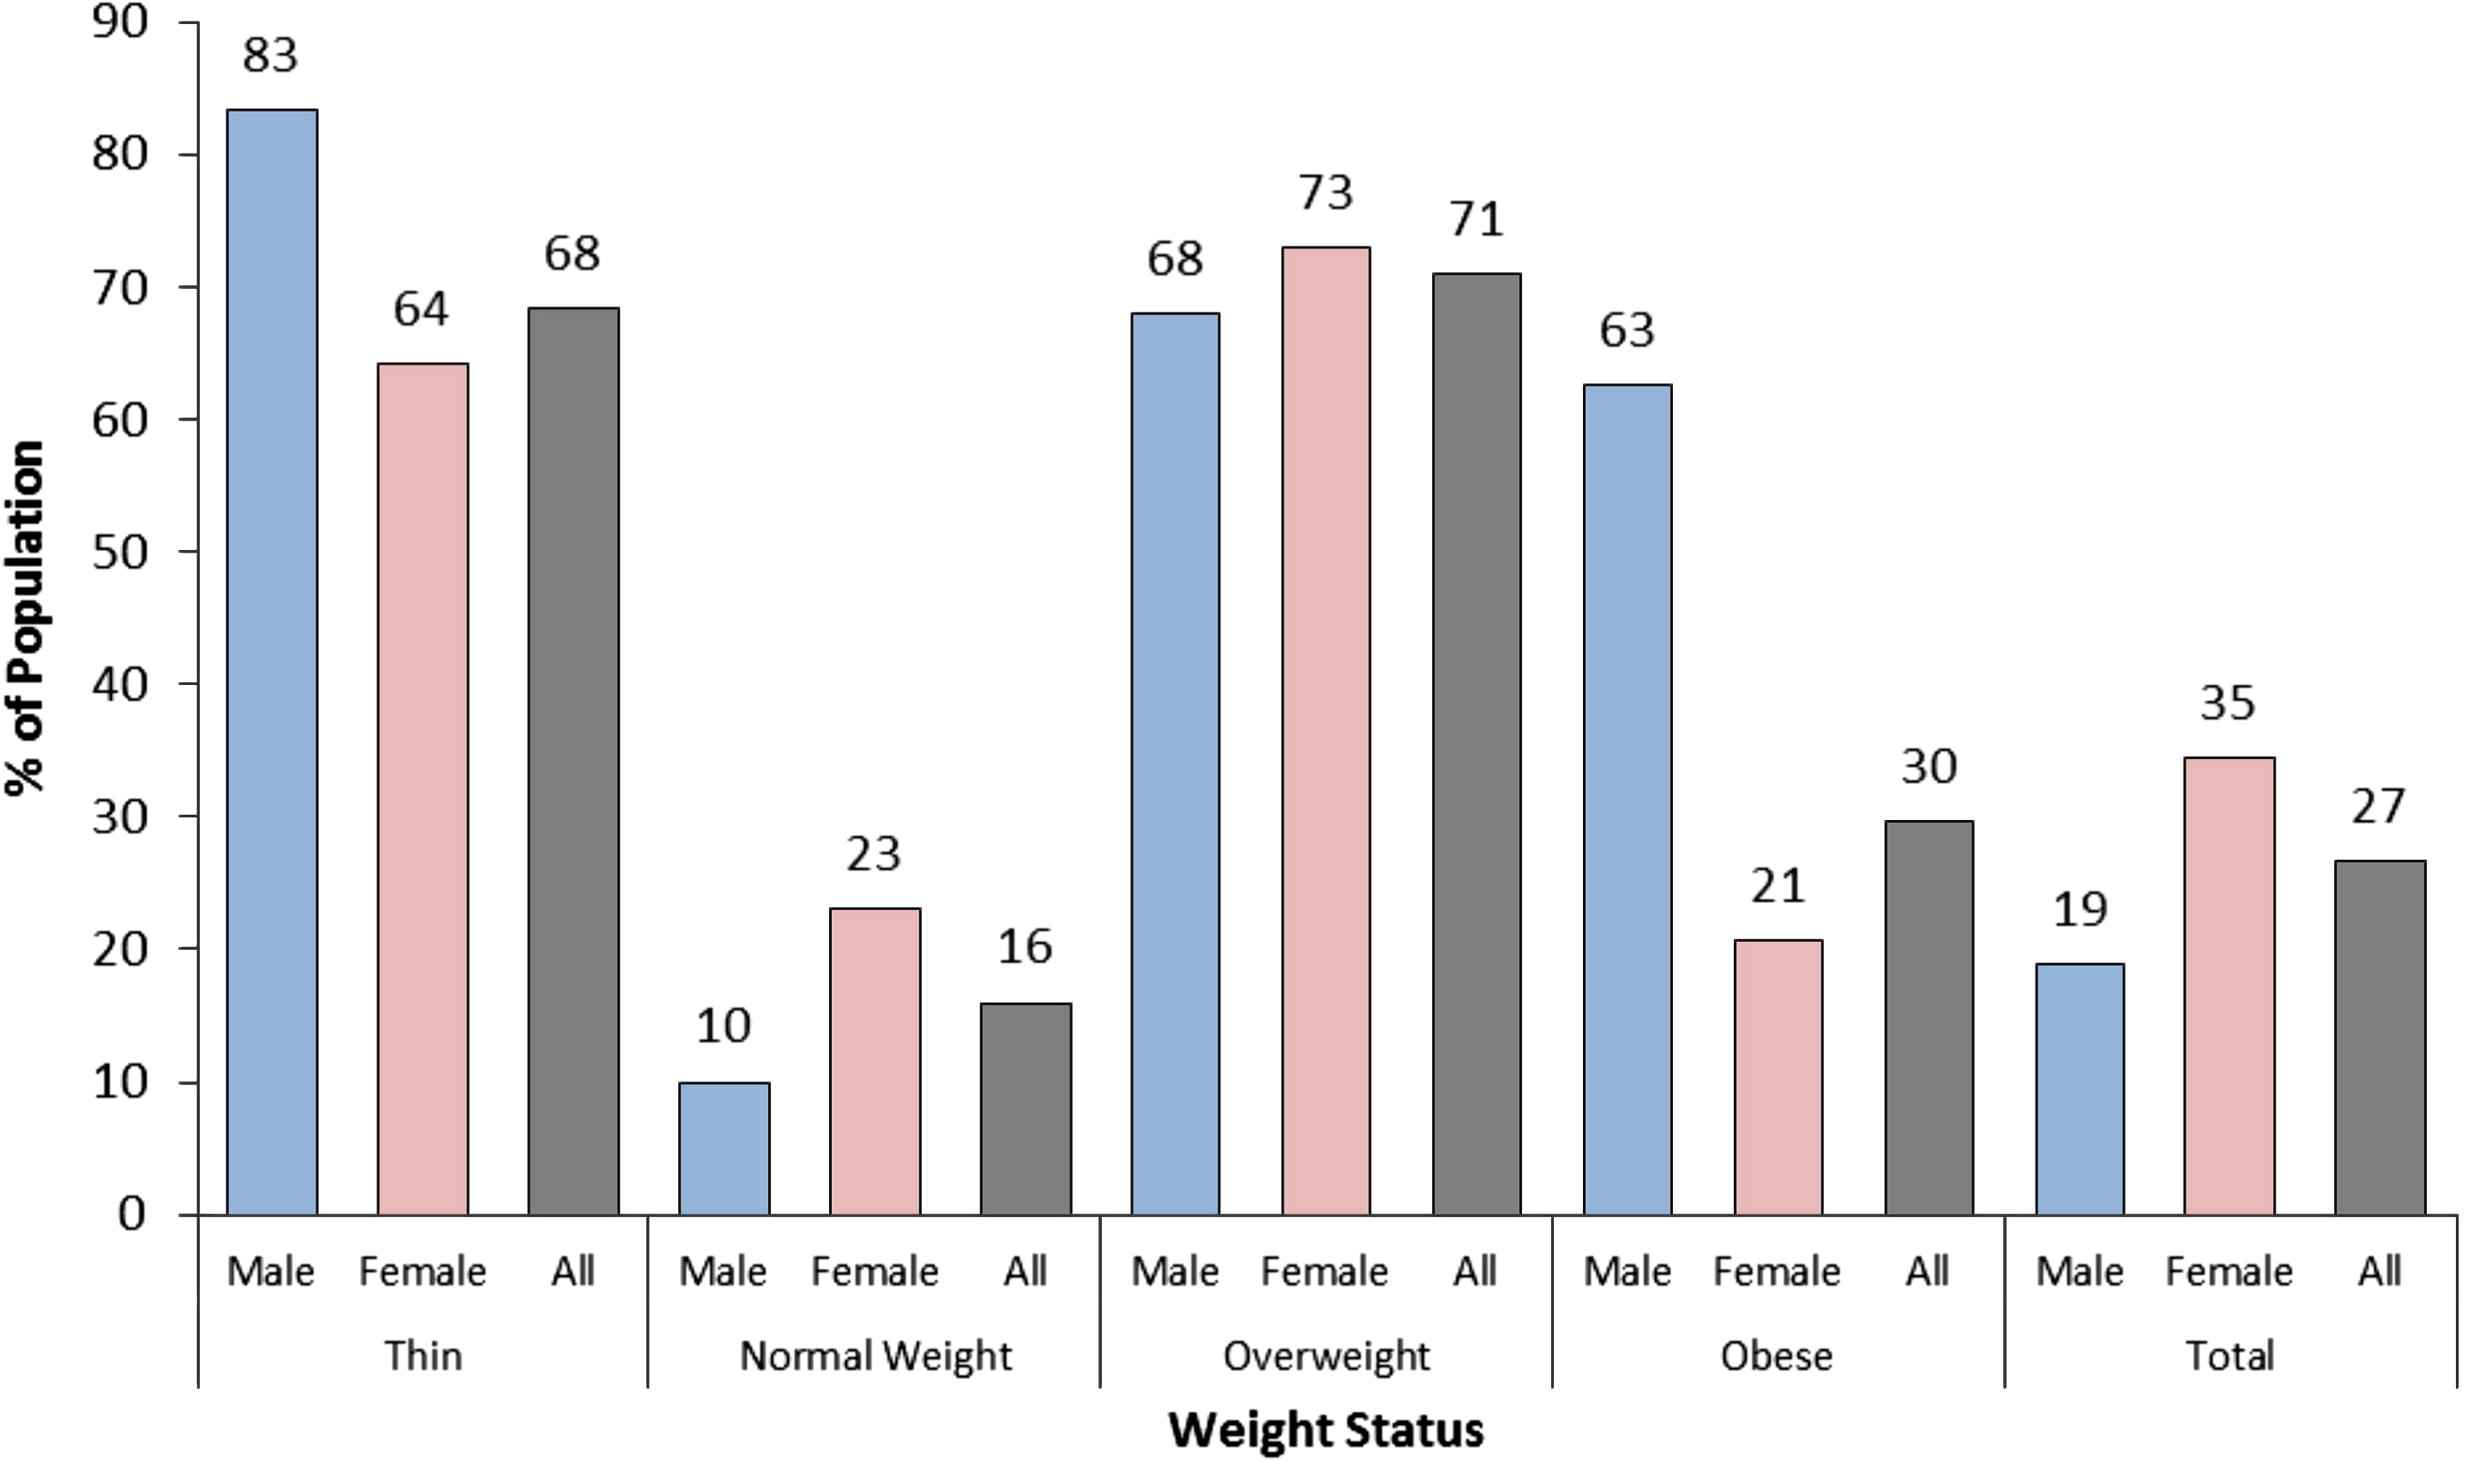
Prevalence of weight misperception in the population, stratified by body mass index-defined weight status.
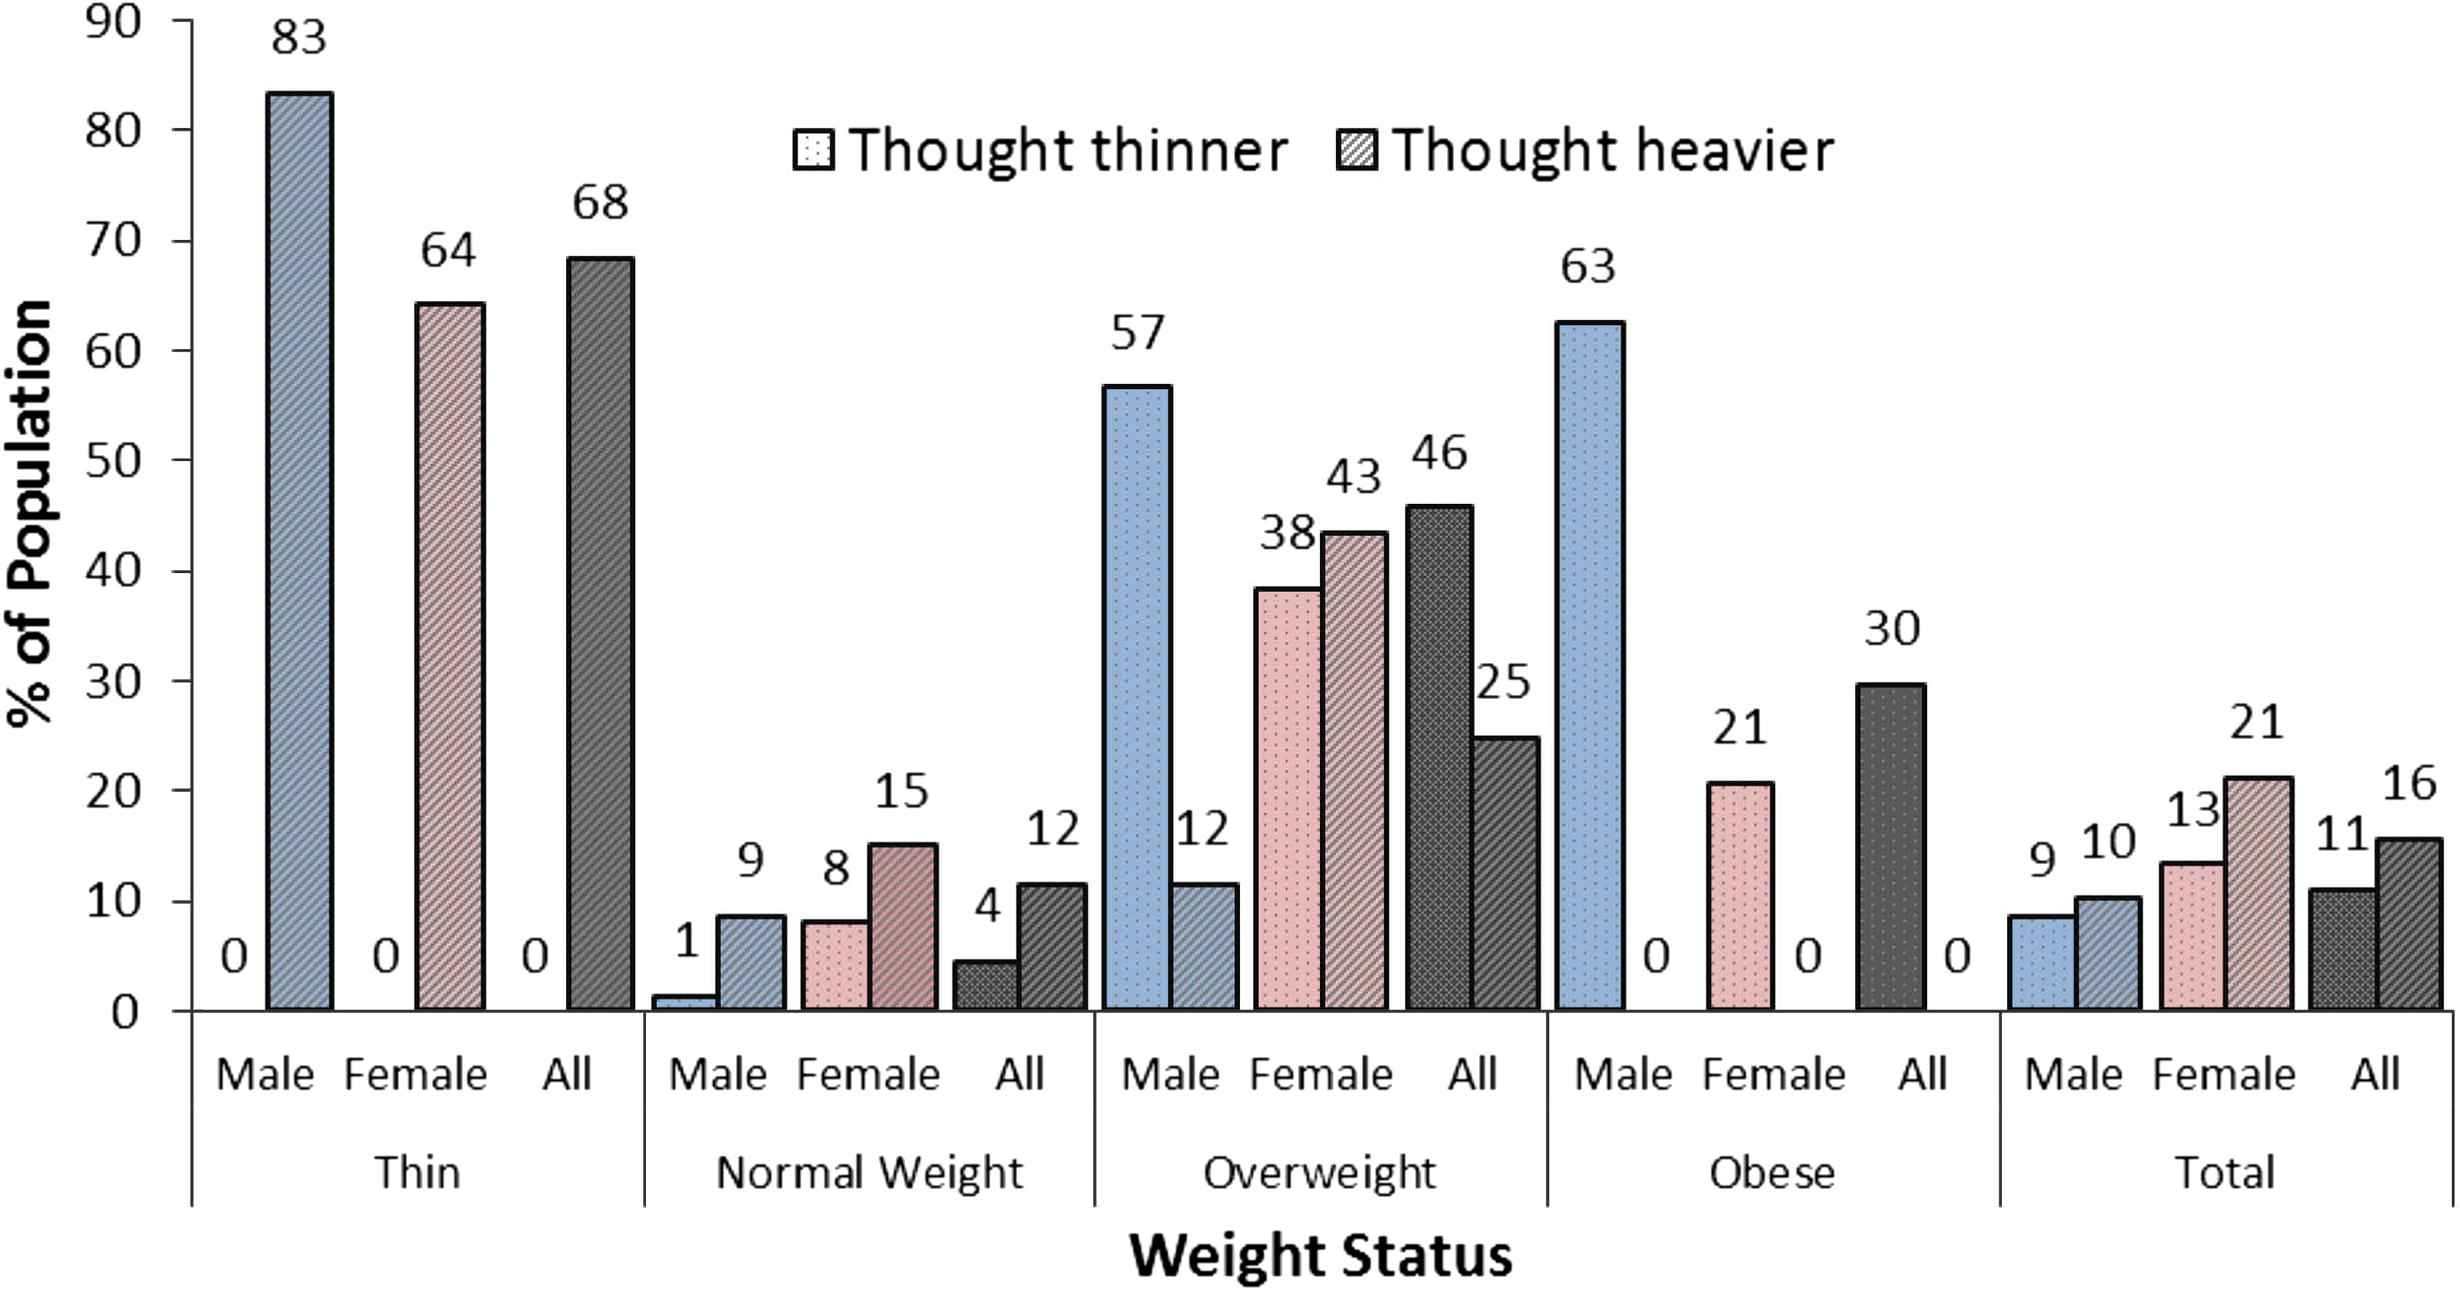
Type of weight misperception in the population, stratified based on weight status defined by body mass index.
Irrespective of weight status, more than half the study population was dissatisfied with their body shape. For example, among normal-weight participants, 50.1% of the males and 67.6% of the females had BSD. Again, irrespective of weight/nutritional status, a greater proportion of females had BSD as compared to males. Body-shape dissatisfaction was highest among obese participants (91.9%) and lowest among normal-weight participants (58.2%), irrespective of sex (Fig. 4). Among thin participants with BSD, 61.1% of the males preferred to be thinner, while 5.6% preferred to be heavier. For females, only 3.1% wanted to be thinner and 82.6% wanted to be heavier. As much as 62.5% of obese males with BSD preferred to be heavier as compared with only 6.9% of obese females who preferred to be heavier. Irrespective of sex, a greater proportion of normal-weight participants preferred to be thinner, while a greater proportion of overweight participants preferred to be heavier (Fig. 5).
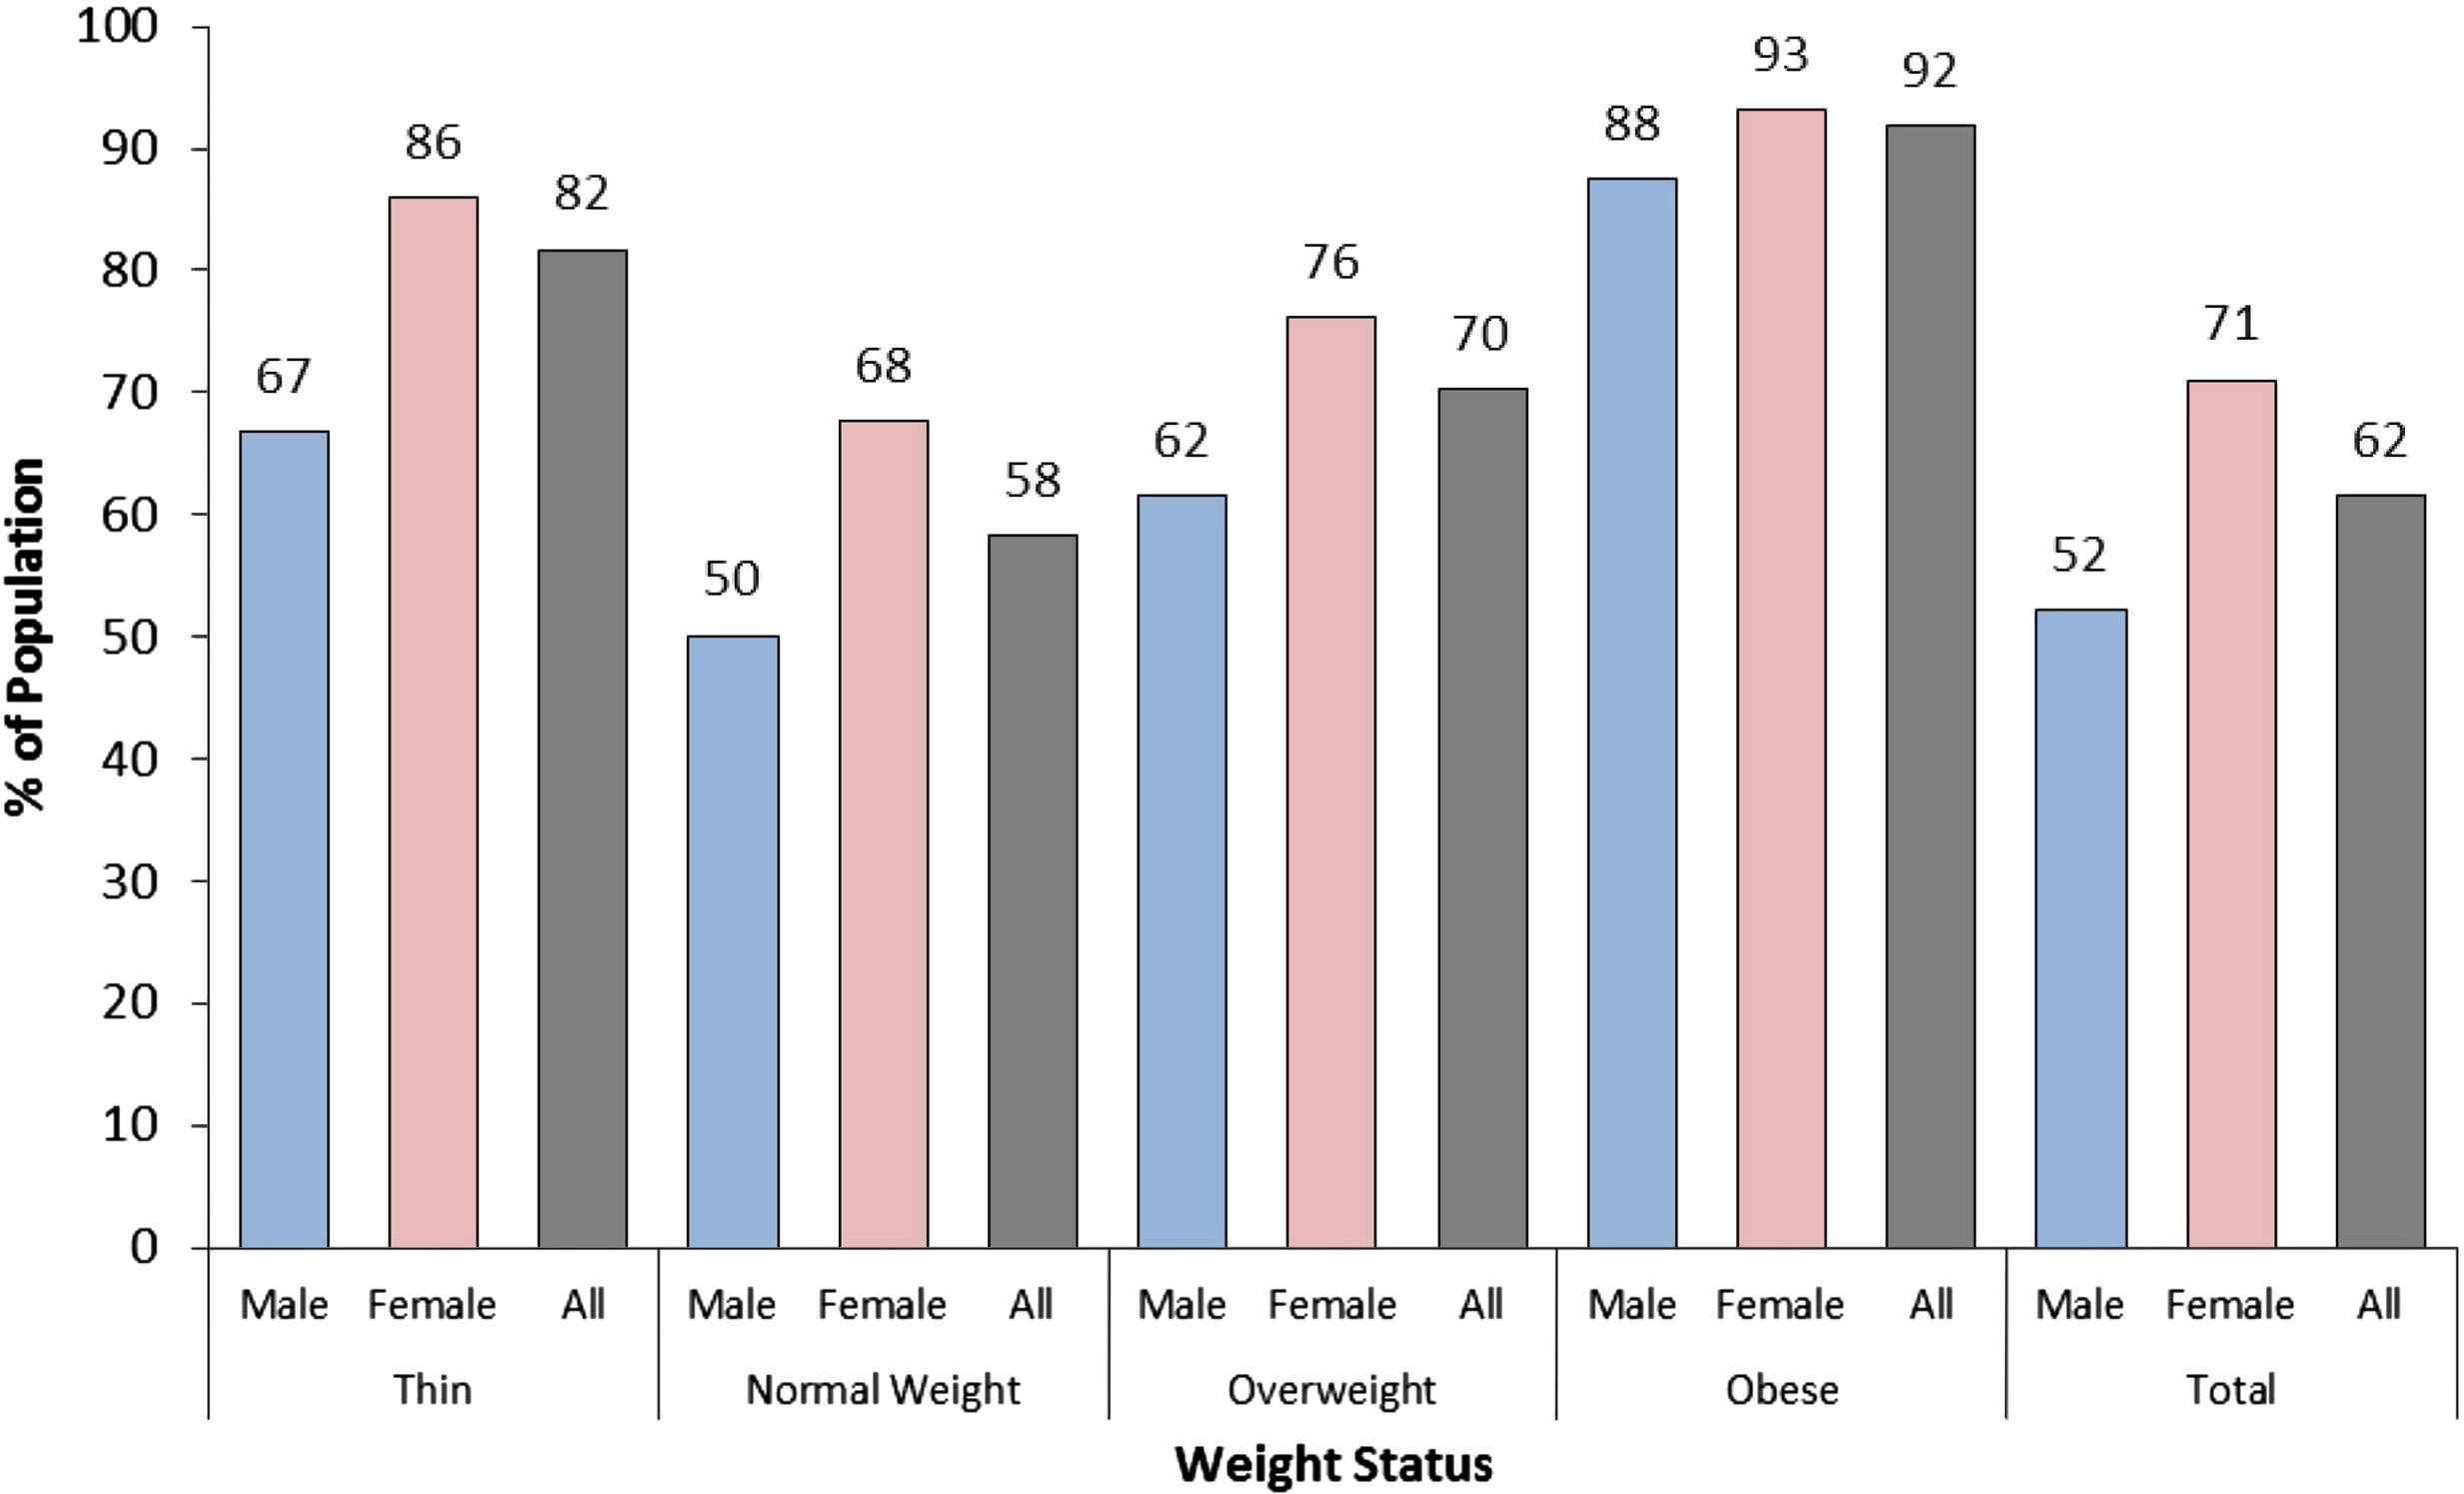
Prevalence of body-shape dissatisfaction in the population, stratified by body mass index-defined weight status.
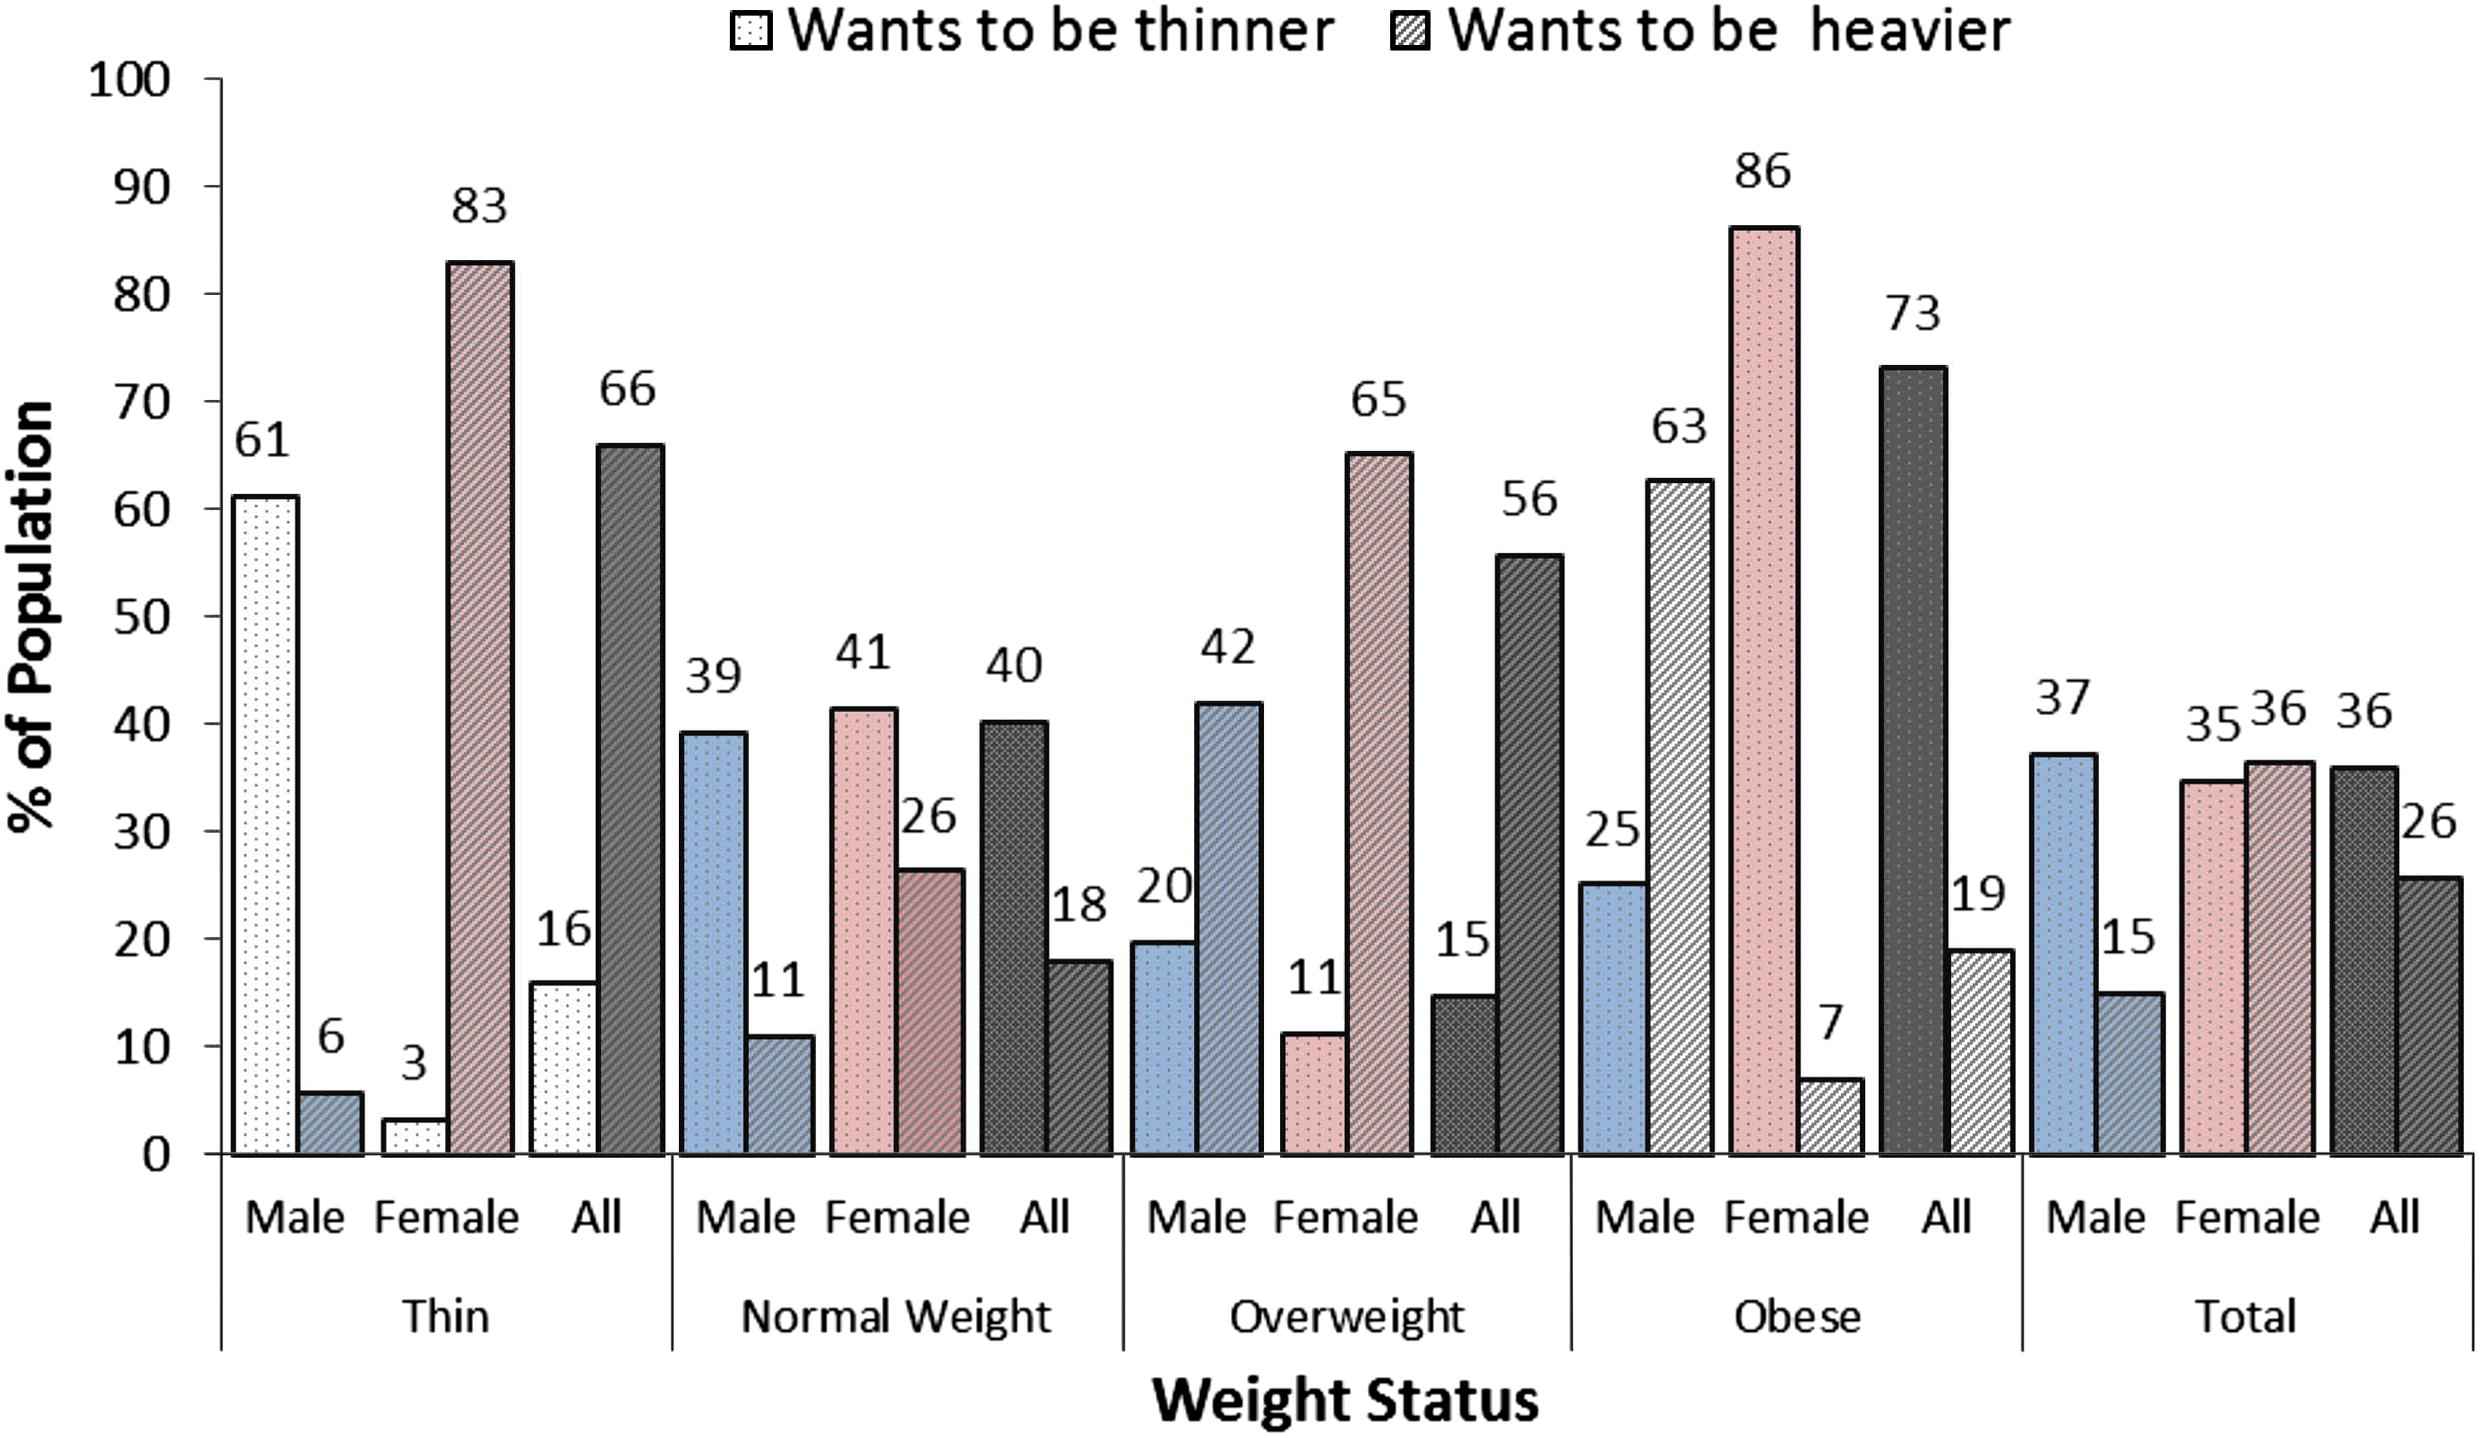
Type of body-shape dissatisfaction (weight preference) in the population, stratified based on weight status defined by body mass index.
Subject QOL scores was significantly higher (p < 0.05) in thin and normal-weight participants with BSD who preferred to be heavier as compared with their sex-matched counterparts. Conversely, in overweight participants with BSD who preferred to be thinner, QOL scores were significantly higher as compared with their sex-matched counterparts (Table 1). Although the QOL scores of obese participants were higher than those of their sex-matched counterparts, the differences were not statistically significant (p > 0.05).
| Quality of life | ||||||
|---|---|---|---|---|---|---|
| SBS | DBS (prefers to be heavier) | DBS (prefers to be thinner) | ||||
| Male | Female | Male | Female | Male | Female | |
| Thin | 1.8 ± 0.8 | 1.6 ± 1.4 | 3.4 ± 2.1 | 2.9 ± 1.5 | 3.0 ± 0.0 | 1.0 ± 0.0 |
| p | 0.038 | 0.016 | 0.635 | |||
| Normal weight | 1.8 ± 1.3 | 1.5 ± 1.0 | 2.1 ± 1.5 | 2.0 ± 1.3 | 2.1 ± 1.2 | 1.6 ± 1.2 |
| p | 0.001 | <0.001 | 0.035 | 0.271 | ||
| Overweight | 1.6 ± 1.0 | 1.8 ± 1.1 | 2.0 ± 1.2 | 2.1 ± 1.1 | 2.5 ± 1.5 | 2.8 ± 1.6 |
| p | 0.322 | 0.539 | 0.001 | <0.001 | ||
| Obese | 1.00 ± 0.0 | 1.5 ± 0.7 | 2.5 ± 0.7 | 3.5 ± 2.1 | 2.8 ± 1.3 | 3.0 ± 1.5 |
| p | 0.188 | 0.180 | ||||
DBS = dissatisfied body shape; SBS = satisfied body shape.
Quality of life scores of respondents stratified by nature of body-shape dissatisfaction.
4. Discussion
This study was conducted among university students largely because the university population is a convenient sample for young-adult health studies [16,17]. Owing to the rising prevalence of obesity in Nigeria [3] and that a potential barrier to appropriate health-protective weight management practices in populations at risk of obesity is weight misperception and BSD, these concepts were studied in young-adult Nigerians. This population was chosen based on its being least affected by cultural practices and most affected by media and globalization.
Early adulthood is the period when young adults (females, in particular) are concerned with choosing a partner and starting a family. Therefore, young people pay particular attention to attractiveness and compare themselves to others. Unfortunately, young women tend to compare themselves, sometimes to their detriment, with models and actresses shown in the media. Studies indicate that viewing television programs featuring young and very slim actresses contributes to weight misperception [18]. Weight misperception was found in 26.7% (18.8% for males and 34.5% for females) of the general population, with thin and obese males misperceiving their weight more than their female counterparts. Interestingly, all thin participants who misperceived their weight thought that they were heavier, while all obese participants who misperceived their weight thought that they were thinner. Implicit in this is that these participants may not initiate appropriate behaviour required to remedy their situation. In fact, for overweight and obese individuals, weight underestimation results in a lack of motivation to change their poor lifestyle, thereby leading to further adipose tissue accumulation [19]. Conversely, normal-weight and overweight females misperceived their weight more often than their male counterparts. As much as 15% and 43% of normal-weight and overweight females with BSD, respectively, thought they were heavier as compared with 9% and 12%, respectively, for their male counterparts. These candidates are more likely to adopt risky weight-loss measures, such as crash diets and/or starvation, very intensive physical effort, or the use of medicine [20], all with potential deleterious consequences [4].
Therefore, this study corroborates earlier reports that weight misperception is higher in females as compared with males [21,22]. Wronka et al. [23] reported that 28.1% of female university students aged 18–24 years in southern Poland misperceived their weight. Similarly, more females in our study also misperceived their weights. Cultural and other exposures that modulate weight perception may account for the observed differences. What is constant, however, is that weight misperception results in lowered self-confidence, increased risk of eating disorders (anorexia, bulimia), and depression [24].
Akin to weight misperception, there is a strong gender disparity in the way BSD appears in populations [21,22]. While females are more likely to desire being thinner, males dissatisfied with their body shape are more concerned about their muscularity [25,26]. Body-shape dissatisfaction was found in 62% of the population (52% for males and 71% for females) and was more prevalent among thin and obese participants. Although there is no clear definition of when BSD in a population should be termed “normative discontent”, Matthiasdottir et al. [9] argues that “…it may seem appropriate to set the frame of reference at including >50% (the majority) of a population”. It is, therefore, obvious that BSD is a normative discontent in the studied population.
The proportion of the studied population with BSD is higher than that reported for 18–29-year-old Icelanders, where 29.7% of the males and 51.5% of the females were dissatisfied with their body shape [9], but lower than 76.8% (male) and 74.5% (female) young adults reported to have BSD in Hong Kong [12] and 72.2% (females) in Ghana [15]. Body-weight dissatisfaction is a common phenomenon that has grown over time [27].
While some studies show that BSD can be predictive of successful weight loss attempts [28], chronic BSD is a significant contributor to the aetiology of eating disorders [8]. It is debatable whether BSD is driven by objective or subjective constructs. Whereas some studies report that BMI is an important determinant of body-shape satisfaction [29], others insist that psychological constructs (self-esteem) rather than objective indices (BMI) are the key BSD determinants [30]. Most authors agree that sociocultural norms, socioeconomic status, education, and the media impact individual perception of ideal body shape [12]. However, it is worth noting that placing emphasis on subjective assessment rather than measurable objective indicators in determining current body weight and desired body shape might lead to unwarranted weight reduction activities and resulting adverse psychological distress in individuals and populations.
Given these findings, it is unsurprising that this study reveals poor QOL (as deduced from significantly higher QOL scores) in participants with BSD is related to a desire in thin and normal-weight participants to be heavier and in overweight participants to be thinner. As determined by measuring subjective perception of health, QOL is known to be affected negatively by being overweight/obese [7] and not surprisingly is worse for those with BSD [8].
The high prevalence of BSD and weight misperception among young-adult Nigerians calls for urgent public health action aimed at addressing these problems. The importance is exacerbated by the negative impact these factors have on their QOL. Such negative consequences, left unchecked, do not bode well for any developing nation.
The limitations of this study include the sample size not being large enough to make appropriate deductions from the data generated. For example, because obesity is not widespread in this population relative to the general population, BSD in this population may not be an accurate representation of the general population. The sample size is nevertheless adequate, especially given the cultural and financial impediments that challenge these types of studies in our part of the world. Additionally, participants who self-report suffering from chronic diseases were excluded, given that the intention was to study an apparently healthy population. This, however, implies that the prevalence of BSD may be underreported. Nevertheless, the impact of this would be minimal, given that those disqualified represent less than 1% of the studied population. Also, a single question was used to assess subject QOL rather than more sophisticated instruments, such as the SF-36, the Impact-of-weight-on-QOL Questionnaire, the Obesity-related Psychosocial Scale, etc. This was, however, warranted by lack of validation associated with these scales and the need to keep the assessment simple and straightforward, given our environment where respondents show a disdain for lengthy questionnaires. Furthermore, use of pictorial/diagrammatic scales in studies such as this may lead to an overestimation of BSD, especially in people who are affected by advertising and other similar factors. The cultural homogeneity and relatively similar exposure of the participants, however, suggests that whatever variation may have occurred in BSD reporting would impact the entire sample and not just a subset. Finally, physical activity, which is known to affect QOL, was not assessed. This study, however, is the first to assess these constructs in a Nigerian population. The results are expected to promote further research and ultimately guide public health policy and action.
5. Conclusion
In conclusion, this study investigated the prevalence of weight misperception, weight preference, and BSD among young-adult Nigerians and assessed the impact of these factors on population QOL. The results show that 26.7% of the population (18.8% for males and 34.5% for females) misperceived their weight, that BSD was found in 62% of the population (52% for males and 71% for females), and in participants with BSD, QOL was worse in thin and normal-weight respondents who preferred to be heavier and in overweight respondents who preferred to be thinner.
Conflicts of interest
The author has no real or potential conflicts of interests to declare.
Acknowledgements
The contributions of Chinwendu E. Ikwuegbu and Ruth C. Abalogu, who were responsible for collecting the data used for this analysis, are hereby acknowledged.
References
Cite this article
TY  - JOUR
AU  - Chukwunonso E.C.C. Ejike
PY  - 2015
DA  - 2015/07/29
TI  - Body shape dissatisfaction is a ‘normative discontent’ in a young-adult Nigerian population: A study of prevalence and effects on health-related quality of life
JO  - Journal of Epidemiology and Global Health
SP  - S19
EP  - S26
VL  - 5
IS  - Supplement 1
SN  - 2210-6014
UR  - https://doi.org/10.1016/j.jegh.2015.07.003
DO  - 10.1016/j.jegh.2015.07.003
ID  - Ejike2015
ER  -