
Trajectories of tuberculosis-specific interferon-gamma release assay responses among medical and nursing students in rural India
- DOI
- 10.1016/j.jegh.2013.03.003How to use a DOI?
- Keywords
- TB screening; LTBI; Serial testing; Health care workers
- Abstract
Background: Interferon gamma release assays (IGRAs) have been shown to be highly dynamic tests when used in serial testing for TB infection. However, there is little information demonstrating a clear association between TB exposure and IGRA responses over time, particularly in high TB incidence settings.
Objectives: To assess whether QuantiFERON-TB Gold In-Tube (QFT) responses are associated with occupational TB exposures in a cohort of young health care trainees in India.
Methods: All medical and nursing students at Mahatma Gandhi Institute of Medical Sciences were approached. Participants were followed up for 18 months; QFT was performed 4 times, once every 6 months. Various modeling approaches were used to define IFN-gamma trajectories and correlations with TB exposure.
Results: Among 270 medical and nursing trainees, high rates of conversions (6.3–20.9%) and reversions (20.0–26.2%) were found depending on the definitions used. Stable converters were more likely to have had TB exposure in hospital pre-study. Recent occupational exposures were not consistently associated with QFT responses over time.
Conclusion: IFN-gamma responses and rates of change could not be explained by occupational exposure investigated. High conversion and subsequent reversion rates suggest many health care workers (HCWs) would revert in the absence of treatment, either by clearing the infection naturally or due to fluctuations in the underlying immunological response and/or poor assay reproducibility. QFT may not be an ideal diagnostic test for repeated screening of HCWs in a high TB incidence setting.
- Copyright
- © 2013 Ministry of Health, Saudi Arabia. Published by Elsevier Ltd.
- Open Access
- This is an open access article under the CC BY-NC-ND license (http://creativecommons.org/licenses/by-nc-nd/4.0/).
1. Introduction
India accounts for one fifth of the global TB burden [1–3], and as such, Indian health care workers (HCWs) are consistently at an increased risk of occupational exposure to TB, development of latent TB infection (LTBI) and active disease [4–7].
In 2009, the World Health Organization (WHO) released guidelines on TB infection control (TBIC) in resource-limited settings and is now actively promoting TBIC in high TB burden countries [8]. The emergence of multi-drug resistance (MDR) [9] and extensively drug-resistant (XDR-TB) [10] strains has heightened the necessity for TBIC measures, and reinforces the importance of protecting the health care work force [10].
Annual screening of HCWs for LTBI is a critical element in TBIC programs in developed countries and is now gaining some attention in resource-limited countries as well [11]. Traditionally, screening HCWs for LTBI was performed with the tuberculin skin test (TST), but interferon-gamma release assays (IGRAs) are now available as an alternative [12,13]. IGRAs have logistical advantages which make them attractive for use in serial testing of HCWs, and systematic reviews have shown both tests (TST and IGRAs) estimate similar rates of positivity in high TB incidence settings such as India [14].
Screening HCWs for LTBI in high TB incidence settings poses many challenges, including a high level of repeated exposures, re-infection, and limited resources to carry out screening or offer isoniazid preventive therapy (IPT) when necessary. Early serial testing studies suggest IGRA results may be highly variable over time, resulting in higher frequencies of conversions and spontaneous reversions than seen with the conventional TST [15]; many groups are now exploring alternative IGRA conversion definitions or the use of a borderline zone for values close to the cut-off that might better correlate with true instances of new infection [16,17]. However, these analyses have been conducted largely in low TB incidence settings, and data are still lacking as to the extent to which IGRA conversions or rates of change are associated with TB exposure (as a proxy for the likelihood of TB infection) in a high TB incidence setting.
1.1. Study objectives
Study objectives were firstly to estimate rates of QuantiFERON-TB Gold In-Tube (QFT) conversions and reversions in Indian health care trainees, during six-month intervals, over four test points. Secondly, rates of TB exposure were estimated by type of health care trainee, and evaluated whether QFT conversions were associated with TB exposures, and QFT reversions with treatment. HCWs were categorized by patterns of QFT responses, to assess whether different patterns were associated with exposure. Secondary objectives were to assess what occupational TB exposure factors (if any) were associated with change in IFN-gamma response over the four time points.
2. Materials and methods
2.1. Study setting and population
This study was conducted at the Mahatma Gandhi Institute of Medical Sciences (MGIMS), Sevagram, a teaching hospital located in central India. The hospital sees an average of 300 smear positive TB cases per year, two thirds of which are treated as in-patients. As MGIMS is a referral center, most smear positive patients are seriously ill when they reach the hospital and require hospitalization. Approximately three quarters of all smear positive in-patients are diagnosed only during in-patient evaluation.
TB infection control measures are limited, screening for LTBI is not routinely performed and personal respirators are not routinely provided (and when available not routinely employed by HCWs when interacting with patients with active TB). Previous research at this hospital has shown a high prevalence of LTBI, high annual risk of TB infection in young health care trainees, and a high incidence of active TB among HCWs [7,15,18].
2.2. Study design and ethics approval
This longitudinal study was conducted from August 2007 to July 2009. Upon providing informed consent, students completed a brief questionnaire on occupational and non-occupational exposure to TB prior to enrollment, and blood was drawn for the QFT. Participants were followed up for 18 months and underwent blood draws and exposure assessment every 6 months. TST was not done as TST could have altered QFT responses [19]. Ethical approval for the study was obtained from both the McGill University Health Centre (MUHC) in Montreal, Canada, and from the institutional review board (IRB) of the MGIMS.
2.3. IGRA testing (QFT)
Participants were tested with the QuantiFERON-TB Gold In-Tube (QFT) test (Cellestis, Inc./Qiagen, Carnegie, Australia), performed as per the manufacturer’s instructions on site at the MGIMS laboratory. The QFT was considered positive if the interferon-gamma (IFN-g) produced in the TB antigen tube minus the IFN-g produced in the nil tube was ⩾0.35 IU/ml, as per the manufacturer’s recommendations. Quantitative IFN-g values were also recorded; results greater than 10 IU/ml or less than 0 were truncated at 10 and 0 respectively; as values outside this range are not precisely measurable.
2.4. Questionnaire and ascertainment of TB exposure
Exposure ascertainment was done by verifying detailed log books kept by all trainees, outlining the students’ daily responsibilities between each study test point. Log books are used to monitor attendance during the students’ hospital rotation duties, and include what ward and patients (using a 12-digit hospital ID number) individual students were responsible for each day. Typically, medical students took part in 60-min rounds, while nursing students had 15-min interactions per patient, but had a higher number of patient interactions per day, in which they help with vital signs, medications, and bed care. Electronic discharge summaries of all patients who interacted with HCW trainees were obtained to identify if they had TB, and it was noted if it was pulmonary (sputum smear positive or smear negative) or extra-pulmonary, and whether the patient was on anti-tuberculosis treatment (ATT) at the time of contact. In summary, the measurement of exposure (i.e., quantity and duration of contact) for each individual student participating in the study was based on actual time spent caring for infectious TB patients. Occupational TB exposures prior to study enrollment and non-occupational TB exposures were collected through self-administered questionnaires completed by the HCW at each test point.
Using these detailed exposure durations collected for each student, three cumulative exposure variables were constructed: (a) total number of days exposed to smear positive or smear negative TB cases; (b) actual minutes exposed to smear positive TB cases only; and (c) number of days exposed to an active TB patient, not on ATT.
2.5. Study definitions
Both conventional and alternative QFT conversion definitions were assessed. Conversion definition (A) uses the manufacturer’s recommended cut-off point of a change from negative to positive (IFN-g ⩾ 0.35 IU/ml). Conversion definition (B) was a change from negative to positive (cut-off point IFN-g ⩾ 0.35 IU/ml) and an absolute increase of 0.7 IU/ml over the first QFT result; this comes from within-subject variability research conducted in South Africa [19,20]. Conversion definition (C) was the most stringent, with a change from negative to positive based on a threshold value of IFN-gamma ⩾ 1.0 IU/ml, reflecting earlier research conducted by this study’s group [21]. QFT reversion was defined as a change from a positive result to a negative result (cut point <0.35 IU/ml). Conversions and reversions were assessed with reference to the QFT result from the previous testing period (i.e., 6 months earlier).
Based on previous work, this research expected to find five patterns of changes in dichotomous QFT results over time [22]. The five patterns were: (a) persistent negatives – all QFT negative results; (b) persistent positives – all positive QFT results; (c) stable conversions – QFT conversion at any time point, and no subsequent reversion; (d) stable reversions – QFT reversion at any time point, with no subsequent conversion; and (e) unstable patterns – at least one conversion and one reversion over the study period [22].
2.6. Statistical analysis
All analyses were performed with Stata version 11 (Stata Corp, Texas, USA). The various definitions listed above were used to assess rates of QFT conversions and reversions. To evaluate the association between the patterns of QFT results and cumulative TB exposure, odds ratios and their accompanying 95% confidence intervals (CI) were estimated from the multivariable polytomous logistic regression model, which allows for the simultaneous assessment of multiple outcome categories [23].
Multiple longitudinal modeling techniques were used to assess an association between recent occupational TB exposure and one of three outcomes: QFT positivity, conversions, or continuous IFN-gamma. General estimating equations (GEE) were used to estimate population-averaged marginal models for QFT positivity [24]. It was investigated whether there was a difference in the effect of the time dependent occupational exposure variables within-subject versus between subjects over time [25]. Generalized linear mixed models (GLMMs), estimated via adaptive quadrature, were used to assess whether time-dependent occupational exposures were associated with QFT conversions, using one of the three proposed conversion definitions. Random intercepts and random slopes were investigated for test point, initial interferon-gamma values and key time dependent occupational exposure variables. The final model comparing QFT conversions (definition A) was a random intercept only model, dummy variables were used to account for high moderate and low initial interferon gamma values, an interaction term was investigated for test point and initial IFN-gamma response at study enrollment. Finally, a linear random effects model was fit to continuous IFN-gamma values. Given that continuous IFN-gamma has both floor and ceiling effects, due to the truncation of continuous IFN-gamma values at 0 and 10 IU/ml, there was concern about the assumption of normality. Therefore, a mixed effects Tobit regression [26] was used to assess the association between exposure and rates of change in continuous IFN-gamma values while accounting for the ceiling and floor effect seen in the distribution of continuous IFN-gamma.
3. Results
3.1. Participant demographics and exposure to TB
A total of 270 trainees (165 [61.1%] medical and 105 [38.9%] nursing students) participated in the study and completed testing. Table 1 summarizes the characteristics of the study cohort. A total of 61.5% were female, median age was 19.4 years. Valid QFT results were available for all 4 time points in 196 participants, while 28 participants completed 3 tests, and 46 participants completed 2 tests (a total of 960 valid QFT results). Based on the log books maintained by trainees, participants reported a median number of 24, 25.5 and 12 days spent on medical wards between each test point respectively; a visual representation of time spent on the wards for each interval is presented in Figure 1. Over the course of the study, 52 participants (19.3%) were advised to take INH based on positive test results at study enrollment. Among them, 18/52 (34.6%) participants initiated INH therapy, and all 18 completed 6 months of therapy. No participant was diagnosed with active TB during the study period.
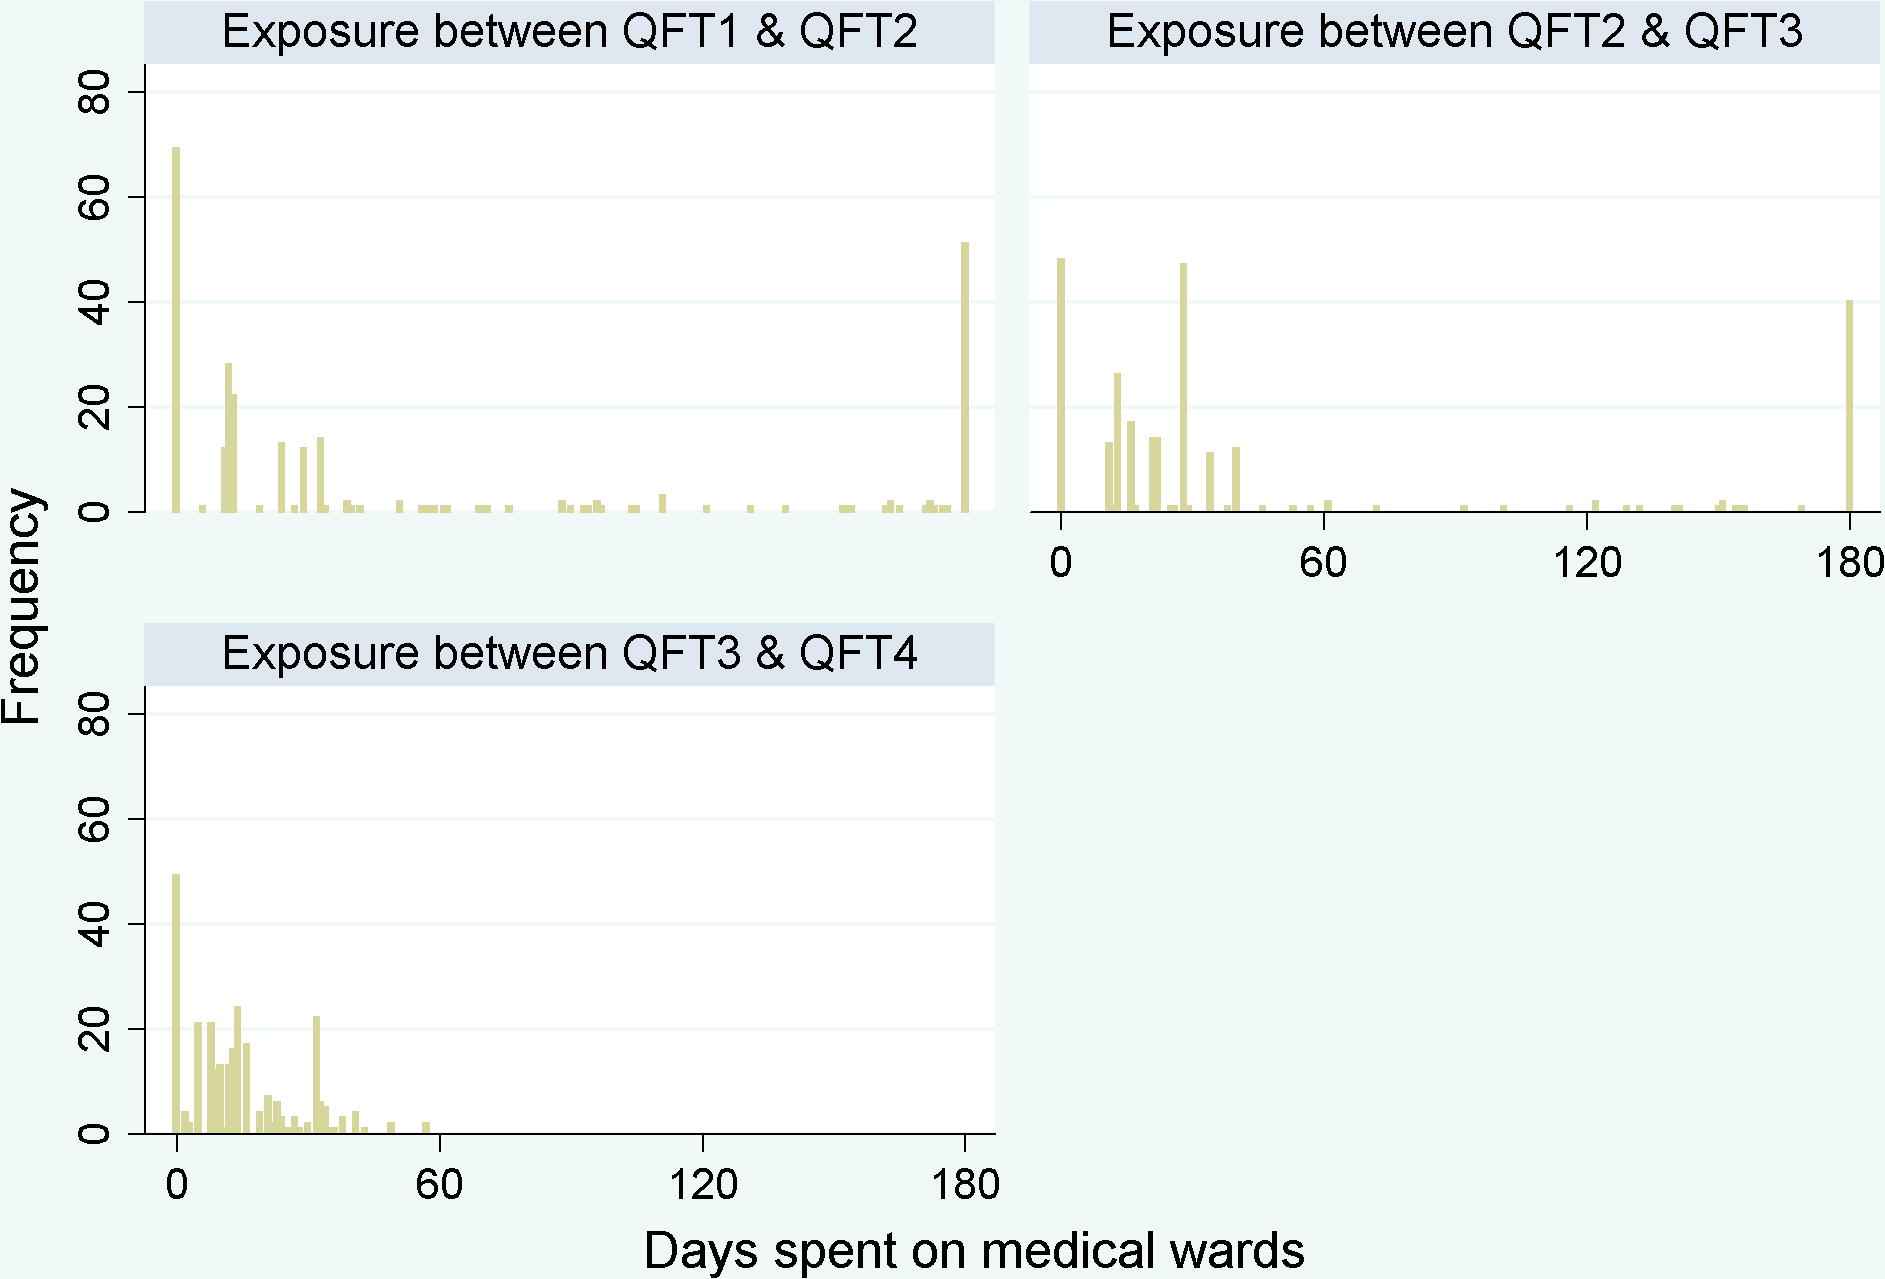
Days spent on medical wards for each interval between testing. Histogram of number of days spent on medical wards for each student during each 6 month interval between QFT testing. Frequency is the number of participants with that number of exposed days per testing period.
| Characteristic | N = 270 (%) |
|---|---|
| Sex | |
| Females | 166 (61.5%) |
| Males | 104 (38.5%) |
| Student type | |
| Medical student | 165 (61.1%) |
| Nursing student | 105 (38.9%) |
| Age at first test (mean and IQR) | 19.4 yers (18.4–20.5 yers) |
| Average monthly household income | |
| <Rs. 5000 | 113 (41.85%) |
| Rs. 5000–10,000 | 78 (28.9%) |
| Rs. 10,001–20,000 | 25 (9.3%) |
| Rs. 20, 001–30,000 | 23 (8.5%) |
| >Rs. 30,000 | 30 (11.1%) |
| Did not want to report | 1 (0.4%) |
| BCG Vaccination | |
| Not vaccinated | 41 (15.2%) |
| Vaccinated at birth | 203 (75.2%) |
| Vaccinated after birth | 1 (0.4%) |
| Do not know | 25 (9.3%) |
| Year of entry into training program | |
| 2005 | 53 (19.6%) |
| 2006 | 81 (30%) |
| 2007 | 98 (36.3%) |
| 2008 | 38 (14.1%) |
| Mean number of valid QFT results per participant | 3.6 (min: 2, max: 4) |
| Diagnosed with TB in the past | |
| No | 266 (98.5%) |
| Yes | 4 (1.5%) |
| Any medical postings prior to study enrollment | |
| No | 130 (48.15%) |
| Yes | 140 (51.85%) |
| Any TB exposures in hospital prior to enrollment | |
| No | 177 (65.6%) |
| Yes | 93 (34.4%) |
| Any TB exposures in the community prior to study enrollment | |
| No | 145 (53.7%) |
| Yes | 23 (8.5%) |
| Did not report | 102 (37.8%) |
| Completed 6 month LTBI treatment | |
| No | 252 (93.3%) |
| Yes | 18 (6.7%) |
| Median number of days spent on medical wards per testing interval | |
| Between QFT1 and QFT2 | 24 days (IQR: 0–111) |
| Between QFT2 and QFT3 | 25.5 days (13–40) |
| Between QFT3 and QFT4 | 12 days (5–21) |
Characteristics of study participants (at enrollment unless otherwise stated).
Upon initial testing, 64/226 (28.3%) HCWs reported positive QFT test using the manufacturer’s definition.
Table 2 describes the mean number of occupational exposures per testing period stratified by type of trainee (i.e., medical or nursing). With the exception of TB exposure in the community prior to study enrollment, nursing students report consistently a higher mean number of days exposed during each testing period. While medical students reported a mean of 15.5 (SD: 15.1) days working on medical wards per 6 month period, nursing students reported a mean of 80.9 (SD: 75.9) days. The only exposure variable to be more common in medical students was non-occupational TB exposure prior to study enrollment, which was reported in 24/420 (5.7%) nursing students and 68/660 (10.3%) medical students. QFT positivity at study enrollment was similar between groups; 27.5% (44/160) QFT positive medical students and 20/66 (30.3%) QFT positive nursing students.
| Occupational exposures | Medical students | Nursing students |
|---|---|---|
| Mean number of exposures (in days or minutes) per 6 months between QFT tests | ||
| Days exposed to smear positive TB patients | 0.94 (SD*: 1.74) Range: 0–9 | 12.4 (SD: 17.7) Range: 0–126 |
| Days spent working on medical wards | 15.5 (SD: 15.1) Range:0–180 | 80.9 (SD: 75.8) Range:0–180 |
| Days exposed to TB patients NOT on anti-TB therapy (ATT) | 0.23 (SD: 0.88) Range:0–7 | 4.5 (SD: 6.58) Range:0–54 |
| Time (in minutes) exposed to smear positive patients | 56.7 (SD: 104.47) Range:0–540 | 185.6 (SD: 265.4) Range: 0–1890 |
| Any TB exposures in hospital prior to enrollment n/N (%) | 192/660 (29.1%) | 180/420 (42.9%) |
| Any TB exposures in the community prior to study enrollment n/N (%) | 68/660 (10.3%) | 24/420 (5.7%) |
| QFT outcome | QFT positivity and conversions – n/N (%)** | |
| Initial QFT positivity | 44/160 (27.5%) | 20/66 (30.3%) |
| QFT conversion rate (at any time point) | 54/307 (17.6%) | 9/134 (6.7%) |
| QFT reversion rate (at any time point) | 35/119 (29.4%) | 9/65 (13.9%) |
SD: standard deviation
For this analysis each period (i.e., QFT1 to QFT2 or QFT2 to QFT3) was treated as a separate and independent event. Therefore, denominators represent the number of eligible participants at each time point to convert or revert. In order to be eligible for conversion, participants must have had a negative QFT on the previous test; therefore denominators are the number with negative QFT at the start of the interval. To be eligible for a reversion, participants must have had a positive QFT result on the previous test.
Occupational exposures and QFT results stratified by type of medical trainee.
3.2. Conversion and reversion rates
When QFT conversion rates were estimated among medical and nursing students, treating each period as an independent observation, the QFT conversion rate (54/307) among medical students was 17.6%, and the QFT conversion rate (9/134) among nursing students was 6.7%, despite higher levels of reported exposures in nursing students. Employing a more stringent cut-off point consistently resulted in decreased conversion rates across all test points, but little difference was found between the more strict conversion definitions (B and C).
Table 3 presents the total number of conversions, at any test point, stratified by participant characteristics and TB exposure at enrollment. Conversions were less frequent among participants with occupational and non-occupational TB exposures prior to study enrollment. For occupational exposures collected post-study enrollment, the mean number of days or minutes exposed per 6 month period between testing dates was calculated (Table 4). The Mann–Whitney test was used to assess whether the median number of exposures was different between participants with conversions and participants with stable negatives. For mean number of days spent working on medical wards, it was found that converters had a statistically smaller mean number than did stable negatives (17.1 vs. 28, p = 0.01). Similarly, converters reported a smaller number of mean days in contact with TB patients not on anti-TB therapy (0.71 vs. 1.6, p < 0.01).
| Characteristic | Conversions (n/N)* |
|---|---|
| Sex | |
| Females | 28/250 (11.2%) |
| Males | 35/191 (18.3%) |
| Student type | |
| Medical student | 54/307 (17.6%) |
| Nursing student | 9/134 (6.7%) |
| Completed 6 month LTBI treatment | |
| No | 60/437 (13.7%) |
| Yes | 3/4 (75%) |
| Any TB exposures in the community prior to study enrollment | |
| No | 60/410 (14.6%) |
| Yes | 3/31 (9.7%) |
| Any medical postings prior to study enrollment | |
| No | 39/215 (18.1%) |
| Yes | 24/226 (10.6%) |
| Any TB exposures in hospital prior to enrollment | |
| No | 48/296 (16.2%) |
| Yes | 15/145 (10.3%) |
For this analysis, each period (i.e., QFT1 to QFT2 or QFT2 to QFT3) was treated as a separate and independent event. Therefore, denominators represent number of eligible participants at each time point to convert. In order to be eligible for conversion, participants must have had a negative QFT on the previous test, therefore denominators are the number with negative QFT at the start of the interval.
QFT conversion rates at any test point (using manufacturer’s conversion definition) in Indian trainees stratified by participant characteristics.
| Occupational exposures reported per 6 month period between testing | Converters (n = 63) | Stable negatives (453) | p Value: Mann Whitney test of medians |
|---|---|---|---|
| Mean number of days exposed to smear positive TB patients | 2.8 (SD: 9.9) | 5.7 (SD: 12.9) | p = 0.57 |
| Mean number of days spent working on medical wards | 17.1 (SD: 31.8) | 52.3 (SD: 67.0) | p = 0.00 |
| Mean number of days exposed to TB patients NOT on anti-TB therapy (ATT) | 0.71 (SD: 3.0) | 2.1 (SD: 5.1) | p = 0.22 |
| Mean time in minutes exposed to smear positive patients | 100.5 (SD: 193.4) | 109.3 (SD: 200.5) | p = 0.66 |
This analysis treats each period from QFT1 to QFT2, QFT2 to QFT3, etc., as one independent observation.
Mean number of occupational exposures reported per 6 month period between testing among participants with conversions versus persistent negatives.*
Conversion and reversion rates for each test period are presented in Table 5. Using the manufacturer’s conversion definition, 18/159 (11.3%) conversions were identified at QFT 2 among participants with negative QFT 1. At QFT 3, 16/143 (11.2%) conversions were identified among QFT 2 negative participants, and 29/139 (20.9%) conversions at QFT 4 were found among participants with negative QFT 3 results. Reversion rates were frequently higher than conversion rates, 16/61 (26.2%) at QFT 2 among those with positive QFT 1 results, 16/63 (25.4%) at QFT 3 among participants with positive QFT 2 results and 12/60 (20%) reversions at QFT 4 among participants with positive QFT 3. Denominators for reversion rates are smaller at each test point compared with conversion rates as fewer participants were QFT positive and thus eligible for a reversion upon subsequent testing.
| Conversion definition* | 6 month | 12 month | 18 month |
|---|---|---|---|
| A | 18/159 (11.3%) | 16/143 (11.2%) | 29/139 (20.9%) |
| B | 11/159 (6.9%) | 11/143 (7.7%) | 20/139 (14.4%) |
| C | 10/159 (6.3%) | 10/143 (7%) | 16/139 (11.5%) |
| Reversion** | 16/61 (26.2%) | 16/63 (25.4%) | 12/60 (20%) |
Conversion definitions: (A) change from negative to positive ⩾0.35 IU/ml, (B) change from negative to positive ⩾0.35 IU/ml and 0.7 IU/ml absolute increase, (C) change from negative to positive ⩾1.0 IU/ml.
Reversion defnition: change form positive (⩾0.35 IU/ml) to negative (<0.35 IU/ml).
Conversion and reversion rates at each follow-up, using different conversion definitions.
3.3. Conversions and/or reversions stratified by initial IFN-gamma values
Conversion and reversion rates using the manufacturer’s cut-off point and stratified by initial quantitative QFT results are presented in Table 6. The majority of these trainees were young and had limited exposure to TB prior to enrollment in the program, therefore IFN-gamma response at study enrollment might be a useful predictor of QFT patterns over time. Conversion and reversion rates were calculated at each test point, the denominators for conversion/reversions rates were all HCWs with a negative/positive QFT at the previous test point. Therefore, a HCW with an initial QFT 1 positive could have a reversion at QFT 2 and a subsequent conversion at QFT 3. Higher conversion rates at QFT 3 and QFT 4 can be seen among those participants with higher QFT 1 IFN-gamma results (i.e., 33–80% conversion at QFT 3 among QFT 1 positives vs. 9–19% QFT 3 conversion rates among those with QFT 1 negative results). Similar patterns can be seen among QFT reverters, where among QFT 1 negatives, reversion rates were high and ranged from 67% to 80%, while among the QFT 1 positives, reversion rates were between 0% and 33%. This was investigated further in the longitudinal analysis.
| QFT at study enrollment: TB Ag- Nil (IU/ml) | Participants with result, n (%) | Conversions at QFT 2 | Conversions at QFT 3 | Conversions at QFT 4 | Reversions at QFT3 | Reversions at QFT 4 |
|---|---|---|---|---|---|---|
| <0.01 | 68 (31%) | 10/68 (15%) | 5/58 (9%) | 11/61 (18%) | 8/10 (80%) | 4/7 (57%) |
| 0.01–0.19 | 75 (34%) | 5/75 (7%) | 13/70 (19%) | 14/61 (23%) | 4/5 (80%) | 8/14(57%) |
| 0.2–0.34 | 16 (7%) | 3/16 (19%) | 2/13 (15%) | 3/13 (23%) | 2/3 (67%) | 2/3 (67%) |
| Reversions at QFT 2 | ||||||
| 0.35–0.49 | 5 (2%) | 2/5 (40%) | 1/2 (50%) | 1/2 (50%) | 1/3 (33%) | 1/3 (33%) |
| 0.5–0.69 | 4 (2%) | 4/4 (100%) | 3/4 (75%) | 1/1 (100%) | – | 1/3 (33%) |
| 0.7–0.99 | 6 (3%) | 3/6 (50%) | 1/3 (33%) | 1/2 (50%) | 0/3 (0%) | 2/4 (50%) |
| 1–2.99 | 12 (5%) | 5/12 (42%) | 4/5 (80%) | 1/1 (100%) | 0/7 (0%) | 4/11 (36%) |
| 3.00+ | 34 (15%) | 2/34 (6%) | 1/2 (50%) | 1/2 (50%) | 1/32 (3%) | 1/32 (3%) |
Conversion and reversion rates at 6, 12 and 18 months stratified by quantitative IFN-gamma values at study enrollment (using conversion definition A: ⩾0.35 IU/ml).
3.4. Patterns of change over 18 months
Each participant was classified into one of five groups based on their cumulative 18 month QFT pattern. Using the manufacturer’s definition of a positive test, 151/270 participants (55.9%) were persistently negative, 45/270 (16.7%) were persistently positive, 29/270 (10.7%) participants had a stable conversion, 11/270 (4.1%) had a stable reversion, and finally 34/270 (12.6%) of participants had unstable patterns. Figure 2A–E are trajectory plots of the quantitative IFN-g values over time within each participant stratified by QFT patterns. These demonstrate the wide variability of responses over time within some participants, and the diversity across subgroups. The variability among persistently positive and unstable patterns appears to be much larger compared with the variability seen among the persistently negatives. These patterns should be interpreted as a slice in time; looking at Figure 2 it can be observed that many of the stable converters converted at QFT 3 or QFT 4.
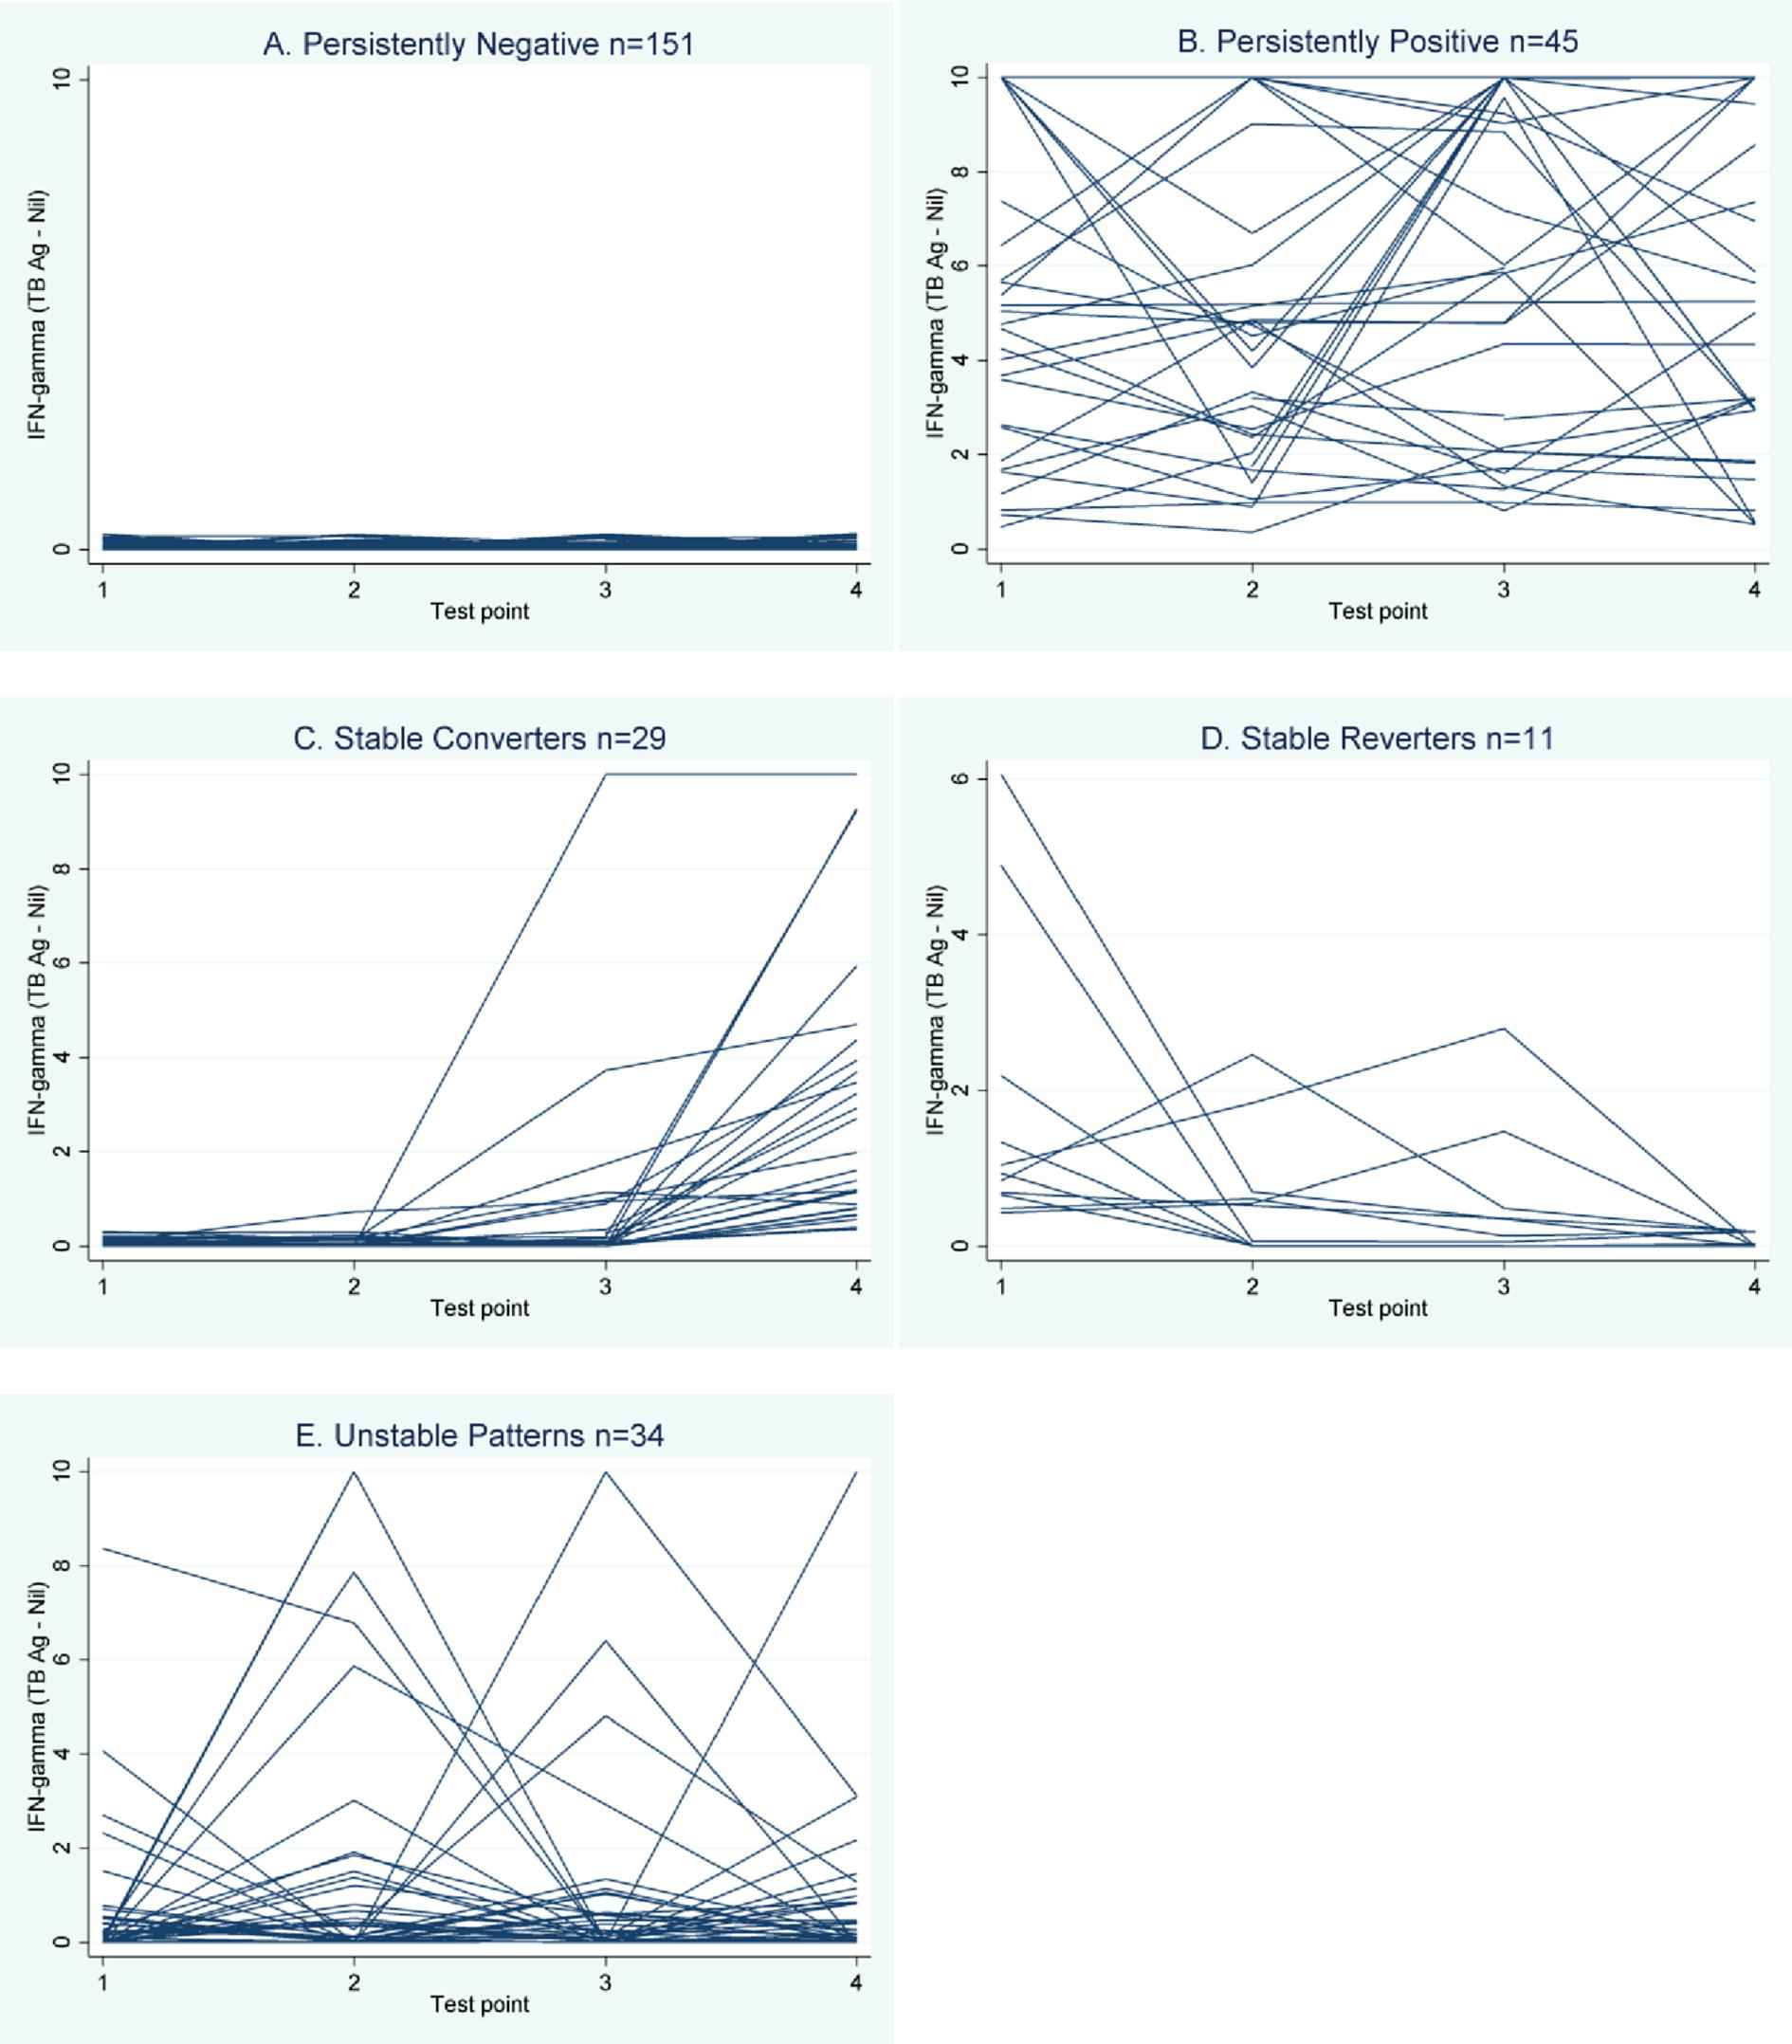
Trajectory plot of interferon-gamma (TB antigen – nil) over 4 test points, by participant. Trajectory plots of continuous interferon-gamma (TB antigen – nil, IU/ml), within each participant over time. Plots are presented for all students with the same 18 month QFT trajectory together (i.e., A: all students with persistent negative patterns; B: all students with persistent positive patterns, etc.).
Multivariable polytomous logistic regression was performed to assess whether known TB risk factors and cumulative 18 month occupational exposure were associated with any particular QFT pattern. Stable converters were more likely to have had exposure to TB in the hospital prior to baseline testing (OR = 14.3, 95% CI: 2.1–96.8), while unstable patterns were significantly less likely to have had exposure to TB in the hospital prior to study enrollment (OR = 0.2, 95% CI: 0.0–0.8).
3.5. Longitudinal analysis: QFT positivity and conversions
Next, it was assessed whether (a) QFT positivity or (b) QFT conversions (both binary outcomes) were associated with occupational exposures to TB occurring between each QFT test point. Occupational exposure variables were collected in a time-dependent manner (i.e., for each interval between testing) and included: days/time working on medical wards, days/time exposed to smear positive patients, total days/time exposed to smear positive and smear negative and extra-pulmonary patients, and finally total days exposed to active TB patients not on ATT. Non-linear shapes for the exposure outcome association were investigated, but the best fit was a linear characterization of exposure.
3.5.1. Is QFT positivity associated with occupational TB exposure over time?
To account for correlation among QFT results from the same participant, a GEE approach was used to estimate a population-averaged model. The within-subject effect of increasing number of days spent working on medical wards was significantly associated with increasing rates of QFT positivity in the marginal model. The effect appeared small (OR = 1.01 per day on medical ward, 95% CI: 1.00–1.02), but an accumulation of days between testing could lead to a clinically meaningful effect. While there was a significant effect of exposure within-subjects, when comparing between HCWs, the effect of exposure was no longer statistically significant, suggesting other factors may influence QFT positivity across HCWs.
3.5.2. Are conversions associated with occupational exposure over time?
Next, it was assessed whether QFT conversions (not simple positivity) were associated with occupational exposure over time in this population. Three conversion definitions were assessed in this analysis (A through C). A minimum of two valid QFT results were required to establish a conversion, and as such, the total number of observations decreased for this analysis to 404, with an average number of observations of 2.8 per participants (range: 1–3).
It was assessed whether conversions (using definitions A–C) were associated with occupational exposure using a random effects model estimated using quadrature. Between- and within-subject effects were not statistically significantly different in this analysis with conversions. None of the occupational exposure variables investigated were associated with QFT conversions using any of the three proposed conversion definitions.
3.6. Longitudinal analysis: change in continuous interferon-gamma
To evaluate whether exposure over time was associated with rates of change in continuous IFN-gamma values, a random effects Tobit model was used to account for the ceiling and floor effect seen among continuous IFN-g values, which are truncated at 0 and 10 (Figure 3). In univariable analysis using the Tobit model, it was found that days having worked on medical wards (within-subject effect) were statistically significantly associated with a positive change in quantitative IFN-gamma, but this was no longer statistically significant in the final multivariable Tobit model. High initial IFN-gamma values (>1.0 IU/ml) were associated with a 6.09 unit increase in IFN-g over time in the adjusted model (95% CI: 5.08–7.10).
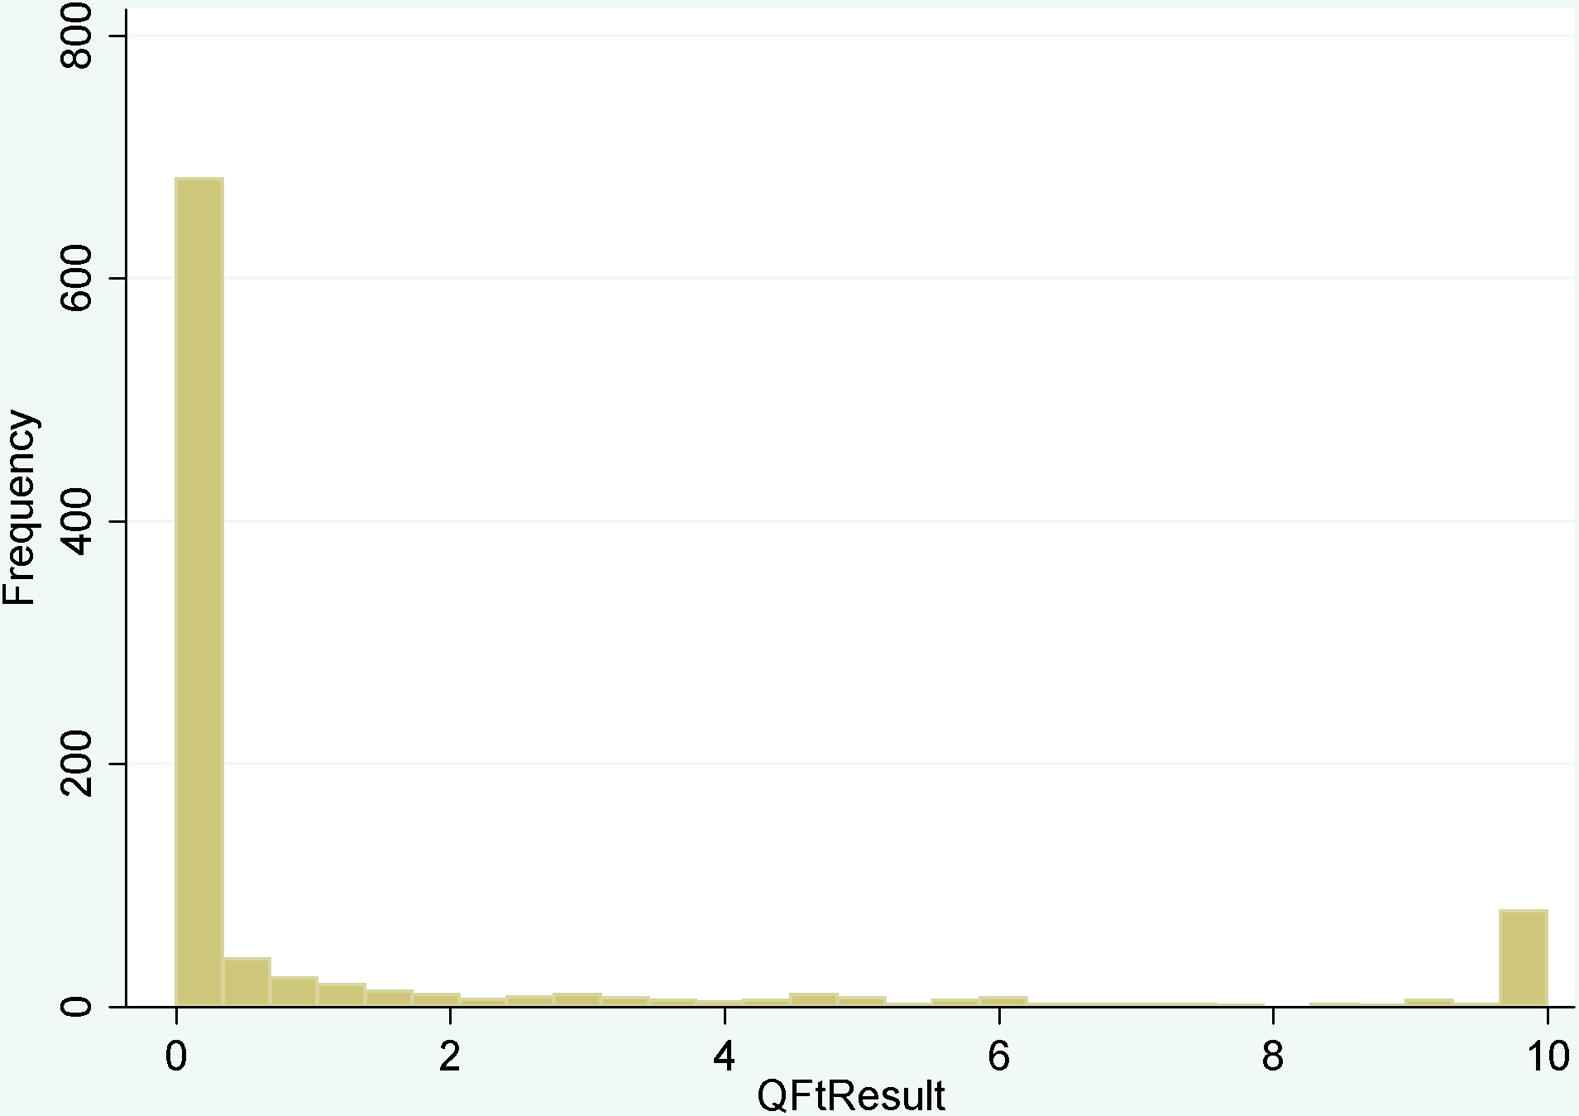
Histogram of continuous interferon-gamma results from all time points. Continuous interferon-gamma (TB antigen minus the nil) measured using the QFT-GIT test, from all participating students and across all time points, n = 960.
4. Discussion
Results from this serial testing study in India show high conversion and reversion rates using QFT among this young cohort of medical and nursing students, and is consistent with our previous studies in India and recent publications from low TB incidence settings demonstrating high rates of conversions and reversions upon serial testing HCWs [15,27]. While employing more stringent conversion definitions did reduce apparent rates of conversions and reversions at QFT 2, QFT 3 and QFT 4, alternative conversion definitions were not any more strongly associated with known TB exposure or recent occupational TB exposure. Using four different methods of longitudinal analysis, recent TB exposure was found to be statistically significantly associated with QFT positivity in only one model, and then only to a limited degree. QFT reversion rates were high across all time points (20–26.2%), and reversions pose a concern for clinicians trying to determine whether to prescribe IPT to a QFT-positive HCW. Indeed, other recent publications have demonstrated reversions irrespective of treatment [28,29]. It remains unclear whether reversions represent a clearing of infection or whether the initial positive QFT could be a transient immunological response as opposed to true TB infection.
The only variable to be significantly associated with any cumulative 18 month QFT pattern was exposure to TB in the hospital prior to study enrollment. Interestingly, while it was positively associated with stable converters, exposure in the hospital was less likely to be reported among those with unstable QFT patterns. This may suggest that exposure to TB in the hospital was a good predictor of a ‘stable’ pattern. Alternatively, this could suggest that students without any prior hospital exposure are more likely to experience unstable patterns initially, until their IFN-gamma levels stabilize.
In a population averaged model with QFT positivity as the outcome, it was observed that days spent working on medical wards were associated with increased odds of being QFT positive within a HCW. However, when comparing across HCWs, this effect was no longer significant, suggesting other factors affect QFT positivity between HCWs. It is possible that individual subjects’ infection control practices and knowledge, which were not captured in this analysis, could explain why increased exposure was associated with increased positivity within-subjects but not across subjects. Alternatively, there may be some unknown underlying immunological phenomenon at play. This effect was significant in only one of the four longitudinal analyses investigated, and was significantly different between and within participants. Recent occupational exposure was not associated with QFT conversions or continuous IFN-gamma results.
In the QFT conversion analysis, no association was found between QFT conversions and occupational exposures using any of the three proposed conversion definitions. The only time dependent occupational TB exposure variable to be statistically significantly associated with any outcome investigated was days spent working on medical wards, and while exposure to known smear positive cases may correlate better with intensity of exposure, days spent on medical wards will capture cumulative known plus unknown occupational TB exposure; the latter may be considerable in this high TB incidence environment.
One potential explanation for the high rate of conversions and reversions may be the lack of reproducibility of the assay itself. T cell assays such as the IGRAs may be influenced by variability in manufacturing, pre-analytical and analytical procedures as well as immunological differences in samples taken from the same person at different times [30]. A systematic review published in 2009 demonstrated that within-subject IGRA reproducibility ranged from 16% to 80% in continuous IFN-gamma response and could result in changes in dichotomous positive/negative results [19]. Recently, Doberne et al. demonstrated that delays in incubation time between two samples taken from the same person at the same time could result in discordant test results [31] and other studies have reported similar issues [32–34]. These issues deserve further exploration, particularly in settings with high levels of TB exposure.
4.1. Strengths and limitations
A major strength of this study was its being conducted in a high TB incidence setting. There are few serial testing studies from high TB incidence settings, and fewer still that have examined any sort of occupational exposure. Another key strength of this work was the direct ascertainment of detailed exposure to infectious TB patients. The study design took advantage of detailed records of occupational and community TB exposure within the medical school training program to directly capture actual time spent caring for active TB patients. In addition, by using discharge summaries, the smear status of active TB cases and whether patients were on anti-tuberculosis treatment at the time of contact were identified, thus establishing whether patients were contagious at the time of contact. Furthermore, all medical and nursing trainees at this school are required to live in on-campus dormitory-style housing, so that community exposure during their training program is relatively low.
However, India is a high TB incidence setting, and the possibility of unknown or un-documented exposure to TB cannot be ruled out. While a major attempt was made to obtain detailed exposure assessment, the possibility that the log books which are used for attendance and monitoring are not entirely accurate cannot be eliminated, any extracurricular activities or additional time trainees spent in the wards would not have been recorded as part of the training logs.
Finally, modeling techniques particularly suited to longitudinal data were used to account for the within-subject serial correlation of QFT results over time. However, these although a large number of test points were available, the small number of outcome events, together with a large number of potential predictors, means that confidence intervals are wide, and inference should be made with caution.
5. Conclusion
Overall, these findings confirm the previous literature on the highly dynamic nature of IFN-gamma responses over time, and suggest IGRAs may not be an ideal diagnostic test for repeated screening of HCWs [35]. IFN-gamma trajectories as measured by QFT are highly correlated within-subjects over time, and observed changes could not be explained by occupational exposure variables investigated in a longitudinal analysis. Indeed, in four multivariable models assessed, only two demonstrated any association between occupational TB exposure and QFT results, while the type of exposure associated with QFT results was not consistent across different analyses. Increasing number of days spent on medical wards was associated with an increased risk of QFT positivity within-subjects, but the effect was not seen between subjects, suggesting the effect of exposure is somehow washed out by other unmeasured differences between subjects, such as underlying immunological phenomena or personal infection control practices. High conversion and subsequent reversion rates suggest that not all HCWs with positive QFT results have true latent TB infection requiring IPT; alternatively, there may be persistent infection, yet variable QFT responses fail to reflect this. Many would revert in the absence of treatment; either because they were not truly infected, or by clearing the infection naturally. Treating all HCWs with positive QFT could result in unnecessary adverse events and increased costs. Finally, the lack of clear and strong associations between investigated occupational exposure and QFT conversions, or continuous IFN-gamma changes suggest that QFT alone may not be the ideal strategy for identifying LTBI in routine screening of HCWs in high TB incidence settings.
Conflict of interest
No conflict of interest.
Acknowledgements
The authors gratefully acknowledge the contributions and dedication of all those who helped to implement and facilitate study procedures. We would like to thank our collaborators at Mahatma Gandhi Institute of Medical Sciences, for their warm hospitality, and enthusiasm for this project. The authors thank the study participants, whose time and interest made this study possible. Funding for this project was provided through an operating Grant from the Canadian Institutes of Health Research (CIHR MOP- 81362). AZ is supported by a fellowship from CIHR, and MP is a recipient of salary support from CIHR and Fonds de recherche du Québec – Santé.
References
Cite this article
TY  - JOUR
AU  - Alice Zwerling
AU  - Rajnish Joshi
AU  - S.P. Kalantri
AU  - Gajalakshmi Dakshinamoorthy
AU  - Maryada Venkatarama Reddy
AU  - Andrea Benedetti
AU  - Kevin Schwartzman
AU  - Dick Menzies
AU  - Madhukar Pai
PY  - 2013
DA  - 2013/04/10
TI  - Trajectories of tuberculosis-specific interferon-gamma release assay responses among medical and nursing students in rural India
JO  - Journal of Epidemiology and Global Health
SP  - 105
EP  - 117
VL  - 3
IS  - 2
SN  - 2210-6014
UR  - https://doi.org/10.1016/j.jegh.2013.03.003
DO  - 10.1016/j.jegh.2013.03.003
ID  - Zwerling2013
ER  -