
Ensembled Deep Neural Network for Intracranial Hemorrhage Detection and Subtype Classification on Noncontrast CT Images
 , Mark P. Supanich1, , Jie Deng1, *
- DOI
- 10.2991/jaims.d.210618.001How to use a DOI?
- Keywords
- Intracranial hemorrhage; Subtype classification; Computer tomography; Deep learning; Ensembled model
- Abstract
Rapid and accurate diagnosis of intracranial hemorrhage is clinically significant to ensure timely treatment. In this study, we developed an ensembled deep neural network for the detection and subtype classification of intracranial hemorrhage. The model consisted of two parallel network pathways, one using three different window level/width settings to enhance the image contrast of brain, blood, and soft tissue. The other extracted spatial information of adjacent image slices to the target slice. Both pathways exploited the EfficientNet-B0 as the basic architecture and were ensembled to generate the final prediction. Class activation mapping was applied in both pathways to highlight the regions of detected hemorrhage and the associated subtypes. The model was trained and tested using Intracranial Hemorrhage Detection Challenge (IHDC) dataset launched by the Radiological Society of North America (RSNA) in 2019, which contained 674,258 head noncontrasts computer tomography images acquired from 19,530 patients. An independent dataset (CQ500) acquired from another institution was used to test the generalizability of the trained model. The overall accuracy, sensitivity, and F1 score for intracranial hemorrhage detection were 95.7%, 85.9%, and 86.7% on IHDC testing dataset and 92.4%, 92.6%, and 93.4% on external CQ500 testing dataset. The heatmaps by class activation mapping successfully demonstrated discriminative feature regions of the predicted hemorrhage locations and subtypes, providing visual guidance for radiologists to assist in rapid diagnosis of intracranial hemorrhage.
- Copyright
- © 2021 The Authors. Published by Atlantis Press B.V.
- Open Access
- This is an open access article distributed under the CC BY-NC 4.0 license (http://creativecommons.org/licenses/by-nc/4.0/).
ABBREVIATIONS
IHDC—Intracranial Hemorrhage Detection Challenge
RSNA—Radiological Society of North America
ICH—Intracranial hemorrhage
CT—Computed tomography
ML—Machine learning
SVM—Support vector machine
DL—Deep learning
CNNs—Convolutional neural networks
3D—Three-dimensional
LSTM—Long short-term memory
CAM—Class activation mapping
HU—Hounsfield units
MBConv—Mobile inverted bottleneck convolution
SE—Squeeze and excitation
GAP—Global average pooling
FC—Fully connected
W—Window width
L—Window level
ROC—Receiver operating characteristic
AUC—The area under the receiver operating characteristic
1. INTRODUCTION
Intracranial hemorrhage (ICH), or bleeding within the skull, is a life-threatening emergency with high rates of mortality and morbidity [1]. Without rapid and intensive medical treatment, it may cause increases in intracranial pressure, resulting in permanent brain tissue damage or brain herniation [2]. ICH is classified as either intra-axial hemorrhage (bleeding within the brain itself) or extra-axial hemorrhage (bleeding within the skull but outside the brain tissue). More specially, intra-axial hemorrhage has two subtypes: intraparenchymal (within the brain tissue) and intraventricular (within brain's ventricles). Extra-axial hemorrhage has three subtypes: epidural hemorrhage caused by trauma, subdural hemorrhage resulting from tearing of the bridging veins in the subdural space, and subarachnoid hemorrhage resulting from trauma or ruptures of aneurysms or arteriovenous malformations. Effective clinical intervention requires an urgent and accurate diagnosis for this life-threatening condition.
Computed tomography (CT) imaging of the brain, usually performed in the emergency department, is the initial diagnostic test for acute ICH. In CT images, the anatomic location and the pattern of bleeding indicate the potential cause of the ICH. Accurate interpretation is vital as a misdiagnosis (incorrect classification or missed ICH) may have clinical consequences [3–6]. In addition, analyzing CT images for certain types and locations of ICH by radiologists can be complicated and time consuming. Delays in diagnosis directly impacts time from onset to treatment for patients with ICH which may affect patient outcome [7,8]. An automatic diagnostic tool to assist just-in-time and accurate detection of ICH along with classification of its subtypes is essential to accelerate the decision-making process in clinical interventions to improve outcomes.
Machine learning (ML) algorithms have been exploited to detect traumatic brain injury using the support vector machine (SVM) model [9] and to predict cerebral ischemia in subarachnoid hemorrhage using various ML algorithms [10]. However, ML approaches require extensive image preprocessing, manual feature extraction, and selection steps; all of which are complicated and time-consuming. Deep learning (DL) methods, unlike ML algorithms, do not require explicit use of radiologic features, but explore the imaging information directly from the medical images by extracting thousands of image features through the use deep neural networks. Previous studies have reported using DL algorithms for the diagnosis of ICH. DL models have been applied on single CT image slices to improve the detection rate of suspected brain hemorrhage [11]. This study compared three CNNs with and without pretraining and found that pretraining on natural images improves the performance in medical image diagnosis.
Gray scale images such as those produced by CT scanners present a limited information problem to DL model. To solve this problem, multiple window settings (window width and level) have been used to improve the detection of subtle differences in brain tissues [12,13]. Another challenge in the computer assisted diagnosis of ICH is the fact that diagnostic information is not contained in just a single image, but from adjacent images as well. Previous work utilized three-dimensional (3D) convolutional neural networks (CNNs) to extract more anatomic information from the full brain scan volumes [14–16]. Grewal et al. developed a Recurrent Attention DenseNet (RADnet) model that combined the original DenseNet architecture with the attention components of neighboring slices to make ICH predictions on the per-scan-level [14]. Ker et al. generated image intensity histogram and removed overlapping image pixels that contributed to both normal and ICH cases before performing the classification [15]. However, 3D CNNs are computationally expensive, and often fail due to limited computer memory. Considering that ICH regions usually exist in 2–3 slices of the CT scan, it is not computational efficient to use 3D CNNs for the full scan volume. More advanced models that combined CNNs and a long short-term memory (LSTM) network have been proposed for detection and subtype classification of ICH in 3D CT by learning neighboring anatomic information, where CNNs extract discriminative features from each slice and the LSTM links these features across continuous slices [17,18]. Nguyen et al. proposed an end-to-end sequential model that attached LSTM architecture with CNNs to extract the spatial dependencies between slices [18]. These two studies [17,18] achieved good model performance using their local datasets, but showed decreased performance with external datasets, and the models were not able to generate visualization maps of the location and subtypes of ICH.
In this study, we developed a novel ensembled DL model to detect the occurrence of ICHs and simultaneously differentiate their subtypes. The ensembled DL model consisted of two parallel pathways, each using different sets of preprocessed images as the input to the CNN. One preprocessing method adjusted the window level/width to enhance the image contrast of brain tissue, blood, and soft tissue, respectively. The other preprocessing method utilized extended spatial anatomic information from adjacent image slices. The final model output was generated by ensembling the probability outcomes from the two network pathways. In addition, the class activation maps (CAMs) [19] were generated to highlight the regions of detected ICHs and the associated subtypes. Finally, we tested the model generalization by using an independent dataset acquired at a different institution. The hypothesis is that the ensembled DL model will provide a useful computer-aided diagnostic tool to assist in the rapid detection of ICHs with simultaneous subtype classification on CT images.
2. MATERIALS AND METHODS
2.1. DATASET
The Radiological Society of North America (RSNA) launched an Intracranial Hemorrhage Detection Challenge (IHDC) in 2019, which contained a total of 674,258 head CT reconstructed tomographic images acquired from 19,530 patients [20]. All images were labeled by 60 radiologists from different institutions, with a majority vote determining the gold standard for the label of each slice. If one or more hemorrhage spots were identified on a given slice by the radiologist, this slice was labeled as “any” and the associated subtype of each hemorrhage spot was provided as well (Figure 1). A given slice free of hemorrhage was labeled as “normal.” Datasets for training, validation, and testing were divided on a patient basis. CT exams acquired from 90% of all the patients were used for training and the other 10% for internal testing purposes (Table 1). The training subset was further divided with 20% of the subset used for validation of the training. This approach ensured reconstructed images from individual patients were not used in different cohorts. The whole dataset was imbalanced with 86% slices labeled as “normal” and 14% labeled as “any.” Subtype distributions were epidural 0.4%, intraparenchymal 4.8%, intraventricular 3.5%, subdural 6.3%, and subarachnoid 4.8%.
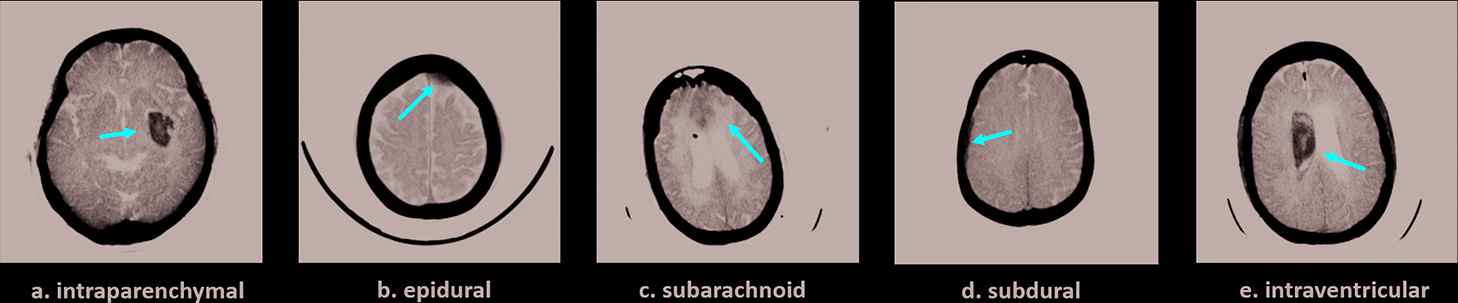
Examples of five subtypes of intracranial hemorrhage: (a) intraparenchymal (b) epidural (c) subarachnoid (d) subdural, and (e) intraventricular. The red arrow points to the location of each hemorrhage.
| Data Source | RSNA (674258 slices) | CQ500 (488 scans) | ||
|---|---|---|---|---|
| Cohorts | Training | Validation | Internal Testing | External Testing |
| Label: Normal | 415534 | 103803 | 57817 | 286 |
| Label: Epidural | 1959 | 521 | 281 | 13 |
| Label: Intraparenchymal | 23424 | 5839 | 3301 | 134 |
| Label: Intraventricular | 17046 | 4300 | 2420 | 28 |
| Label: Subarachnoid | 23227 | 5793 | 3102 | 60 |
| Label: Subdural | 30651 | 7722 | 4123 | 53 |
| Label: Any | 69997 | 17498 | 9609 | 202 |
Labelled class distributions of the RSNA IHDC dataset with the number of cases used in training, validation, and internal testing process. Also listed the number of cases of each class in the external testing dataset (CQ500). RSNA IHDC dataset labeling was slice-based. CQ500 labeling was scan-based.
In addition, a publicly available independent dataset CQ500 [21], acquired from a different institution in New Delhi, was used for external testing to evaluate the model generalization. This dataset included all five subtypes of ICH (Table 1), but the labels were based on the patient level and not slice level (i.e., each CT scan volume had one label).
2.2. Data Preprocessing and Augmentation
2.2.1. Multi-window preprocessing
Image windowing and level adjustment is a routine step taken by the radiologist to change the image brightness and apparent contrast to enhance the appearance of different types of tissues. When reading brain CT images, the radiologists usually choose to use a “brain” window that emphasizes detailed brain structures and subtle brain lesions [22], a “soft-tissue” window that improves the detection of bleeding locations and focal lesions, and a “subdural” window that highlights small collections of subdural blood, which otherwise can be obscured by the skull [22]. To mimic the way the radiologists read CT studies using different window settings for the pixel values in Hounsfield units (HU), we applied three different window level (L) and width (W) settings to enhance the display of brain tissues (L: 40, W: 80), subdural space (L: 80, W: 200), and soft tissues (L: 40, W: 380). All the windowed images were then normalized to [0, 1]. Each tomographic image thus generated 3 images with different window settings, which were fed to three input channels of the DL neural network (Figure 2[a]).
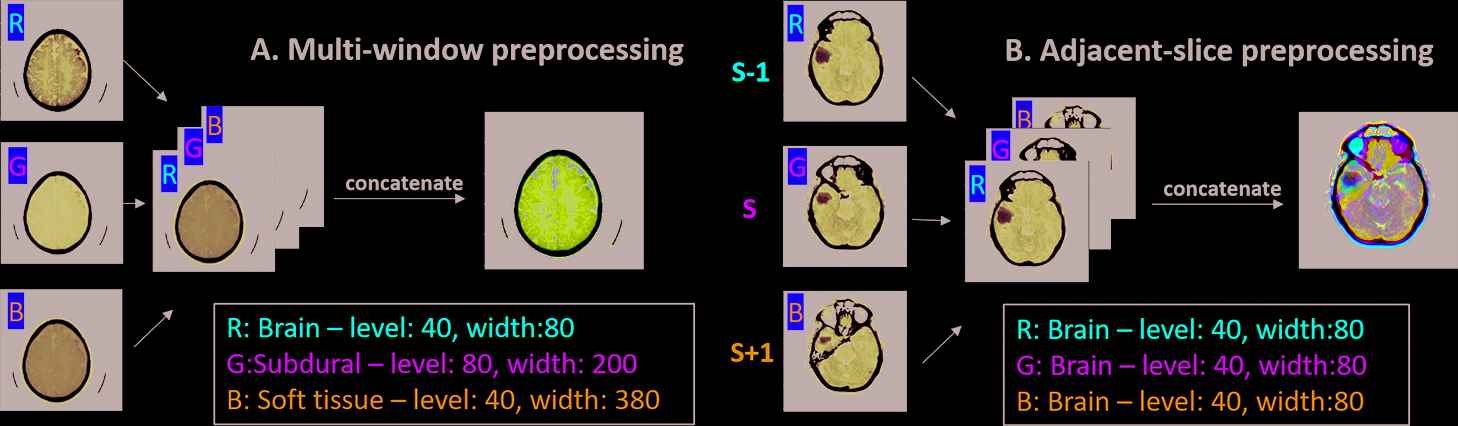
Two preprocessing methods: (a) multi-window preprocessing and (b) adjacent-slice preprocessing on a given CT slice. In (a), three window settings (brain, subdural, and soft tissue) were used to adjust image contrast. In (b), S is the center slice, and
2.2.2. Adjacent-slice preprocessing
Radiologists interpret studies through the review and observation of the entire scan volume, comprised of many reconstructed images. Diagnostic information related to a finding may appear on multiple contiguous images in the reconstructed volume. To mimic the radiologist's process, 3 image slices including a center slice with two adjacent slices were fed to the three input channels of the DL neural network (Figure 2[b]). All these image slices used the “brain” window (L: 40, W: 80) and were normalized to [0, 1].
2.2.3. Data augmentation
Several image transformation methods were applied to augment the data, including rotation, horizontal and vertical flipping, scaling, and brightness adjustment. Specifically, images were randomly rotated by degrees from −20° to 20°, scaled by a factor from 0.8 to 1.2, and the brightness was adjusted by −20%–20%. More data augmentations were implemented to the subtypes with smaller datasets to alleviate the data imbalance problem. For example, the total number of image slices of the epidural subtype increased by 10 times after augmentations.
2.3. DL Neural Network Model Architecture
2.3.1. Effeicient-B0 network
Our model was based on the recently proposed EfficientNet that achieved better accuracy and efficiency (6.1 times faster) with a smaller number of model parameters (8.4 times less) than other networks [23]. It has been applied to solve medical problems, such as the diagnosis of COVID-19 [24,25] and the classification of skin diseases [26]. EfficientNet utilizes a new scaling method, so-called compound coefficient, to systematically balance the depth (
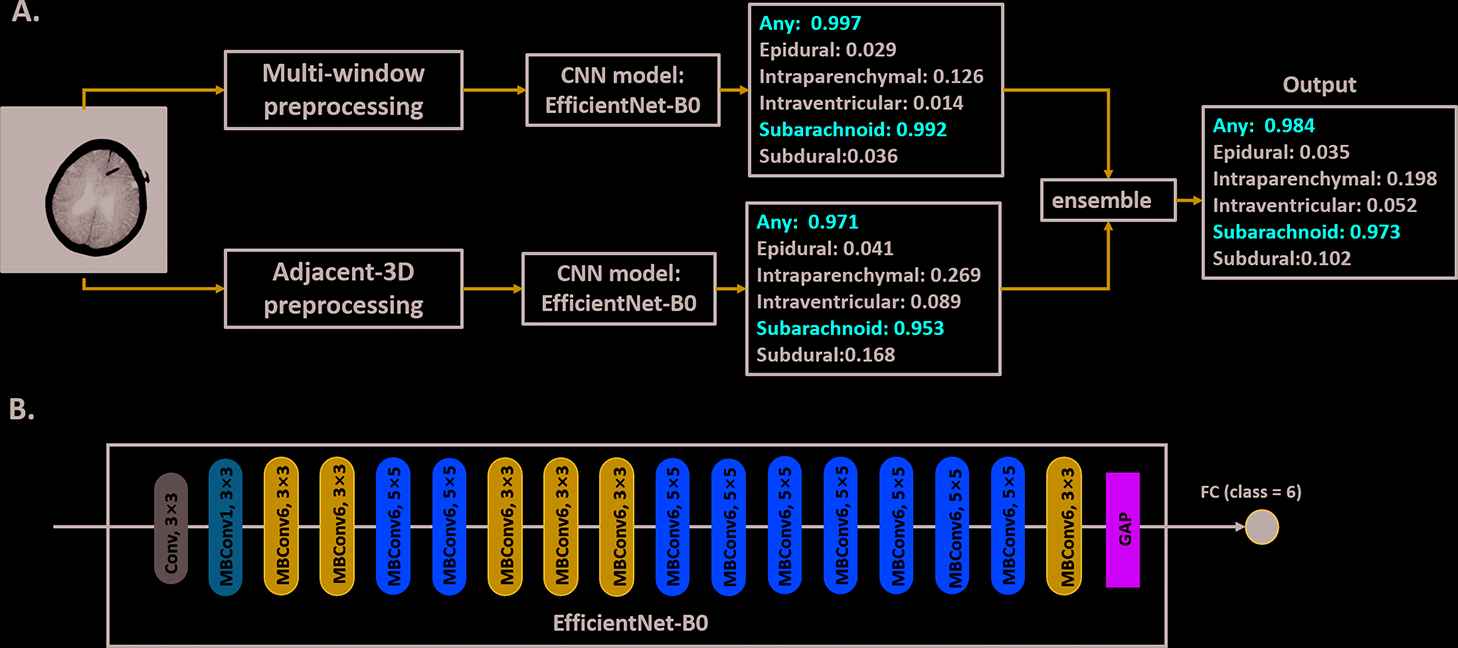
Schematic diagram of the ensembled neural network model (a) and architecture of the EfficientNet-B0 CNN model (b). In (a), two parallel pathways containing different preprocessing methods and its own EfficientNet-B0 CNN model were trained independently using the same input images. The outputs of each pathway (i.e., the probability of each predicted class) were averaged to generate the final results. A probability threshold of 0.5 was used to decide if the label of a specific class is true (probability > 0.5) or false (probability < 0.5). In (b), the EfficientNet-B0 model was composed of a single-layer convolutional layer (Conv) followed by a series of mobile inverted bottleneck convolution (MBConv) blocks with different kernel size, global average pooling (GAP), and fully connected (FC) layer.
In the proposed ensembled model, the EfficientNet-B0 network was used in two parallel pathways (multi-window preprocessing pathway and adjacent-slice preprocessing pathway). Each pathway predicted a probability number for 6 classes (i.e. hemorrhage detection (“any”) and 5 subtype classifications) on each slice. Lastly, the probability numbers generated by the two pathways were averaged to predict the final outcome. A specific class was deemed as true if the averaged probability > 0.5, whereas as false if the averaged probability < 0.5.
2.3.2. Loss function
A normalized weighted binary cross-entropy loss function was used in the training process to further compensate for the data imbalance problem. The overall loss was calculated by averaging six binary cross-entropy of each predicted class, defined as
2.4. Class Activation Mapping
Class activation mapping (CAM) [19] is a visualization method that backpropagated feature heatmaps onto the image to localize the discriminative feature regions for model prediction of the existence and subtypes of ICH. The gradient information of the predicted probability of a class
Finally, the heatmap
2.5. Network Training and Testing
The EfficientNet-B0 network was pretrained using the ImageNet database [29]. The EfficientNet-B0 network in each pathway of the proposed ensembled model was trained separately using the same training dataset from RSNA IHDC. During training, the weights of all the convolutional layers and MBConv blocks were frozen in the first 15 epochs, and only the last layer (i.e., the parameters between the global averaging pooling layer and the FC layer) were updated. Then, the network was fine-turned to further update the weights of all the layers in EfficientNet-B0 model, including Conv, MBConv blocks, GAP layer and FC layer. Other parameters included the following: input image size = 512 × 512, batch size = 8 for both training and validation, epoch = 50 with an early stop at epoch 10 in the multi-window pathway and at epoch 12 in the adjacent-slice pathway. The adaptive moment estimation (Adam) algorithm [30] was used to optimize the learning rate with the initial learning rate of 0.0001. The whole training process took 24.6 and 29.1 hours for the multi-window and adjacent-slice pathway, respectively.
Two datasets were used for testing, including the internal testing dataset from RSNA IHDC and an external testing dataset CQ500. As the CQ500 dataset only had patient-level labels, the entire CT scan was predicted as ICH positive if a hemorrhage was detected in any slice of the scan. The testing time for each single slice was less than 0.5 second on average. All training and testing processes were performed using Tensorflow2.0 in Python3.7 on a single GPU (NVIDIA GeForce RTX 2070 Super) workstation.
2.6. Statistical Analysis
The overall accuracy, sensitivity and F1 score for ICH detection and subtype classification in both internal and external testing datasets were calculated. F1 score is defined as the harmonic mean of precision and sensitivity (Eq. 4), often used to evaluate imbalanced dataset [31]. A receiver operating characteristic (ROC) analysis was performed. The area under the receiver operating characteristic (AUC) scores were calculated for ICH detection and each subtype classification in each network pathway and the ensemble network. The AUC scores were compared between the two pathway networks and the ensembled model using the pair t test. P value < 0.05 was considered statistically significant. All statistical analysis was performed using the Scipy library in Python3.7.
3. RESULTS
The ensembled model performance on the internal testing dataset was comparable to that of the training dataset (Table 2). In the internal testing dataset, the overall accuracy, sensitivity, and F1 score in detecting any ICH was 95.7%, 85.9%, and 86.7%. respectively. The performance for classifying five subtypes of ICH achieved an accuracy of [95.1%–98.6%], sensitivity of [79.2%–84%], and F1 score of [82.3%–85.9%], in which epidural hemorrhage classification showed the highest accuracy (98.6%) but the lowest sensitivity (79.2%) and F1 score (82.3%) likely due to the very small number of true positive cases in this subtype. In the external testing dataset (CQ500), the model achieved an overall high accuracy of 92.4%, sensitivity of 92.6%, and F1 score of 93.4% in detection of any ICH. However, the sensitivity and F1 score in classifying subtypes were relatively low, especially for epidural hemorrhage again likely due to the small sample size, i.e., 13 scans out of total 488 scans. The AUC scores were compared between the two separate network pathways and the ensembled network on internal testing dataset (Figure 4). The ensembled model achieved an AUC score of 94.3% for any ICH detection as well as 91.8%, 90.6%, 92.0%, 91.9%, and 94.2% for the subtypes of intraparenchymal, epidural, subarachnoid, subdural, and intraventricular hemorrhage, respectively. The ensembled network outperformed each separate pathway network in terms of ICH detection and subtype classifications (all p < 0.05).
| Subtypes of Hemorrhage | Internal Testing Data (RSNA, Slice-Based) |
External Testing Data (CQ500, Scan-Based) |
||||
|---|---|---|---|---|---|---|
| Accuracy (%) | Sensitivity (%) | F1 Score (%) | Accuracy (%) | Sensitivity (%) | F1 Score (%) | |
| Intraparenchymal | 97.3 | 81.5 | 83.6 | 95.3 | 91.7 | 91.4 |
| Epidural | 98.6 | 79.2 | 82.3 | 97.4 | 69.2 | 60.0 |
| Subarachnoid | 95.4 | 84.0 | 85.2 | 95.7 | 86.7 | 83.2 |
| Subdural | 95.1 | 81.1 | 83.9 | 94.1 | 81.1 | 74.8 |
| Intraventricular | 96.7 | 82.2 | 85.9 | 96.9 | 85.7 | 76.2 |
| Any | 95.7 | 85.9 | 86.7 | 92.4 | 92.6 | 93.4 |
The p < 0.05, so they are both statistically significant.
Accuracy, sensitivity and F1 score for model predictions of hemorrhage detection (“any”) and 5 subtype classification on RSNA IHDC and external CQ500 testing datasets.
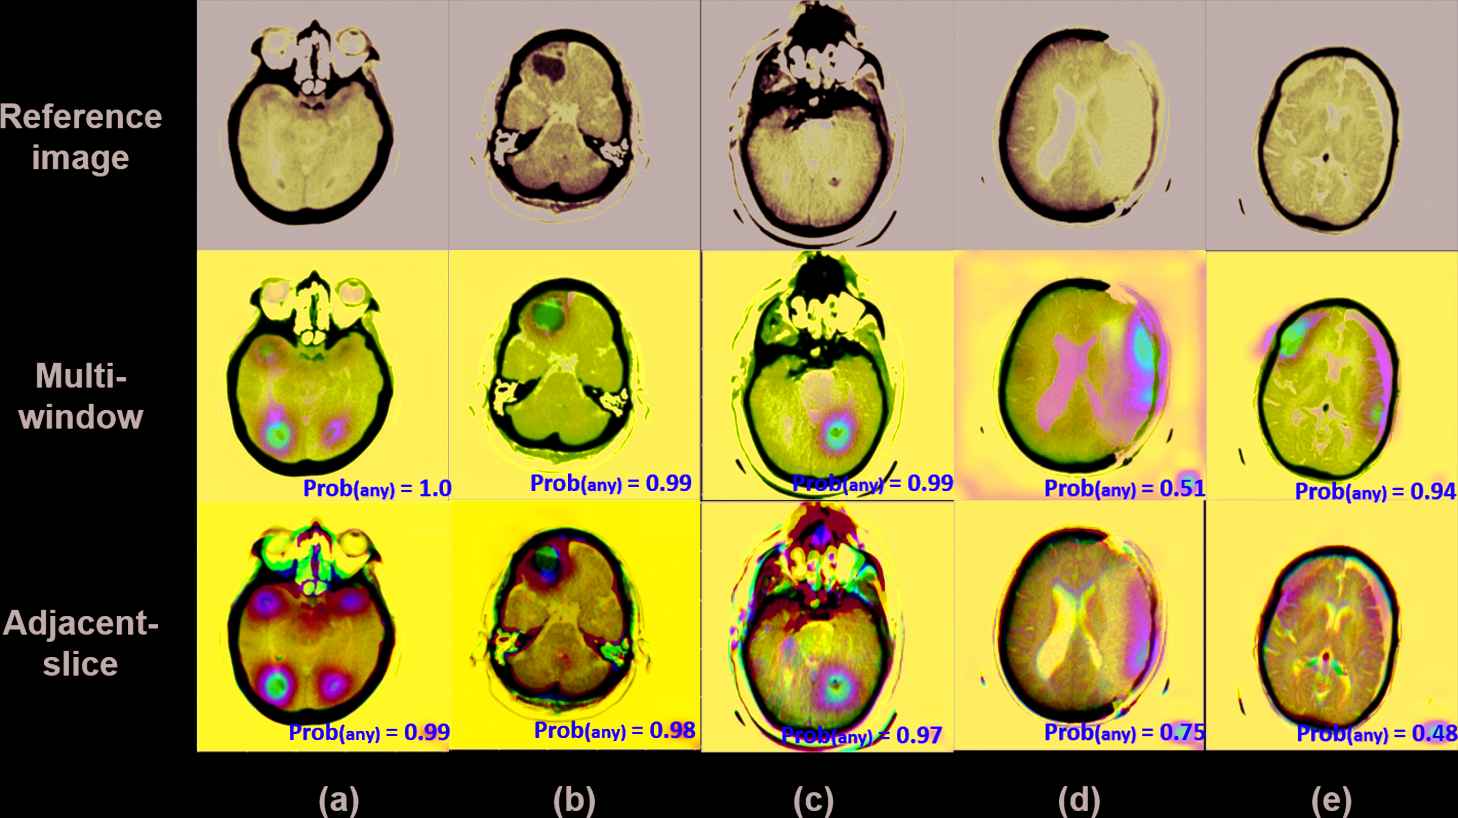
Examples of color-coded heatmap visualizations that revealed the locations of the detected hemorrhage spots overlaid on the reference image in both multi-window and adjacent-slice pathways. Prob (any) represents the probability of that slice predicted as “any,” indicating existing hemorrhage. High probability numbers in both pathways demonstrated similar hemorrhage locations (a–c), whereas different probability numbers predicted by the two pathways demonstrated distinct hemorrhage locations and patterns (d, e).
CAMs were generated from each pathway network to visualize the discriminative regions in model predictions of ICH location and subtype classification (Figures 5 and 6). The heatmaps demonstrated distinguishable ICH locations and associated confidence level (i.e., probability number) which may be used to guide radiologists to identify the hemorrhages. When the probability numbers given by the two network pathways were both high, the heatmaps generated from both pathways demonstrated similar locations (Figure 5[a–c]). For cases in which probability numbers were low the hemorrhage locations detected by the two pathways deviated from each other (Figure 5[d, e]). CAMs also demonstrated the locations of hemorrhage classified as specific subtypes (Figure 6[b, c]). In Figure 6, the probability numbers for the intraventricular subtype and subarachnoid subtype were both high (>0.98), and four hotspots were identified on the heatmaps with the bottom two predicted as intraventricular (Figure 6[b]) and the upper two predicted as subarachnoid hemorrhage (Figure 6[c]). The overall pattern of these two subtypes were consistent with that shown on the heatmap of any ICH detection (Figure 6[a]).
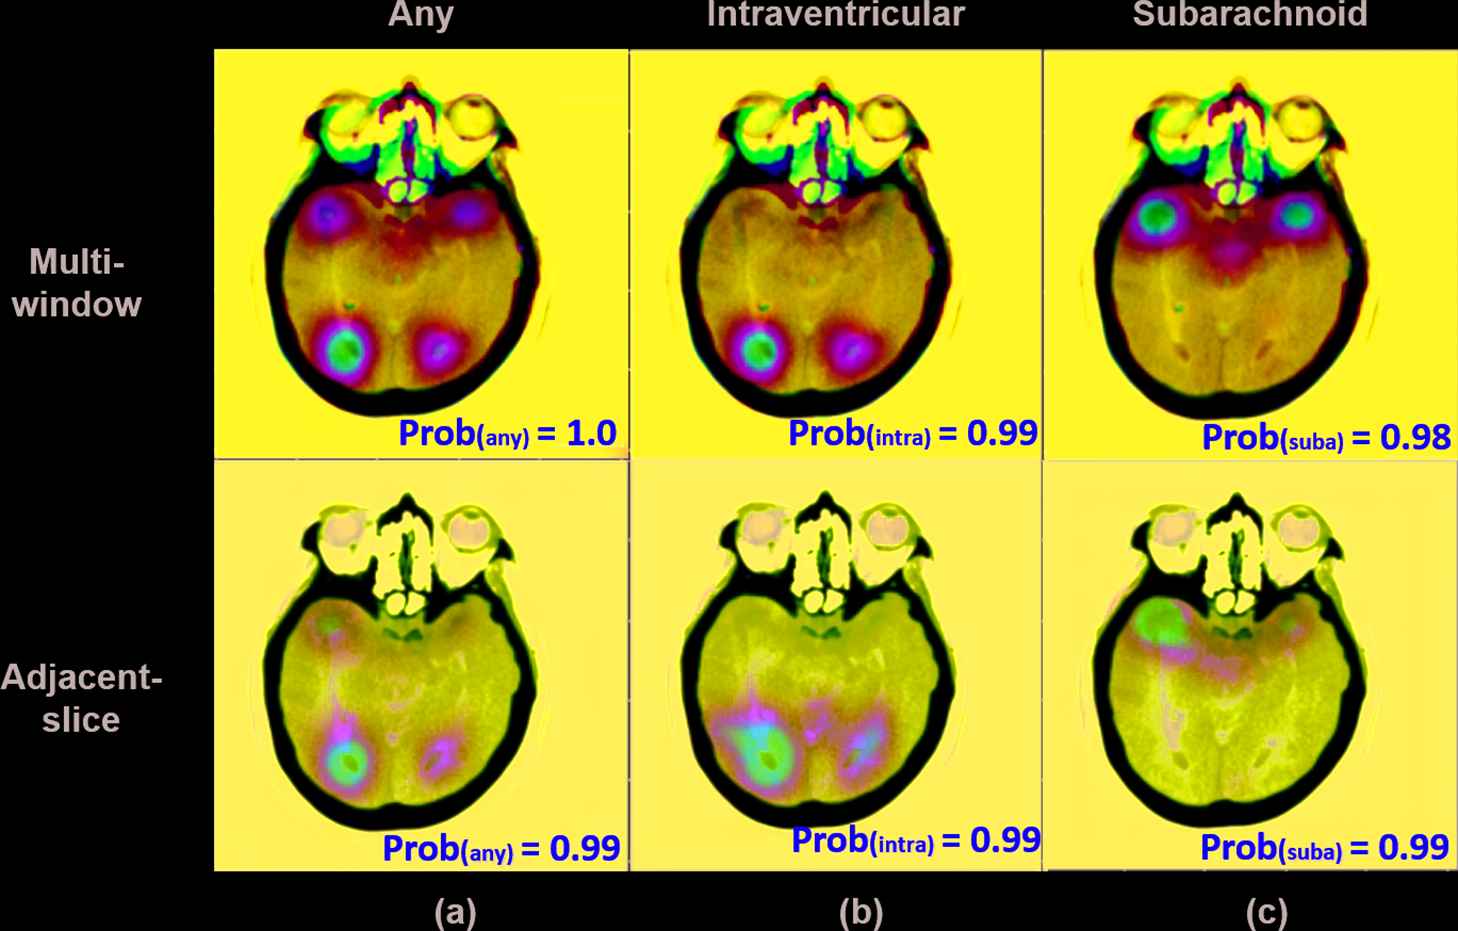
A reprehensive example of multiple detected hemorrhage spots identified as 2 different subtypes on one CT slice. Both subtypes (intraventricular and subarachnoid) showed high probability numbers in the two preprocessing pathways. Interestingly, the color-coded heatmaps revealed different locations of these two hemorrhage subtypes.
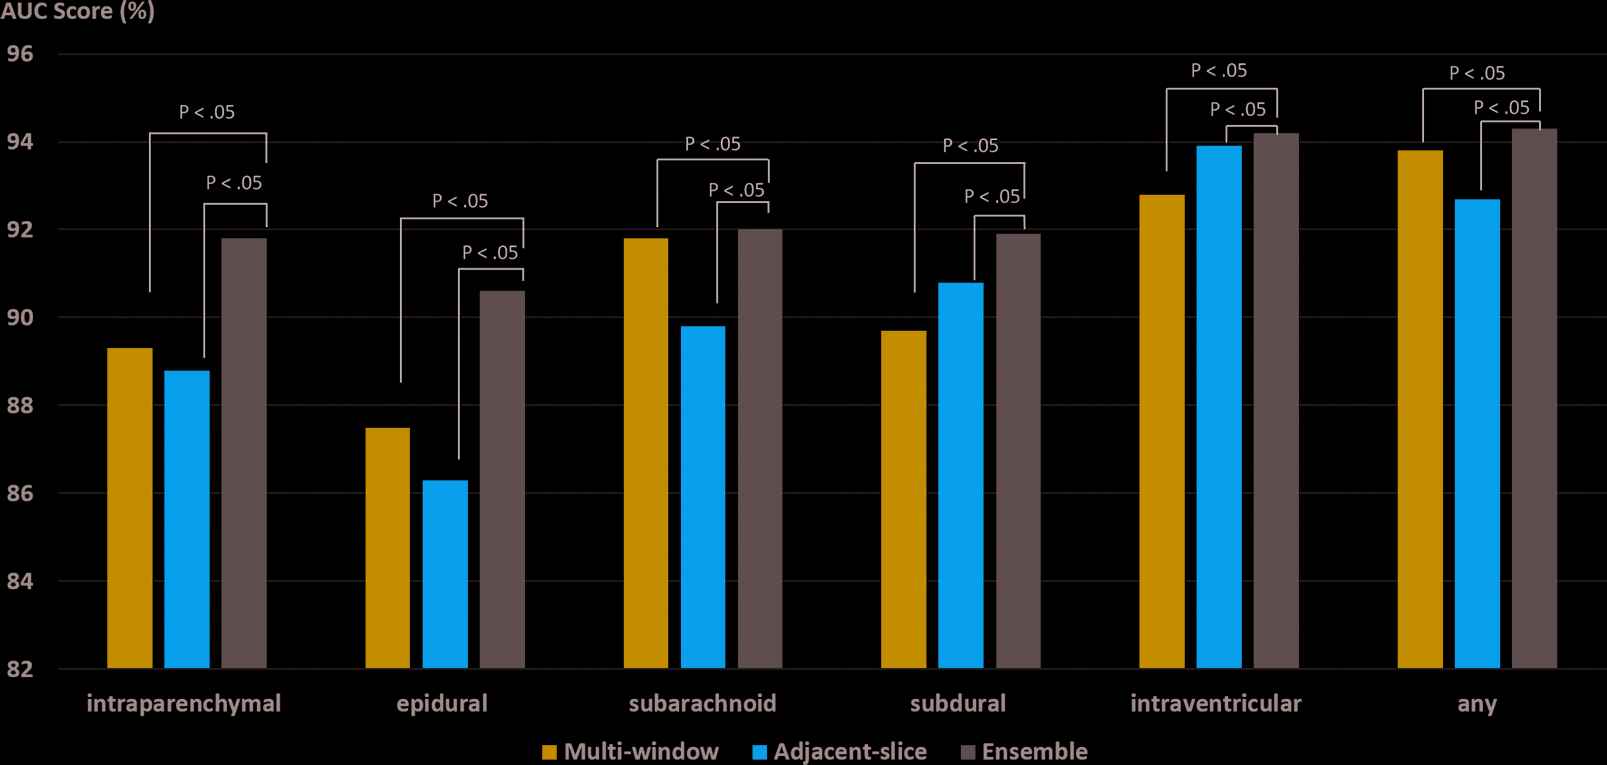
Comparisons of AUC scores for model predictions of hemorrhage detection (“any”) and 5 subtype classification using multi-window, adjacent-slice, and ensembled models on RSNA IHDC testing dataset. P < 0.05 indicates statistically significant.
4. DISCUSSION
In this study, we developed an ensembled DL model that provided simultaneous rapid detection assistance of IC and accurate classification of their subtypes based on noncontrast CT images. The novelty of this model included (1) ensembled two parallel network pathways with different input image preprocessing methods providing more image contrast and volumetric features; (2) the use of the EfficientNet-B0 network improving computational efficiency; (3) heatmaps with discriminative image feature patterns providing guidance for radiologists to quickly identify the locations and subtypes of the detected hemorrhages. More importantly, an external testing dataset that was independent from the training dataset was used to also evaluate the model performance and generalizability.
Previous work has demonstrated that the DL model ensemble approach achieves better performance by combining the strengths of multiple sub-models [32]. Chandra et al. used majority voting based classifier ensemble of five supervised classification models to detect COVID-19 on chest X-rays and found significantly improvements using the ensembled model [33]. Lee et al. combined four deep CNNs into an ensembled model to detect ICH and achieved high performance on a small-sized dataset [34]. Our model was inspired by the ensembled CNN concept. The multi-window pathway represented various image contrast settings manipulated by radiologists to highlight subtle tissue differences, and the adjacent-slice pathway leveraged extended structural information of the neighboring slices adjacent to the target slice. Because image features extracted from these preprocessed input images were different, the predicted outcomes from each network pathway may vary. Eventually, the ensembled model took the average of the probability numbers of two pathways to reduce the bias or uncertainty caused by either one of them. Also, two separate probability numbers provided radiologists more evidences to evaluate the model predictions. In addition, feature heatmaps generated by CAM provided visual guidance to help radiologists identify possible locations of ICH and interpret the model predictions.
Compared with other studies using the RSNA IHDC dataset to solve similar classification tasks, our model achieved a relatively better performance. Danilov et al. [35] trained a ResNexT model with multiple window settings and had the highest AUC score of 80.4% in predicting the intraventricular hemorrhage. Burduja et al. [17] took multiple feature embeddings extracted from the CNNs into another LSTM model and achieved an AUC score of 97% on the overall ICH detection, however, the AUC scores for 4 other subtype classifications (91%, 71%, 89%, and 94% for intraparenchymal, subarachnoid, subdural, and intraventricular hemorrhage) were lower than our corresponding AUC scores of 91.8%, 92.0%, 91.9%, and 94.2%.
A major limitation of the RSNA IHDC dataset used in this study was the extremely imbalanced distribution of ICH of subtypes. To alleviate this issue, data augmentation and a weighted binary cross-entropy loss method were applied to compensate for the subtypes with small datasets. High accuracy but low sensitivity and F1 score in our model performance was due to the small number of true positive cases in certain subtypes. Another limitation of the dataset was that the location of each hemorrhage spot and its subtype was not annotated on the image and thus the model generated visualization heatmaps lacked gold standard to compare with.
There are several other limitations to our study. First, the model performance was not compared with radiologists' diagnostic performance, however a recent study reported that the DL model outperformed radiologists [17]. Second, the three window settings used in image preprocessing were manually set. Recently, Karki et al. [12] proposed a trainable CNN to determine the optimal the window settings automatically, which may help further improve the classification model. Lastly, although the ensembled model combining two network pathways provided better classification outcomes compared with each individual pathway, more pathways are believed to contribute to a stronger ensembled model [36]. Future work includes increasing the number of network pathways, using more window setting combinations, and extracting related spatial information from more adjacent image slices. Local dataset from our own institution with more comprehensive location and subtype annotations will be acquired to further fine-tune and improve the model developed in this study.
5. CONCLUSION
In conclusion, a novel ensembled DL neural network was developed for automatic IC detection, localization, and classification into one of 5 subtypes. By using two network pathways in parallel, the emsembling results were significantly improved in both ICH detection and subtype classification compared with training each of pathway separately. Two visual mappings generated from the different pathways gave radiologists guidance to localize the ICH. Finally, the performance evaluated on an external dataset showed the model's good generalizability. Successful implementation of this tool may facilitate fast diagnosis and decision-making to guide clinical interventions in emergent settings.
CONFLICTS OF INTEREST
The authors declare they have no conflicts of interest.
AUTHORS' CONTRIBUTIONS
Y. W., M. S., and J. D. conceptualized the project, Y. W. performed research and build models, Y. W., and J. D. analyzed data, M. S., and J. D. contributed evaluations. Y. W., M. S., and J. D. wrote the paper.
ACKNOWLEDGMENTS
This research is partially supported by the Swim Across America Grant from Rush Translational Sciences Consortium. The authors would also like to thank Dr. Sharon E. Byrd for her administrative support in establishing the medical imaging artificial intelligence research program.
REFERENCES
Cite this article
TY  - JOUR
AU  - Yunan Wu
AU  - Mark P. Supanich
AU  - Jie Deng
PY  - 2021
DA  - 2021/06/23
TI  - Ensembled Deep Neural Network for Intracranial Hemorrhage Detection and Subtype Classification on Noncontrast CT Images
JO  - Journal of Artificial Intelligence for Medical Sciences
SP  - 12
EP  - 20
VL  - 2
IS  - 1-2
SN  - 2666-1470
UR  - https://doi.org/10.2991/jaims.d.210618.001
DO  - 10.2991/jaims.d.210618.001
ID  - Wu2021
ER  -