
An Entropy-Based Metric of Developer Contribution in Open Source Development and Its Application to Fault-Prone Program Analysis*
Presently with Energia Communications, Inc.
- DOI
- 10.2991/ijndc.2018.6.3.1How to use a DOI?
- Keywords
- Open source development; developer’s contribution; entropy; fault-prone program analysis
- Abstract
To support successful quality managements of open source software (OSS) projects, this paper proposes to measure the balance of developers’ contributions to a source file as an entropy. Through an analysis of data collected from 10 popular OSS projects, the following trends are reported: a source file is more fault-prone as the developers’ contributions to the file are more imbalanced (lower entropy), and the proposed metric can be useful for predicting fault-prone programs.
- Copyright
- © 2018, the Authors. Published by Atlantis Press.
- Open Access
- This is an open access article under the CC BY-NC license (http://creativecommons.org/licences/by-nc/4.0/).
1. Introduction
Open source software (OSS) products have become popular in the information technology-based business scene. Many commercial products or services are (partially) developed, maintained or operated by using OSS products such as Linux, Apache HTTP server, PostgreSQL, Firefox, Eclipse, OpenStack, etc. According to a survey on OSS products which was reported in June 20171, 60% of the survey respondents said their organizations’ use of OSS products increased in 2016. Another recent survey2 reported that 96% of application software products leverage some of OSS-based components. That is to say, OSS products play important roles in the successful development, maintenance and operation of many software products or services nowadays.
In general, an OSS product evolves through source code modifications aiming at function enhancements and/or fault fixes. Although code modifications are essential for the software evolution and upgrade, they have also risks of introducing new faults3. As OSS products become more popular, the importance of their successful quality managements gets higher. In order to support a successful quality management of OSS products, there have been studies focusing on software repositories which store a lot of data in regard to the software development and maintenance—these studies are referred to as the mining software repositories (MSR)4. In MSR studies, there have been many useful methods and empirical reports: data of fault fixes in the past are utilized to predict faulty programs5,6; Co-change relationships among source files are analyzed and applied to a successful maintenance support7,8; Commits to code repositories (code changes) are analyzed to evaluate the impacts of those changes on the future changes9,10, and those commits are examined to assess the risk that their changes introduce new faults11,12, etc.
While the source code and their changes are remarkable research materials for the MSR studies, the human aspects—e.g., “who created the source file,” “who made the code change,” “how developers collaborate in the OSS project,” etc.—have also become noteworthy points of view in recent years13,14,15,16,17,18,19. By analyzing code repositories, we can see the development history of each source file. There would be a diversity in the development and maintenance of a source file from a viewpoint of the developer’s contribution to it: for example, one source file was created by a developer and it has been maintained by only the same original developer, but another file may have been maintained by two or more developers other than the original developer, etc. Since a success of an OSS project highly depends on the productive contributions by developers, it is worthy enough to understand developers’ contributions and the collaborations among different developers in more depth toward a better quality management of OSS project.
In this paper, we collect data of developers’ contributions to source files by mining their code repositories, where a developer’s contribution to a source file is defined to be the total lines of code in which the developer has been involved throughout all versions of the source file—from the initial version to the current one. Although the previous work13,14,15 also measured a developer’s contribution as the lines of code touched by the developer, the measurement was made at only the current version of the source file. On the other hand, our metric of developer’s contribution takes into account not only the current version but also all older versions. Here we briefly explain the reason why we introduce another point of view (see Section 2 for the details): Suppose a developer d1 newly wrote some source lines. After that, all of these lines were touched (some tokens in the lines were modified) by another developer d2. In such a case, the contributions to those source lines look to be made by only d2 if we measure it by focusing only on the current version of the code; In other words, the contributions by d1 were regarded to be totally overridden by d2 if we observe only the latest source lines. Although developer d2 modified those lines, it may not be reasonable to totally omit developer d1’s contribution. Hence, we propose to measure a developer’s contribution by focusing not only the current version of source file but also all older versions in this paper.
In general, there can be a lot of variations in the balance of contributions to a source file—for example, (1) “single” case where the contribution is made by only a certain developer, (2) “well-balanced” case where the contribution is approximately equally made by two or more developers, (3) “highly-imbalanced” case where the contribution is made by two or more developers but it is a monopoly of one of the developers, etc. To evaluate the balance of contributions to a source file in a quantitative manner, we propose to apply the notion of entropy20 to the measurement of the contribution balance. Then, we categorize source files in accordance with their types of contributions (entropy values), and compare the fault-proneness of source files among the categories in order to see which category is more fault-prone and required more careful reviews.
The key contributions of this paper are as follows.
- 1)
We measure a developer’s contribution to a source file development and maintenance while taking into account not only the current version of the source file but also the all older versions. Then, we propose an entropy-based metric to evaluate the balance of developers’ contributions to a source file.
- 2)
We conduct a data analysis on the development history of many source files from 10 popular OSS projects, and report the following findings:
- (i)
Source files developed and maintained by a single developer are likely to be less fault-prone than other source files.
- (ii)
The fault-proneness of source file tends to get much higher when it shifts from a single-developer maintenance to a highly-imbalanced multi-developer maintenance.
- (iii)
The proposed entropy-based metric can be a useful explanatory variable together with the lines of code (LOC) in a fault-prone prediction model using the random forest21.
- (i)
The remainder of this paper is organized as follows. Section 2 describes the measurement of developers’ contributions to a source file and our proposal of an entropy-based metric for measuring the balance of contributions among developers. Then, the section presents our research questions. Section 3 reports our data analysis and gives discussions of the results. Section 4 briefly describes the related work. Finally, Section 5 presents our conclusion and future work.
2. Developer’s Contribution and Entropy-Based Metric
In this section, we describe a developer’s contribution to a source file development and maintenance, and propose an entropy-based metric for evaluating the balance of contributions among developers in order to quantitatively characterize the structure of the developers’ contributions. Then, we set up our research questions to clarify the aim of our data analysis.
2.1. Contribution to Source File Development and Maintenance
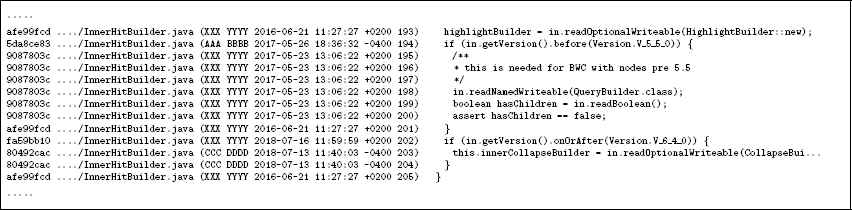
A source code repository of a software project stores the source files and their change history. From the repository, we can easily obtain the following information: “when and who created a source file,” “when and who changed the source file,” “which parts of the source file were changed,” etc. For instance, Fig. 1 presents a part of commit log from the repository of an OSS project‡. The log is obtained by running git log command with -p option.

An example of a repository log (the author’s name and address are masked by dummy ones, and the file pathes are partially omitted).
From Fig. 1, we see that “XXX YYYY” committed InnerHitBuilder.java at 11:59:59 (+0200) on July 16, 2018. The commit is identified by the hash fa59bb10999b20d487ff12a890ee8cfa0f414826. Through the commit, two lines in this file were changed: the heads of changed lines were denoted by symbols “−” or “+,” and a “−” line and a “+” line show the contents before and after the code change, respectively.
By analyzing these data, we can observe the contributions of developers (authors in the example shown in Fig. 1) to the development and maintenance of the source file. For example, given a source file, we can investigate “who have been involved in its development and maintenance” and “how many source lines of code have been added, deleted or changed by each of the developers.” They form a history of contributions by developers to a source file. Different source files have different histories of developers’ contributions. While one source file may have been developed and maintained by only a certain developer, another source file may have been done by many different developers. Moreover, for the latter kind of source file, there would be many variations in the structure for cooperation among developers. For example, suppose two developers d1 and d2 have contributed to a set of source files. While one source file may have been dominantly maintained by d1 and the contribution by d2 is a little, another source file may have been evenly maintained by both d1 and d2. Our research interest is to analyze how such differences of contributions affect the code quality, especially, the fault-proneness of source files.
Notice that we focus only on the change history stored in the code repository in order to see a developer’s contribution; there are also other types of contributions such as the code reviews, tests and discussions. Although it is ideal to take into account all kinds of contributions, it is hard to collect all of such data from any OSS project. Since the code repository is commonly available at any OSS project, we will limit our focus of “contribution” to the code changes in this paper. That is to say, we measure a developer’s contribution by counting the lines of code which the developer has been involved in.
From the code repository, we can also easily investigate who is the author of each line: Fig. 2 shows an example output of git blame command. Each line in the figure consists of the hash (short version), the file path, the author name, the commit date, the line number and the line contents, respectively. The commit hash and date correspond to the last change on the line. That is to say, by checking the data, we can see who made each line of the current version of the source file. For example, there are three different developers in the figure, and “XXX YYYY,” “AAA BBBB” and “CCC DDDD” are authors of ten lines, one line and two lines, respectively. A straightforward way of measuring these developers’ contributions is to use the above lines of code on which they play the authors. Indeed, some previous work13,14,15 adopted such a measure and conducted various studies.
An example of a line author investigation (the authors’ names are masked by dummy ones, and the file paths are partially omitted).
However, the above measurement has a lack of consideration in regard to the history of code changes. To explain the missing point, let us consider a simple example shown in Fig. 3. This example represents the updates of a source file, where there are five versions of the file and the updates are made by three developers d1, d2 and d3; their update events are given in Table 1. In the figure, the hatched parts signify the lines whose final author is d2, i.e., d2 is the developer who last touched these lines. At the current version (version 5), d2 becomes the final author of all lines of this source file. Although three developers d1, d2 and d3 have contributed to the development and maintenance of this source file, this file looks a product made by only d2 if we measure the developer’s contribution by counting the lines of touched code at the current version. In other words, the contributions by d1 and d3 are not taken into account in the measurement.
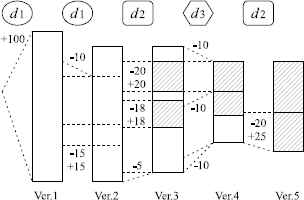
An example of source file updates (the parts finally made by d2 are hatched).
| Ver. | Who | Event |
|---|---|---|
| 1 | d1 | created the source file (added 100 lines) |
| 2 | d1 | deleted 10 lines, and modified 15 lines (deleted 15 & added 15) |
| 3 | d2 | modified 20 lines (deleted 20 & added 20), modified 18 lines (deleted 18 & added 18), and deleted 5 lines |
| 4 | d3 | deleted 30 lines (deleted 10 × 3) |
| 5 | d2 | modified 15 lines (deleted 10 & added 15) |
Code change history shown in Fig. 3.
Hence, we propose to use the “cumulative” lines of code changed by each developer in the contribution measurement. There are two key reasons why we focus on the cumulative changed lines rather than the current lines. One reason is that we consider a deletion of source code to be a contribution as well. Even if a developer just deleted some source code from a source file at a commit, it is one of essential modifications to build the current version of the source file. Thus, we should not avoid considering a code deletion in order to evaluate a developer’s contribution. Another reason is that there can be two different developers before and after a code modification. Suppose developer di modified a source code which was originally written by different developer dj. Although the modification is a di’s contribution, it may be based on the original code and that is a dj’s contribution. Thus, it would be reasonable to take into account not only di but also dj for evaluating their contributions.
We formally define the developer’s contribution.
Definition 1 (Developer’s Contribution)
Given a source file f, and a developer d has an experience with a code change of f. We define c(f, d) be the contribution of d to f, which is the total number of source lines added to or deleted from f by d until the current version§.
To see the difference of the contribution measurements between the proposed metric and the previous one—the cumulative lines of touched code through all versions vs. the lines of touched code at the current version—, Table 2 presents both of them in the above example shown in Fig. 3 and Table 1.
| Ver. | proposed metric | previous metric | ||||
|---|---|---|---|---|---|---|
| d1 | d2 | d3 | d1 | d2 | d3 | |
| 1 | 100 | 0 | 0 | 100 | 0 | 0 |
| 2 | 140 | 0 | 0 | 90 | 0 | 0 |
| 3 | 140 | 81 | 0 | 47 | 38 | 0 |
| 4 | 140 | 81 | 30 | 19 | 36 | 0 |
| 5 | 140 | 126 | 30 | 0 | 60 | 0 |
A comparison of developers’ contributions measured by the proposed metric and the previous one.
While d3 made code deletions when the update to version 4, his/her contribution is not expressed by the previous metric and it continues to be zero for all versions. On the other hand, the proposed metric counts the contribution (see Table 2). Since the proposed metric cumulatively counts the lines of touched code, the difference between two metric values gets larger as more upgrades are made. At the current version (version 5), although the previous metric shows that d2 is the only developer who contributed to the file, the proposed metric evaluates that the file has been developed and maintained by mainly d1 and d2, and a contribution by d3 is also not null. This example shows an importance of our viewpoint and our motivation in this paper.
2.2. Contribution Entropy
We have just defined a developer’s contribution to a source file as the cumulative number of source code lines which the developer has added to or deleted from the file. When n (⩾ 2) developers have contributed to a source file, there are a lot of variations in the balance of contributions among n developers. For example, one of the developers may have dominantly contributed to the source file and the contributions by the remaining n − 1 developers may be really small. For another example, all of n developers may have approximately equally contributed to the source file. The difference of these two example cases may cause a remarkable difference in the quality of source files. Now we propose to evaluate the balance of developers’ contributions by introducing a metric using the notion of entropy.
The notion of entropy is well-known as a measure of information randomness in the information theory20. When there are n possible events and the i-th event occurs with probability pi (for i = 1, …, n), the entropy H is computed by
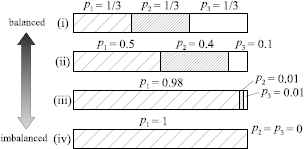
Examples of balanced and imbalanced distributions of p1, p2 and p3.
For each example of (i)–(iv), the entropy (H) is computed as follows.
- (i)
- (ii)
- (iii)
- (iv)
The entropy gets higher as the probabilities are more balanced. That is to say, we can use the entropy as a measure of balance among things. The examples (i) and (iv) are the maximum case and the minimum case, respectively.
Next, we apply the notion of entropy to a measurement of developers’ contribution balance. By regarding the rate of a developer’s contribution to all developers’ contributions as the probability in the entropy equation, we can evaluate a balance of contributions among developers. We will call it “contribution entropy” and formally define as follows.
Definition 2 (Contribution Entropy)
Given a source file f, and suppose that n developers di (for i = 1,…,n) have experiences with code changes of f. Let c(f, di) be the contribution of di to f. Then, the following pi(f) is a measure of the relative contribution to f by di (for i = 1,…,n):
We define the contribution entropy of f as:
This metric focuses on the source lines which have been changed by each developer, and quantifies the balance of these changed lines among developers as an “entropy.” When f has been developed and maintained by a single developer, it means n = 1 so we have H(f) = 0. When f has been developed and maintained by two or more developers, H(f) varies from 0 to 1 in accordance with the balance of pi(f) among n developers. If all pi(f)’s are equal, i.e., all developers’ contributions to f are truly equal, we get H(f) = 1. As the contributions get more imbalanced among developers, H(f) becomes lower. That is to say, as the contribution structure of f gets closer to a certain developer’s monopoly, H(f) becomes closer to 0.
As a previous study, Taylor et al.13 proposed the “author entropy.” They focused on “who is the author of each source line” in a source file, and the author entropy evaluates the balance of source lines among authors (developers). While the author entropy is an attractive measure of developers’ contributions to a source file, there is a lack of consideration in regard to the code change history—it focuses only on the current version of the source file—as we already explained with using examples shown in Fig. 3 and Tables 1, 2.
In the example case shown in Table 1, we have c(f, d1) = 140, c(f, d2) = 126 and c(f, d3) = 30 just after version 5. From Eqs.(2) and (3), we get
While all lines of f just after version 5 look to be ones made by only d2 (see Fig. 3), d1 has more contributions than d2 if we focus on not only the current state but also the change history of f; if we focused only on the current state (version 5) of f, the contribution is considered to be a monopoly of d2 and H(f) becomes zero.
2.3. Research Questions
In this section, we have introduced metrics for measuring the developer’s contribution and for evaluating the balance of contributions among developers. By using these metrics, we can quantitatively observe a structure of contributions and cooperations among developers in the development and maintenance of a source file. Here, we have the following simple question in regard to the relationship between the observed structure of developers’ contributions and the source file quality: “what type of contribution structure is the riskiest in terms of the code quality?” If we can see that a certain type of structure— characterized by a certain value range of contribution entropy—is risky, we can properly alert risky source files, which need more careful code reviews, during the maintenance activities, and it would be a help for an efficient and successful quality management.
Since the notion of code quality covers a broad range of topics, we will focus on the fault-proneness of source files in analogy with a lot of previous MSR studies. That is to say, a risky source file means a fault-prone source file in this paper.
To make the aim of our study in this paper clear, we set up our research questions (RQs) as follows. For the sake of convenience, we will call a source file which has been developed and maintained by two or more developers as a “multi-developer file,” and a source file which has been done by a single developer as a “single-developer file,” respectively. Similarly, we call the former-styled maintenance as the “multi-developer maintenance,” and the latter one as the “single-developer maintenance,” respectively.
RQ1: Is there a difference in the fault-proneness between multi-developer files and single-developer files?
RQ2: When a source file is a multi-developer file, can the balance of the developers’ contributions be useful for predicting the fault-prone source files?
We explain the reasons why we set the above questions.
RQ1 is a fundamental question if the difference of developers’ contributions to source files is related to the fault-proneness. Needless to say, a source file can be classified into two categories: 1) multi-developer files, and 2) single-developer files. An involvement of more developers to the maintenance of a source file might be better to enhance the code quality because the code would be reviewed by more people. However, there might also be an opposite effect: such an involvement might cause unnecessary confusion in the coding. Shortly, RQ1 is our simple question: “which is better” in terms of the fault-proneness, multi-developer maintenance or single-developer maintenance?
Next, RQ2 is a further question on the relationship of developers’ contributions with the fault-proneness of source files. As mentioned above, there would be various structures for cooperation in the maintenance of multi-developer files, i.e., there are variations in the balance of developers’ contributions. The aim of RQ2 is to clarify if the balance of developers’ contributions can be a useful metric for predicting fault-prone source files.
3. Data Analysis
On our RQs mentioned in Section 2.3, we conducted a data analysis using popular OSS projects. In this section, we report and discuss the results.
We investigated 10 popular OSS projects shown in Table 3: The data collection was performed at the end of November 2017. In order to ensure the generality and usefulness of our results as high as possible, we selected them: they all ranked in top 10 Java projects in terms of “stars” at the GitHub. Moreover, their domains are not biased toward a certain one.
| Project | # of Source Files | # of Commits | Domain |
|---|---|---|---|
| Butter Knife | 125 | 279 | Library for Android |
| Elasticsearch | 5,527 | 16,671 | Search engine |
| Glide | 609 | 1,382 | Library for Android |
| Guava | 3,131 | 4,054 | Library for Java |
| Java Design Patterns | 1,011 | 885 | Design patterns implemented in Java |
| Kotlin | 5,090 | 21,406 | Programming language |
| MPAndroidChart | 235 | 1,216 | Library for Android |
| OkHttp | 291 | 1,344 | HTTP+HTTP/2 client |
| Retrofit | 210 | 535 | HTTP client |
| RxJava | 1,497 | 731 | Reactive extensions for JVM |
| total | 17,726 | 48,503 | |
Investigated OSS projects.
3.1. Procedure
We conducted our data collection and analysis in the following procedure.
- 1)
Make a copy of the repository from the GitHub by using git clone command.||
- 2)
Get the development history of each source file from the repository.
For each source file included in the current version, we investigate its development history (change logs) by using git log command. In the investigation, we trace the renaming operations to the file as well.
- 3)
Extract data items required for our analysis.
By analyzing the commit logs that we got at step 2), we extract the following items for each commit of each source file: (a) commit hash, (b) whether it is aimed at fixing a fault or not, (c) author’s name, (d) author’s e-mail address, and (e) changed source lines.
The item (b) is decided if the corresponding commit message contains a fault-fix-related keyword or not22.
- 4)
Organize the data collected at step 3).
Since there are source files which were renamed through commits, we assign unique file IDs to source files in order to identify them.
There may be an author who uses two or more different names or e-mail addresses on the repository. We integrated the duplicated author data by the following set of rules—it is a simpler version of the algorithm proposed by Bird et al.23: (1) if two authors have different addresses but the same name, then we regard them as the same author; (2) if two authors have the same address but different names, then we regard them as the same author.
- 5)
Analyze the collected data on RQs.
For RQ1:
- (i)
For each source file f, decide whether f is a single-developer file or a multi-developer file at the end of the observation period (see Fig. 5), and check if a fault fix is occurred at f during the examination period or not. Here, the observation period signifies the days in which we check the development and maintenance of the source file, and the examination period corresponds to the days in which we decide the file is faulty or not. Since a new source file may be immature and require some fixes, we empirically set the observation period as one year from the day that f was newly created, and the examination period as three months from the end of the observation period, respectively.
- (ii)
Randomly select the same numbers of source files from each project, and build out dataset for the analysis. As shown in Table 3, the numbers of source files vary widely among the investigated OSS projects. If we use all of them in our analysis, the results would be highly influenced by the large-scaled projects’ trends. To mitigate such a bias, we decided to randomly select the same number of source files from each of the projects. In consideration of the minimum-sized project (Butter Knife), we select 100 source files from each project. Since there are 10 projects, our dataset consists of 1000 source files.
- (iii)
Classify the set of source files into two subsets: the set of single-developer files and that of multi-developer ones. Then, compare their rates of faulty source files (the fault rates: FRs). A higher FR value means a higher fault-proneness of source files in the corresponding subset.
- (i)
For RQ2:
- (i)
For each source file f included in our dataset (built in the step RQ1(ii)), compute its contribution entropy, H(f), at the end of the observation period (see Fig. 5). Then, we check if a fault fix is occurred at f during the examination period or not.
- (ii)
Classify the set of source files into five subsets according to their contribution entropy: C0, C1, C2, C3 and C4. C0 is the set of source files such that H(f) = 0, i.e., the set of single-developer files. The remaining source files are categorized into C1 – C4 corresponding to equally divided ranges of H(f): C1, C2, C3 and C4 correspond to 0 < H(f) ⩽ 1/4, 1/4 < H(f) ⩽ 2/4, 2/4 < H(f) ⩽ 3/4 and 3/4 < H(f) ⩽ 1, respectively (Table 4).
After that, compare FRs among C0 – C4.
- (i)
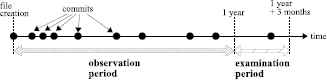
Observation period and examination period.
| Category | Contribution Entropy |
|---|---|
| C0 | f (f) = 0 |
| C1 | 0 < H(f) ⩽ 1/4 |
| C2 | 1/4 < H(f) ⩽ 2/4 |
| C3 | 2/4 < H(f) ⩽ 3/4 |
| C4 | 3/4 < H(f) ⩽ 1 |
Source file categories by their contribution entroipes.
3.2. Results for RQ1
On RQ1, we compared the set of single-developer source files and that of multi-developer ones in terms of the fault-proneness. Table 5 and Fig. 6 show the results.
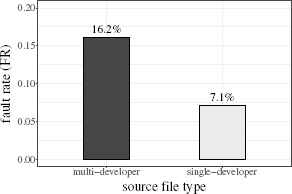
Comparison of the fault-proneness: multi-developer source files vs. single-developer ones.
| File type | FR |
|
|---|---|---|
| multi-developer | 16.2% | (105/650) |
| single-developer | 7.1% | (25/350) |
| total | 13.0% | (130/1000) |
Comparison of single-developer source files and multideveloper ones.
As a result, the multi-developer files are about two times more likely to be faulty than the single-developer one: 16.2% vs. 7.1%, and their difference was statistically significant at a 1% significance level.**
3.3. Discussions for RQ1
In order to examine a difference in the fault-proneness between multi-developer files and single-developer files, we compared the fault-proneness (fault rate: FR) of the multi-developer source files with that of the single-developer ones. Then, we got the result showing that a multi-developer file tends to be more fault-prone than a single-developer one, and the FR of multi-developer files is about two times higher than that of single-developer ones—16.2% vs. 7.1%. In general, it is not easy to properly update a program written by other people. Hence, such a difficulty may cause the above striking difference between the two types of source file.
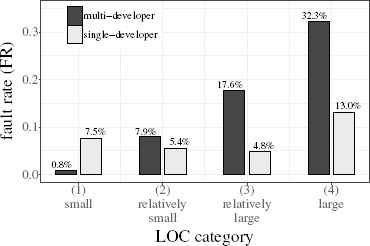
Here, we have a concern that the program size might be a confounding factor in our results. Since a larger program is more likely to be faulty in many cases, we cannot omit the impact of the program size. Thus, we perform the above FR comparison for the dataset stratified by the program size as well: we categorize source files by their program size, and compare the FRs between multi-developer files and single-developer ones within each category; We use the lines of code (LOC) as our metric of program size since it is well-known metric which is highly related to the fault-proneness of programs24. According to the distribution of LOC values in our dataset, we decided to categorize the source files into the following four categories:
- (1)
“small” whose LOC ⩽ 17;
- (2)
“relatively small” whose LOC > 17 and ⩽ 48;
- (3)
“relatively large” whose LOC > 48 and ⩽ 119;
- (4)
“large” whose LOC > 119,
Comparisons of the fault-proneness within LOC categories.
| LOC category | File type | FR |
|
|---|---|---|---|
| (1) small | multi | 0.8% | (1/132) |
| single | 7.5% | (9/120) | |
| (2) relatively small | multi | 7.9% | (13/164) |
| single | 5.4% | (5/92) | |
| (3) relatively large | multi | 17.6% | (28/159) |
| single | 4.8% | (4/84) | |
| (4) large | multi | 32.3% | (63/195) |
| single | 13.0% | (7/54) | |
Comparisons of multi-developer files and single-developer within LOC categories.
As Fig. 7 shows, the magnitude relationship of FR between multi-developer files and single-developer files is the same as the total result shown in Fig. 6, except for LOC category (1)—small-sized source files. Moreover, the gap of FR between file types gets larger when the source file becomes larger which are in LOC categories (3) or (4). The differences of FRs are statistically significant at 1% significance level in LOC categories (3) and (4), but not significant in categories (1) and (2)††.
As mentioned above, a successful update of other programmer’s code is not easy task. The difficulty would increase as the program gets larger since the programmer has to properly comprehend more source lines and moreover the program structure would be more complex. Therefore, it seems to be natural that the gap of FR becomes larger in the LOC categories (3) and (4)—relatively-large or large source files. Similarly, as the program gets smaller, a proper comprehension and update of code would become easier even if the code was written by other programmers. Furthermore, in general, a smaller program originally tends to be less fault-prone. Hence, it would be a natural result that there is no significant difference of the FR values between the small-sized multi-developer files and the small-sized single-developer ones.
Notice that the above results are derived from the data of “fault fix” but not of “fault creation.” There may be a case such that: a fault was introduced into a source file when the file was a single-developer one, and then the fault was detected and fixed after the file became a multi-developer one by a participation of another developer. One of key reasons why more faults were detected and fixed in multi-developer files might be that more developers reviewed these files. In other words, a single-developer file might have latent faults which have not been detected yet because the file has been maintained by a certain developer only. Although our focus on whether a source file is a single-developer file or not seems to be noteworthy through this data analysis, we have to do a more detailed analysis in the future: a further analysis on when the fixed faults were introduced.
3.4. Results for RQ2
On RQ2, we classified the source files into five categories C0, C1,…, C4 by their contribution entropy, and compared these categories in terms of the fault-proneness. Table 7 and Fig. 8 show the results.
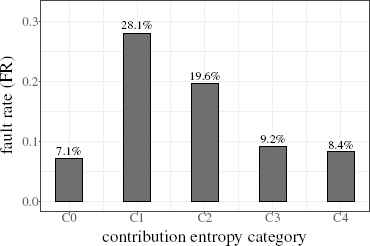
Comparison of source files categorized by their contribution entropy.
| Entropy category | FR |
|
|---|---|---|
| C0 | 7.1% | (25/350) |
| C1 | 28.1% | (43/153) |
| C2 | 19.6% | (33/168) |
| C3 | 9.2% | (15/163) |
| C4 | 8.4% | (14/166) |
Comparison of source files categorized by their contribution entropy.
As a result, the least fault-prone category is C0 whose contribution entropy is zero, i.e., the category of the single-developer files. In contrast, the most fault-prone category is C1 which is right next to C0. Category C1 corresponds to source files in which the developers’ contributions are highly imbalanced. The fault-proneness (the FR value) decreases as the contribution entropy gets higher, i.e., as the structure of contributions gets away from the most imbalanced state.
3.5. Discussions for RQ2
In order to investigate the impact of contribution balance among developers on the fault-proneness, we categorized source files by their contribution entropy into five categories C0 – C4, and compared their FR values. As a result, multi-developer source files in category C1 are the most fault-prone. In such a source file, there are two or more developers who have had contributed to the file, but their contributions are highly-imbalanced and one of the corresponding developers is dominant. That state of source file would be made when the source file was just changed from the single-developer maintenance to the multi-developer maintenance. By a participation of another developer in the maintenance of a source file, it seems to become unstable in terms of the code quality and the most fault-prone.
Since the trend of FR values shows a monotonically decreasing from C1 to C4, we can predict that a multi-developer source file is likely to be more fault-prone as its contribution entropy gets smaller.
We can consider the following two potential reasons why C1 is a fault-prone category of source file: (1) a fault was created by a new developer through a code modification, or (2) a fault was detected by a new developer. In general, a code modification has a risk of creating a fault25,26. Since it is not easy task to accurately comprehend and properly change a source code written by other programmers, the fault-creation risk would get higher when a code change is made by a new developer. In another perspective, a participation of a new developer includes another code review. Then, a latent fault might be detected as a result of code review by a new developer. In both cases, more faults may be detected from source files of category C1. On the other hand, source files in categories C2, C3 or C4 tend to be more changed and reviewed more times by two or more developers. Through those code changes and reviews, the source files may be polished and become less fault-prone. Because our data is based on fault-fix events in the repository, we cannot clearly analyze the above potential reasons in this study. In order to examine the reason why C1 is so fault-prone and the fault-proneness gets lower as the contribution entropy becomes higher, we need to perform a further analysis using data of “fault creation” in the future.
As with the above discussion on RQ1 (Section 3.3), it would be better to analyze the impact of the program size (LOC) on the results as well. Although we originally considered dividing each of C0 – C4 into four subcategories in accordance with the above four LOC categories, the devision made small-sized categories—e.g., the subcategory of C1 corresponding to the small-sized programs (LOC category (1)) has only 9 source files. Since there were such small-sized categories, we considered it is hard to properly compare the subcategories by using their FR values. That is to say, it is difficult to discuss the change of fault-proneness over the contribution entropy while stratifying source files by their LOC. Thus, as a yet another way of analysis, we build a fault-prone prediction model whose explanatory variables are LOC and the proposed entropy metric. If the impact of LOC is dominant in the fault-prone prediction, the proposed entropy metric cannot contribute to the prediction when it is used together with LOC.
While there are many types of prediction models, we build a model using the random forest method which is a promising way of predicting fault-prone programs27. The random forest-based prediction model use two metrics as its explanatory variables— the LOC of a source file and the contribution entropy of the file—, and predicts whether the source file is faulty or not. The random forest can present the importance of each explanatory variable according to the Breiman’s method28 in a quantitative form. Table 8 shows the importance of two metrics in the random forest model, where a larger value means a higher importance. In the table, the dataset “all” signifies the all source files included in our dataset, i.e., the importance values on the row are computed from the random forest model which was built by using not only the multi-developer files but also the single-developer ones; the dataset “multi-developer file only” means that the corresponding random forest model was built by using only the multi-developer files.
| Dataset | LOC | Contribution entropy |
|---|---|---|
| all | 93.9 | 92.0 |
| multi-developer file only | 84.1 | 87.8 |
Importance of explanatory variables (metrics).
As the results, the importance values showed that the proposed metric—the contribution entropy— plays an important role in the fault-prone prediction even if it is used together with the LOC. Especially, when we focus only on the multi-developer source files, the proposed metric outperforms the LOC. Since all single-developer files’ entropies are zero, such a data separation would enhance the performance of the entropy metric. While the LOC metric is one of promising metrics to predict fault-prone programs, the proposed entropy metric can contribute to the prediction as well. As we saw in Fig. 7, the contribution entropy can be useful in detecting fault-prone programs when they are large-sized ones. Moreover, category C1 would be a hot spot of fault-prone programs as shown in Fig. 8. These characteristics of the proposed contribution entropy metric would help a more precise prediction of fault-prone programs.
3.6. Threats to Validity
We analyzed popular OSS projects whose main-development language is Java. Since our data collection method does not depend on any Java-specific feature, we can perform a similar analysis to other projects developed in other languages without any changes of our method if their code is maintained with Git. Since OSS projects written in other languages may show different trends, it is a threat to the validity regrading the generality of our findings, and our significant future work.
In order to ensure quality of code, some OSS projects have strict checking (reviewing) systems for a code change proposed by a developer. Such a checking system may have a large impact on our results of data analysis. To mitigate such a threat to validity, we collected data from various OSS projects in different domains. Moreover, to avoid any project-specific bias, we randomly selected the same number of source files from each of the projects. We plan to perform a further analysis focusing on project-specific features in the future.
To examine if the proposed metric can contribute to a fault-prone program prediction, we leveraged the random forest model. It is a popular and widely-used model in the fault-prone prediction studies. However, its computation (model construction) requires many parameters and these parameters can affect the computational results. That is to say, if we use a different set of parameters in the model construction, a different result might be obtained in our analysis. Since the decision of their parameters can be a yet another threat to validity, we used default parameters (settings) of randomForest package of R in our computation to avoid any bias regarding the parameter decision. A further study on a better parameter turning is our future work.
4. Related Work
Bird et al.14 focused on an ownership of a source file: an ownership metric in their paper is the percentage of commits made by major contributors. They reported that a source file having lower ownership is likely to be more fault-prone. Aman et al.18 performed a survival analysis of the time to fault fix, and proved the trend such that a source file modified by a new developer has a shorter time to the occurrence of the next fault fix. These previous work showed a risk of transiently increasing the fault-proneness of a source file by a participation of other developers in the maintenance of the file. While the notion of such a risk is common to this study, we performed a finer-grained data analysis which is at a source line-change level rather than a commit level.
Matsumoto et al.19 proposed developer metrics and utilized those metrics for predicting faults in modules. Through an empirical study using a dataset of the Eclipse Platform project, they showed that their developer metrics can be useful explanatory variables in fault-prone module prediction models. Moreover, they reported that a module which has been touched by more developers tends to be more fault-prone. While their findings are consistent with our result for RQ1 mentioned above, we have also performed an analysis of the relationship with the source file (module) size in this paper. Furthermore, we have studied multi-developer files in terms of the balance of developers’ contributions rather than the number of developers.
Posnett et al.15 focused developers’ contributions from both the perspective of developer and that of module. In the former perspective, they quantified the degree to which a developer contributes to a certain module; in the latter one, they evaluated the degree to which a module is contributed by a certain developer. Through a data analysis, they reported that a developer who has contributed to a certain module tends not to create a fault, i.e., he/she would be a specialist of the maintenance of the module; a module which is contributed by more developers may be fault-prone. While we also have the latter perspective of their work, we analyzed the balance of contributions as well in this paper.
5. Conclusion
We focused on the cumulative contributions of developers to the development and maintenance of a source file, and proposed a novel metric, contribution entropy, to evaluate the balance of contributions to the file.
We performed a data analysis of source files from 10 popular OSS projects. As the results, the following trends were founds: (1) a source file maintained by two or more developers tends to be more fault-prone than a file maintained by a certain developer only. The fault-proneness of the former-type source file is about two times higher than that of the latter-type one; (2) when a source file has been maintained by two or more developers and the developers’ contributions are more imbalanced, the source file is more fault-prone; (3) the proposed metric can be useful for predicting fault-prone source files even if it is used together with the lines of code.
From the results, the fault-proneness of a source file seems to be transiently increased when the file’s maintenance structure shifts from a single-developer maintenance to a multi-developer one, i.e., when another programmer started to change a part of the code. A successful OSS quality management would be prompted by focusing on such changes as well.
In order to understand a more detailed impact of another programmer’s participation, we plan to check not only fault-fix commits but also fault-introducing commits, and analyze who made the corresponding code changes as our significant future work. Moreover, to predict the code quality stability, we will examine the impact of number of contributing developers on the quality, and investigate changes in the contribution entropy over time. Other our future work includes: (1) a further analysis using OSS projects whose development languages are other than Java to examine the generality of our findings, and (2) an application of our results to the just-in-time quality assurance studies.
Acknowledgments
This work was supported by JSPS KAKENHI #16K00099 and #18K11246.
Footnotes
An earlier version of this paper was presented at the 3rd IEEE/ACIS International Conference on Big Data, Cloud Computing, and Data Science Engineering (BCD2018).
That is available from https://github.com/elastic/elasticsearch.git.
One line modification is regarded as one line addition after one line deletion. Thus, the contribution is expressed as two lines of changed code.
In the example (iv), there is only one possible event because p2 = p3 = 0.
The repository URLs are https://github.com/{akeWharton/butterknife, elastic/elasticsearch, bumptech/glide, google/guava, iluwatar/java-design-patterns, JetBrains/kotlin, PhilJay/MPAndroidChart, square/okhttp, square/retrofit, ReactiveX/RxJava}.git.
The null hypothesis “the FR in multi-developer files is equal to the FR in single-developer files” was rejected by a χ2 test with χ2 = 15.546, df = 1 and p value < 8.053 × 10⁻⁵.
(1) χ2 = 5.8335, df = 1 and p value = 0.01572; (2) χ2 = 0.24359, df = 1 and p value = 0.6216; (3) χ2 = 6.8509, df = 1 and p value = 0.00886; (4) χ2 = 6.9028, df = 1 and p value = 0.008606.
References
Cite this article
TY  - JOUR
AU  - Kazuki Yamauchi
AU  - Hirohisa Aman
AU  - Sousuke Amasaki
AU  - Tomoyuki Yokogawa
AU  - Minoru Kawahara
PY  - 2018
DA  - 2018/07/31
TI  - An Entropy-Based Metric of Developer Contribution in Open Source Development and Its Application to Fault-Prone Program Analysis*
JO  - International Journal of Networked and Distributed Computing
SP  - 118
EP  - 132
VL  - 6
IS  - 3
SN  - 2211-7946
UR  - https://doi.org/10.2991/ijndc.2018.6.3.1
DO  - 10.2991/ijndc.2018.6.3.1
ID  - Yamauchi2018
ER  -