
Empirical Research on the Growth Path of China’s Industrial Economy under the Background of Supply-side Reform
- DOI
- 10.2991/ijndc.k.200217.002How to use a DOI?
- Keywords
- Overcapacity; supply-side reform; vector regressive model; industrial economic growth
- Abstract
Supply-side reform has provided opportunities for China’s industrial economic growth, but also experienced unprecedented challenges. Based on the background of supply-side reform, this paper applies the supply-side theory. First, it explores the mechanism between industrial overcapacity and economic growth from the macro perspective by using the two-sector production theory, and concludes that overcapacity is an important factor affecting economic growth. Then, based on the econometrics theory, a vector-autoregression model with quarterly time series was established, quarterly data of the past 12 years were selected, and relevant indicators were empirically analyzed and tested. From an empirical perspective, it was pointed out that the obstacle to China’s economic growth path lay in excess capacity. The research shows that excess capacity is the key factor that affects the development path of China’s industrial economy. In the end, this paper points out that the reduction of capacity has a positive impact on China’s industrial economic development.
- Copyright
- © 2020 The Authors. Published by Atlantis Press SARL.
- Open Access
- This is an open access article distributed under the CC BY-NC 4.0 license (http://creativecommons.org/licenses/by-nc/4.0/).
1. INTRODUCTION
The report to the 19th national congress mentioned the supply-side reform once again based on the achievements made, and emphasized that the modernization of the economy should focus more on improving the quality of the supply system, accelerating the building of a strong manufacturing country and the development of advanced manufacturing. During the transition period, China’s economy is undergoing periodic changes and systematic adjustments. This is a stage of adjustment in which China actively seeks for rebalancing after the equilibrium relationship between major variables in the stage of high-speed growth is broken.
Product supply and demand in China from the planned economy era “shortage” to “surplus” supply and demand of market economy, this should is the result of the normal operation of a market economy cycle, but the production capacity of the “supply” too “requirements” to a certain extent, overcapacity problem is particularly prominent, its rapid development of economy also can produce certain effect. In particular, the outbreak of the financial crisis in 2008 hit the real economy of the world severely. China’s comprehensive economic index Gross Domestic Product (GDP) also reached a new low in previous years, and the industrial economic growth rate in line with it was also reduced to a large extent, especially the steel, nonferrous metals and other industries are in a particularly serious dilemma. Although the slowdown in economic development is influenced by cyclical factors such as changes in the global economic environment, it is more importantly affected by endogenous structural problems and other factors.
The fundamental traditional growth mode is no longer sustainable and has reached a stage that requires systematic adjustment. Four trillion plan is one of the Chinese government in 2008 ways to overcome the economic crisis, although at the time of the effect of promoting economic growth played a, but some in the industry have contributed to the energy intensive and highly polluting industries of blind development, it is to a certain extent, this has deepened the overcapacity industries, excess capacity increasing, the industry is limited in the direction of rapid and sound development. Overcapacity will hinder the sound, rapid and steady development of China’s economy to some extent. However, blind cutting of overcapacity may lead to unemployment, deflation, financial non-performing loans and other risks. Since 2015, when cutting overcapacity topped the list of the five major tasks, the policy has yielded initial results.
The contribution of industrial added value to GDP growth in 2017 was 0.54% points higher than in 2016. Based on the quarterly industrial data in recent decades, this paper analyzes the impact of excess capacity on China’s industrial economic development and the impact of the existing policy on China’s industrial economic growth, and then puts forward some reasonable suggestions on the policy.
The concept of “overcapacity” first showed up in Chamberlain’s Theory of Monopolistic Competition. Through empirical analysis by using the purchasing power parity method, it can be concluded that China will not obtain obvious economic growth if simply relying on resource utilization to promote economic development, and China should rely on technological innovation to stimulate substantial economic growth. Barry Naughton describes and evaluates the development of China’s economy by using an empirical analysis in the book “The Chinese Economy: Transformation and Growth”. He believes that China’s reform should be focused on technological innovation. Studies by domestic scholars in the field of industrial de-capacity: through economic growth model, Wu Jinglian concluded that China’s industry should abandon the traditional model, take the innovative industrial road, and he pointed out the optimal production model and method for the development of China’s economic growth. Yang Zhen [1] believes that the excess of industrial capacity has a great relationship with the low efficiency of resource allocation. Solving problem of overcapacity is not only to reduce output, but also to analyze the market and adjust the structure. Huang Qunhui [2] found that Chinese industry is heading to a direction beneficial to China’s economic growth, which is the new normal as we say now. Different from our past extensive development mode, it focuses more on structural reforms as a concentrated manifestation of the low-cost industrialization strategy and the conflict of insufficient China’s institutional reform. Han Guogao [3] proposed to solve problems in the current stage of China’s industry by focusing on the utilization efficiency of production capacity, increasing the producer price index and the profitability of the coal industry, reducing the excessive interference of local governments, and effectively exerting the resource allocation function of the market so as to promote the healthy development of the economy. Han Guogao and Hu Wenming [4] concluded that capacity utilization improvement has a positive effect on industrial investment efficiency by using a Vector Autoregressive (VAR) model as measurement method.
To sum up, based on the current domestic and foreign literatures on overcapacity analysis, there are few theoretical analysis and empirical analysis of economic growth based on the macro two-sector theoretical model. According to the de-capacity intensity at current stage, this paper has analyzed the effects of industrial capacity utilization, the growth rate of industrial fixed asset investment, and the total number of employees in the industrial sector on economic growth from the theoretical and empirical perspectives.
2. THEORETICAL BASIS
2.1. Basic Meaning of Overcapacity
Overcapacity in economics can be mainly defined in both macro and micro aspects. The macro-level explanations are mainly focused on two parts demand and supply. When the actual capacity (or capacity output) of the supply side is larger than the capacity of the demand, the phenomenon that the resources cannot be fully utilized in the market will appear, which is overcapacity; the micro-level explanation refer to that output quantity under normal capacity is not higher than the capacity generated after the capacity reaches a certain level; in the industry it is believed that the output of the industry is lower than its capacity in a certain time [5]. The academia’s definition of capacity can be concluded in the following three parts: First, from the mathematical point of view: establish a production function, and apply economic principles to find the maximum point of the production function [6]. Second, assuming no consideration of the actual situation, it is the level that the company’s output can achieve (Klein et al., 1973). Third, it is the level of output that can be achieved when profit maximization is obtained [7]. According to the domestic and overseas literature, this paper chooses capacity utilization as an index of quantifying capacity output.
2.2. Two-sector Growth Model
The template is used to format your paper and style the text. All margins, column widths, line spaces, and text fonts are prescribed; please do not alter them. You may note peculiarities. For example, the head margin in this template measures proportionately more than is customary. This measurement and others are deliberate, using specifications that anticipate your paper as one part of the entire proceedings, and not as an independent document. Please do not revise any of the current designations.
Basic assumptions of the model: (1) Assume that social production can be divided into two sectors, i.e., the industrial sector (denoted as E) and the non-industrial sector (denoted as N); (2) the production factors of the two sectors are mainly influenced by fixed capital input (K) and the influence of labor capital (L) in two parts; (3) The industrial sector has an external spillover effect on the non-industrial sector. Y is the total outputs of the two sectors, K, L represent the total capital and total labor input of the two sectors, YE, YN are the total output of various industrial and non-industrial sectors, and KE, LE refer to the capital input and labor input of various sectors of industry. KN, LN are non-industrial sectors: capital and labor input.
The production functions of both industrial and non-industrial sectors are presented in the form of implicit functions. Assume that the input factors of the industrial and non-industrial sectors are labor and capital, the production functions are
Following can be obtained by respectively complete differential of formulas (1)–(5)
Among them, the economic equilibrium condition is: the marginal productivity of labor in two sectors is equal to the productivity of capital edge, i.e.
The second hypothetical element resources are not optimally allocated, and the marginal production of elements differs between sectors, and assumes that the differences are equal, both are θ, then the relationship between the marginal production of the sectoral elements can be defined as follows:
Convert the formula (11) and obtain:
Divide Y in formula (14) bilaterally at the same time and obtain:
For
As the economic growth of the entire country except for the industrial production sector is a huge economy, the overall growth is close to the GDP growth, this paper chooses constant parameter method. If the economic growth rate is presented by g (.), the formula (15) can be converted to
3. ANALYSIS ON THE INFLUENCING FACTORS OF CHINA’S INDUSTRIAL ECONOMIC GROWTH
3.1. Data
Based on the principles of data validity and availability, the quarterly data for 13 years from 2004 to 2017 were selected to analyze the impact of overcapacity on economic growth by using time series data analysis methods. The VAR model was used as an econometric model to analyze the data. Among them, the selection of data and the economic growth are greatly influenced by industrial equipment utilization, the completion of industrial fixed assets investment, the number of industrial employees as an independent variable indicator, the economic growth rate as a dependent variable indicator. These indicators are used as model variables to measure the mutual changes and effects between these indicators.
3.2. Variable Selection and Description
Variables selected in this paper based on the theoretical model include: output increment, labor increment, capital increment, and industrial capacity utilization. Among them, Y is output increment, with the ratio of the difference between the GDP of the current period and the output of the previous period as an indicator of growth; L: labor increment, calculated as the ratio of the total labor force in the current period and the previous period; K: capital increment is calculated as the ratio of the total capital stock in the current period to the total capital stock in the previous period; CU is the rate of industrial capacity utilization.
3.2.1. Rate of industrial capacity utilization
Considering the unique status of China’s industrial development, the official statistics on industrial capacity utilization are not sound enough. Therefore, based on the basic characteristics of China’s industry, this paper selects 5000 households’ business condition diffusion index as the index of capacity utilization. The lager the index data, the higher the level of industrial capacity utilization. The smaller the index data, the lower the industrial capacity utilization level. This paper uses as the rate of industrial capacity utilization.
3.2.2. Economic growth index
To guarantee model validity the measurement accuracy, and to directly reflect the influence degree of de-capacity on the current China’s economic development situation, based on referring to domestic and overseas economic growth literature, this paper has selected growth value of GNP as a measure of economic growth to better reflect the economy. The economic growth rate of this article is denoted as the GDP growth rate ln(gdp).
3.2.3. Labor growth index
Based on data availability, quarterly data of the three manufacturing industries, mining, electricity, gas and water production and supply were selected as model data. Considering these three industries as the main industries, the proportion of employees in the industrial sector accounts for the largest, and laborers’ employment situation can also show the resource utilization status of all industrial employees at a certain stage. This paper uses ln(cp) as labor growth rate.
4. VAR MODEL BUILDING AND TEST
When researching the economic growth models, it is necessary to clearly distinguish between exogenous variables and endogenous variables during traditional regression analysis. But variables in actual life influence each other. If internal and external variables cannot be distinguished, the model results will have a certain misleading effect. For this phenomenon, Sims [8] put variables affecting economic growth together and systematically studied the impact of variables on economic growth without distinguishing between endogenous and exogenous variables as a whole, and then predicted economic growth, which is the current well-known vector Auto regression model in economics research (VAR model).
4.1. Stationarity Test
A time series VAR model is built in this paper which is prone to spurious regression problems. In order to avoid this problem, stability test is required. There are many methods to test the stability of each variable. This paper chooses DF test method to check the stationary according to the characteristics of the selected variable data (Table 1).
| Variables | DF statistics | 10% Critical value | 5% Critical value | 1% Critical value | p-value | Conclusion |
|---|---|---|---|---|---|---|
| ln(gdp) | −2.498 | −2.601 | −2.927 | −3.581 | 0.122 | Instable |
| D(ln(gdp)) | −2.965 | −2.601 | −2.927 | −3.581 | 0.046 | Stable |
| ln(cu) | −2.747 | −2.601 | −2.927 | −3.581 | 0.074 | Instable |
| D(ln(cu)) | −3.531 | −2.601 | −2.927 | −3.581 | 0.011 | Stable |
| ln(cp) | −4.432 | −2.601 | −2.927 | −3.581 | 0.001 | Stable |
| ln(cr) | −1.102 | −2.601 | −2.927 | −3.581 | 0.708 | Instable |
| D(ln(cr)) | −4.511 | −2.601 | −2.927 | −3.581 | 0.001 | Stable |
DF test results
At the 5% significance level, the test results for the variable industrial fixed asset investment growth rate (ln(cp)) can pass, while the economic growth rate (ln(gdp)), industrial capacity utilization (ln(cu)), and the industrial employment population (ln(cr)) pass the test after the first-order differential. Therefore, the data of D(ln(gdp)), D(ln(cu)), D(ln(cp)) and D(ln(cr)) will be used in this paper to establish a VAR model.
4.2. Co-integration Test and Model Building
Considering that there are unit roots in the selected variables, first-order difference was used to establish a stable time series. But the economic significance of these differentially processed variables may be different from that of the variables that are not differentiated. The co-integration test can further confirm the long-term economic relationship between these variables, Johansen co-integration test results are shown in Table 2.
| Original hypothesis | Characteristic value | Trace test | Max eigen value test | ||
|---|---|---|---|---|---|
| Test statistics | p-value | Test statistics | p-value | ||
| Zero at most | 0.497 | 69.988 | 0.000 | 29.519 | 0.027 |
| One at most | 0.395 | 40.468 | 0.002 | 21.630 | 0.042 |
| Two at most | 0.275 | 18.838 | 0.015 | 13.803 | 0.049 |
| Three at most | 0.111 | 5.035 | 0.024 | 5.035 | 0.025 |
Johansen co-integration test results
According to the above co-integration test results, the co-integration vector exists at a significant level of 5%, and there is a certain long-term equilibrium relationship between the four variables, so the VAR model can be established at this time.
Second, the lag order of VAR model is verified as shown in Table 3.
| Lag | LL | LR | FPE | AIC | HQ | SC |
|---|---|---|---|---|---|---|
| 0 | 200.939 | NA | 1.52e−09 | −8.952 | −8.892 | −8.790 |
| 1 | 452.390 | 445.756 | 3.44e−14 | −19.654 | −19.353 | −18.843 |
| 2 | 483.105 | 48.863* | 1.80e−14* | −20.323* | −19.782* | −18.863* |
| 3 | 496.328 | 18.633 | 2.14e−14 | −20.197 | −19.782 | −18.863 |
| 4 | 511.467 | 18.579 | 2.45e−14 | −20.158 | −19.135 | −17.400 |
optimal lag order.
The lag order of VAR model
It can be seen from the above table, criteria of LR, FPE, AIC, and HQIC show that we should choose the lag 2 orders. The linear auto-regression of the second-order vector is needed for modeling. It can be seen from the results, the equation passes the significance test, and there exists no auto-correlative normal distribution in residual errors.
4.3. Test
4.3.1. AR root test
Vector autoregressive (2) model was used according to above results. In order to test whether the model is stable, we used the unit root test to check whether a pseudo-regression in the established model. Further data processing is required if the time series is an unstable time series, i.e., a pseudo-regression sequence. Otherwise, using the time series as a method, the results obtained from variable data cannot truly explain the problem in reality. In other words, the unit root is not supposed to exist in the stable time series. From this perspective, the VAR model we used can explain some practical problems accordingly (Figure 1).
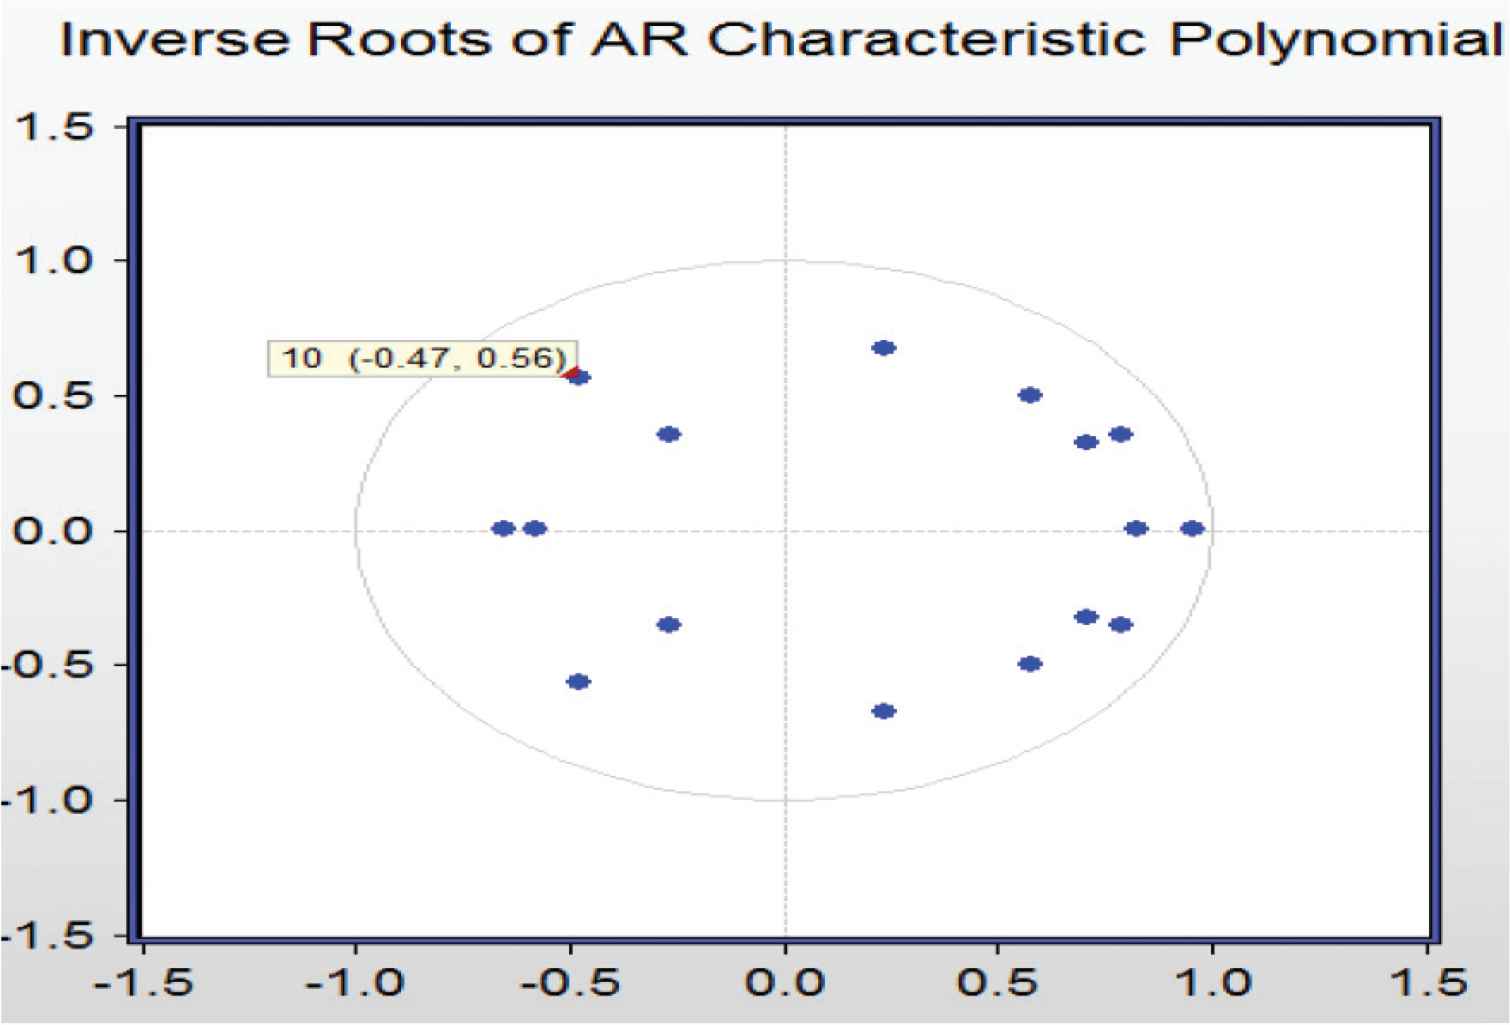
Diagram to discriminate the VAR system stability.
4.3.2. Granger causality test
Granger causality test can determine the causality between variables by examining whether the past value of a variable can effectively help predict the future value of another variable.
Granger causality test method was used to test the causality between the capacity utilization rate and the economic growth variable and the relationship between variables. The Granger causality test is performed as follows, as shown in Table 4.
| Original hypothesis | p-value | Conclusion |
|---|---|---|
| Capacity utilization rate is not the Granger cause of GDP | 0.000 | Original hypothesis denied |
| GDP is not the Granger cause of capacity utilization | 0.000 | Original hypothesis denied |
| Industrial fixed asset investment is not the Granger cause of GDP | 0.000 | Original hypothesis denied |
| GDP is not the Granger cause of industrial fixed asset investment | 0.000 | Original hypothesis denied |
| Industrial employment population is not the Granger cause of GDP | 0.000 | Original hypothesis denied |
| GDP is not the Granger cause of industrial employment population | 0.000 | Original hypothesis denied |
Granger causality test results
It can be seen from the results in the table, GDP and capacity utilization rate, industrial fixed asset investment, and industrial employee population have Granger causality, which further shows that the variables such as capacity utilization rate, industrial fixed asset investment, and industrial employee population have a function relationship with GNP, and the change between them is relevant.
4.3.3. Pulse response analysis
The impulse response function can be used to measure the dynamic relationship between these variables through the reaction degree of the variables to each other. The relationship between the variables can be obtained from the pulse diagram of the VAR model.
This paper has analyzed the dynamic impact of capacity utilization, industrial fixed asset investment, and the industrial employee population on economic growth during each quarter of 12 years.
4.3.3.1. Pulse diagram of CU and economic growth (GDP)
The pulse diagram in Figure 2 shows capacity utilization increase on the overall economic growth has a positive impact in the overall direction. When the pulse diagram is divided into 30 periods, the capacity utilization rate has a positive impact on economic growth at first, and then it tends to zero or even a negative impact. But after fine-tuning, it is a positive impact. The figure also shows that the impact effect is wavy, but as a whole, the impact of capacity utilization on economic growth is still positive. Thus we have following analysis based on reality:
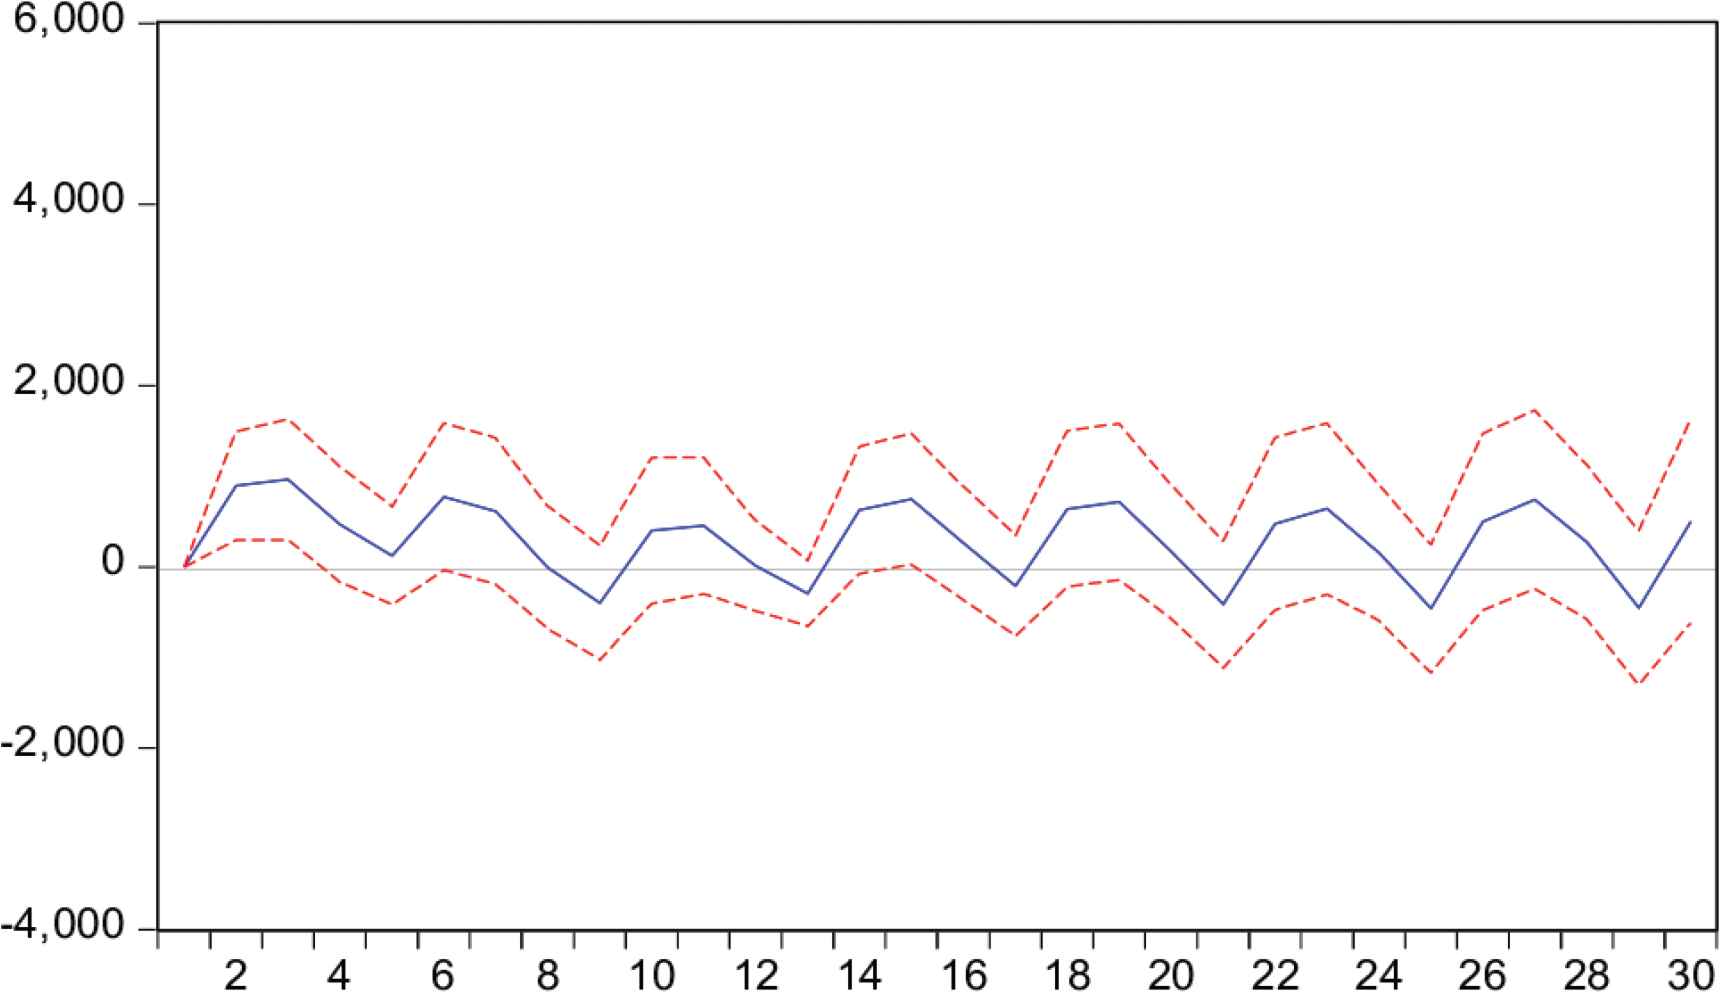
Pulse diagram of CU on GDP.
First, when overcapacity in industries with overcapacity tends to be serious, the real resource utilization in the company is very low, i.e. the capacity utilization rate is very low. At this moment, companies will keep investing in materials and energy, but the output cannot be proportional to the input. In other words, company’s economic benefits will also be hindered, thus preventing the growth of the entire economy. Second, based on China’s national conditions, despite of industrial development at a non-rapid development stage, in response to the call of de-capacity, industrial capacity utilization has been greatly improved, thus promoting economic growth.
4.3.3.2. Pulse diagram of industrial fix asset investment (CP) and economic growth (GDP)
Figure 3 shows the impulse response function curve of industrial fixed asset investment on economic growth. First, the impact intensity is greater, reaches the maximum in the third period, and then experiences a transient lag and begins to show a stable positive effect. In early 2005, despite of China’s fixed asset investment in the industrial sector under control on a small scale and China’s industrial development still in an extensive development stage, the increase of fixed asset investment would increase the output of industrial products. The impact is great, and can promote economic growth greatly at first, but when China’s industrial fixed asset investment reaches a certain level, overcapacity problem in some industries will be more and more serious. But investment in industrial fixed assets will still produce more output. The impact of output on economic growth is still positive, and it is a positive effect that tends to be stable.
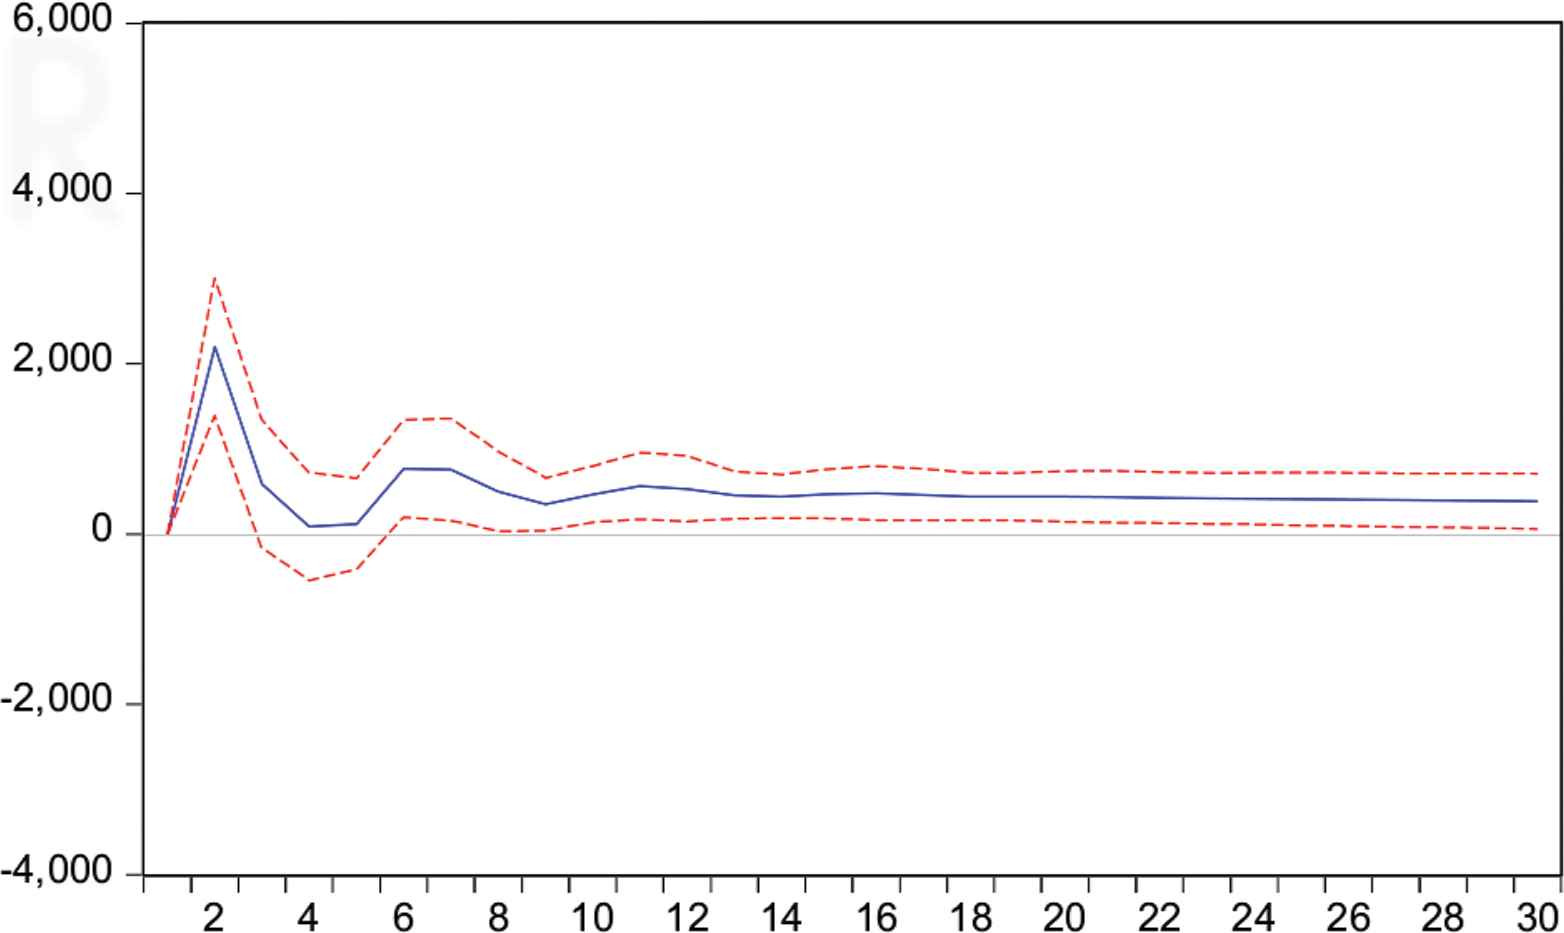
Pulse diagram of CP to GDP.
4.3.3.3. Pulse diagram of industrial employee population (CR) and economic growth (GDP)
It can be seen from Figure 4 that industrial employee population has a negative impact on economic growth. The impact effect was greater in the initial period, and gradually stabilized. The negative impact effect shows that it has no effect if economic growth depends solely on increasing the number of employees. The increase of the industrial population base will hinder economic growth. Overcapacity problem cannot be effectively solved if the industry grows in an extensive mode. To effectively eliminate overcapacity and stimulate economic growth, it is necessary to adjust industrial structure and rationally introduce talents.
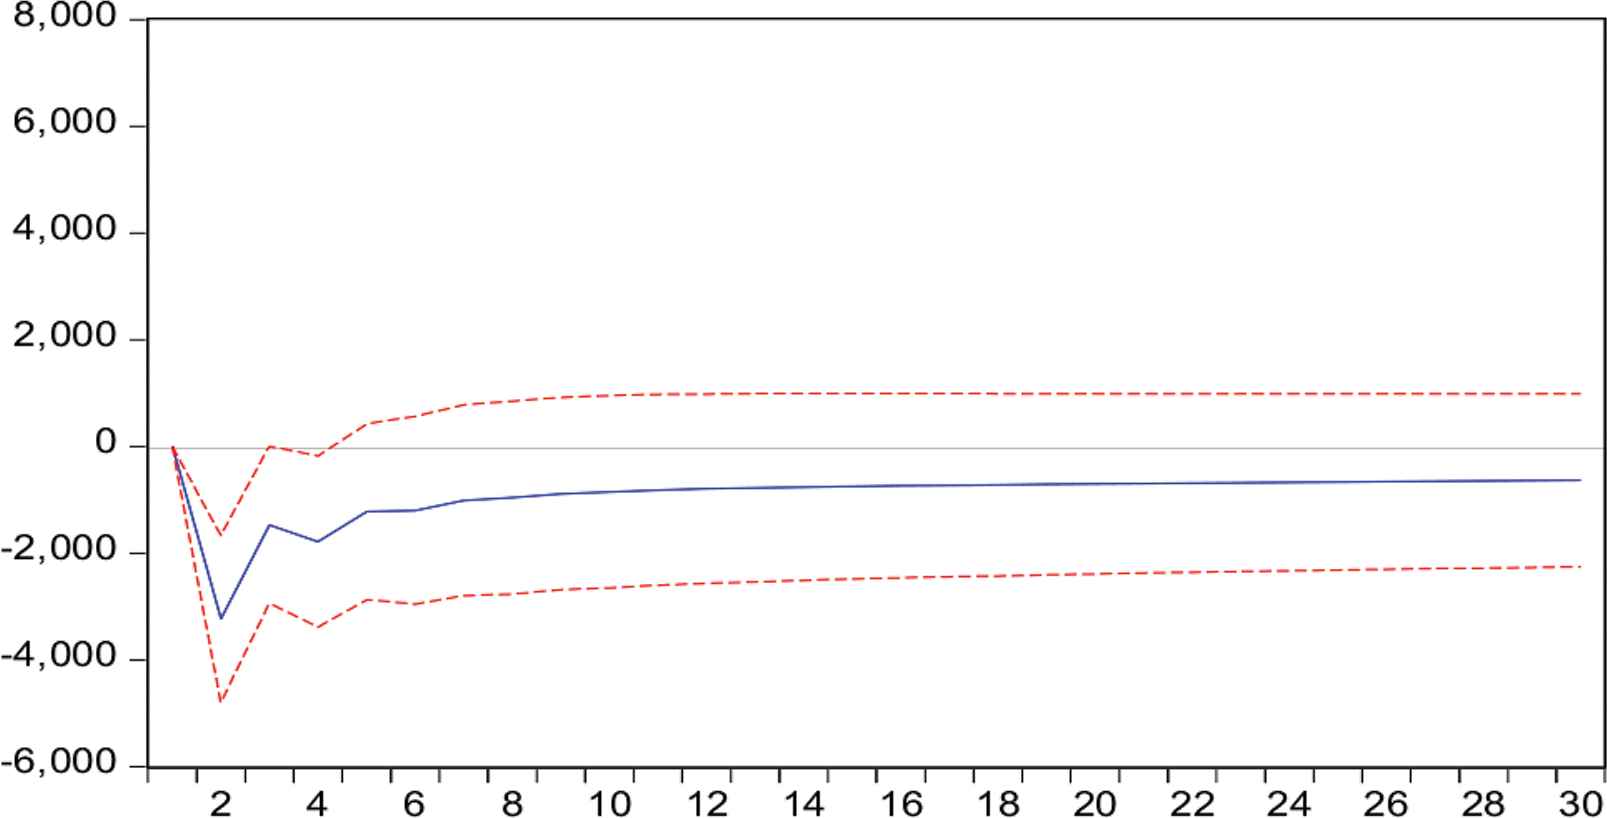
Pulse diagram of CR to GDP.
4.3.4. Variance analysis based on VAR
To clearly illustrate the impact of industrial capacity utilization, industrial fixed asset investment, and industrial employee population on the degree of influencing economic growth, a decomposition analysis of the variance of GDP is performed. The results are shown in Table 5.
| Period | GGDP growth rate | Capacity utilization | Industrial employee population | Industrial fixed asset investment |
|---|---|---|---|---|
| 1 | 1 | 0 | 0 | 0 |
| 5 | 0.839 | 0.111 | 0.035 | 0.015 |
| 10 | 0.740 | 0.178 | 0.070 | 0.012 |
| 15 | 0.675 | 0.205 | 0.109 | 0.011 |
| 20 | 0.720 | 0.154 | 0.112 | 0.014 |
| 25 | 0.638 | 0.111 | 0.237 | 0.014 |
| 30 | 0.529 | 0.092 | 0.364 | 0.015 |
Variance analysis
It can be seen from the above table that the proportion of the contribution of industrial capacity utilization to the fluctuation of GDP growth is at a proportion of about 13% after reaching the maximum and then decreasing gradually. The proportion of the contribution of industrial employee population versus GDP growth fluctuation has gradually increased; the contribution of industrial fixed asset investment to GDP growth fluctuation accounts for about 1.3%, and it finally stabilizes at this level. In other words, when capacity utilization rate continuously increases with technological development, its positive effect on economic growth will increase continuously, and the industrial employees also have an irreplaceable effect on economic growth, which shows that improvement of industrial employees’ knowledge, skills and cultural quality can greatly promote economic growth. Industrial fix asset investment is always the major factor of extensive development. It plays a much weaker role under the current intensive market development mode than other two factors. Therefore, stimulating economic growth requires not only technological improvements, but also requires for overall structural adjustment.
5. MAIN CONCLUSION
Based on theoretical and empirical analysis, it can be concluded in this paper that capacity utilization has positive effect on economic growth, i.e., de-capacity has a positive driving effect on economic growth. In terms of theory, it can be analyzed by referring to the two-sector model proposed by Ferdinand Wenzlaff [9], the industrial capacity utilization, working population, and fixed asset investment have a certain influence on economic growth, and these effects are considered positive. Empirically, this paper specifically researched the impact of capacity utilization on economic growth after conducting time series analysis based on the VAR model, and concluded that there is a positive correlation between both, and the increase in capacity utilization has a positive promoting effect on economic growth, i.e., de-capacity can promote economic growth.
After analysis from the perspectives of industrial employee population, and industrial fixed asset investment, it can be concluded that the impact of industrial de-capacity on economic growth lies in not only de-capacity of industries, but also in technology improvement and structural adjustment. It is also believed that fixed asset investment has small impact on economic growth. The state must effectively curb excessive investment in fixed assets when promoting economic growth.
6. SUGGESTIONS
6.1. Changing Economic Growth Mode
In the condition of resource scarcity and technology development in all countries, China cannot effectively promote economic growth solely depending on traditional extensive growth mode. On the contrary, resources if not used will inhibit economic growth. The intensive economic growth mode mainly emphasies the improvement of quality and utilization efficiency.
Transformation of the mode of economic growth in narrow sense refers to the transformation of the mode of GDP growth, the generalized refers to the economic growth pattern transition from junior to senior, from the allocation of resources such as renewable resources to the change of the pattern of economic growth, extension dilated to connotation development change of the pattern of economic growth, resource operations - product operation - assets operation - the growth mode of capital operation to the knowledge to change the increasing way of operating.
Accelerating the transformation of economic development mode involves many fields and links, which is a complex systematic project. From the Angle of epistemology, thought is the forerunner of action. To accelerate the transformation of the mode of economic development, we must first change our ideas and ways of thinking. The transformation of economic growth mode means: the transformation of economic growth mode from unsustainable to sustainable; Change from extensive type to intensive type; From technology introduction to independent innovation; By the second industrial belt trend three industries coordinated development transformation; From ignore environment type to environment friendly type change; From “minority” to “common prosperity” transformation.
With the digestion of surplus labor force as a watershed, the process of economic development has experienced two stages. In the first stage, since there is a large surplus labor force, the driving force of economic growth includes both the input of surplus labor force and the improvement of labor productivity reflected by technical input (progress). The economic growth mode premised on the existence of a large amount of surplus labor force, as the first stage of economic development, is an important feature of China’s economic growth mode in the past 30 years.
How does the investment boom drive high economic growth? Growth is the increase in output, which depends on the size of supply and demand. From the perspective of demand, investment itself is a kind of demand, and what is called self-demand in economics, i.e., it can also drive other demand through the multiplier effect. From the perspective of supply, the investment itself is also reflected in the increase in supply, through the construction of new plants and other ways to improve the potential production capacity of the economy and society. Here, two points need to be made. First, investment usually means building a factory and bringing in new workers. A large amount of surplus labor force exists in the society, which has become a prerequisite for investment to drive economic growth. Such a way of economic growth has played a role in the digestion of surplus labor. Second, investment usually leads to new capacity and new methods of production. In this sense, technological progress cannot be achieved without investment. However, investment does not necessarily mean technological progress. It may simply repeat existing production methods. China has experienced rapid economic growth in the past 30 years and achieved a certain degree of technological progress through investment. However, a large amount of investment just uses a large amount of labor to repeat the existing production mode, which does not reflect technological progress.
6.2. Improving the Corporate Governance Structure and Promoting the Institutional Development of Modern State-owned Enterprises
Improving the governance structure of state-owned enterprises as legal persons is an inherent requirement for comprehensively promoting the governance of enterprises in accordance with the law and the modernization of the national governance system and governance capacity. It is also an important task for the new round of reform of state-owned enterprises.
In April, 2017, issued by the general office of the state council “about further perfect governance structure of state-owned enterprise as a legal person guidelines” pointed out: at present, most of the state-owned enterprises has been preliminarily set up modern enterprise system, but in practice, the modern enterprise system is still not perfect, some enterprises have not yet developed effective corporate governance structure, power and responsibility is not clear, constraints, not enough and lack of checks and balances is more outstanding, some useless, the board of directors has not been able to play their role.
The report to the 19th national congress of the CPC made clear the following requirements: we should improve the management system of various types of state-owned assets, reform the authorized management system of state-owned capital, accelerate the optimization of the distribution, structural adjustment and strategic restructuring of the state-owned economy, promote the preservation and appreciation of state-owned assets, make state-owned capital stronger, better and bigger, and effectively prevent the loss of state-owned assets.
We will deepen the reform of state-owned enterprises, develop a mixed-ownership economy, and cultivate world-class enterprises with global competitiveness.
Corporate governance structure is the core of modern enterprise system. Corporate governance was raised by western economists as early as the 1950s.
In the past 20 or 30 years, corporate governance has attracted extensive attention from the international community and in-depth studies by experts and scholars. It has become a hot topic in developed market economies and countries with economies in transition.
Throughout the domestic business community, there have been “Home board of directors control”, “wake boning equity war”, “China iron materials and MCC illegal operation”...... These disputes all reflect the problem of corporate governance structure. Although Chinese and western corporate governance models are not the same and the nature of enterprises is different, many problems encountered in the common market economic environment have something in common.
In particular, China’s state-owned assets are more concentrated in important industries and key areas that concern the lifeline of the national economy and national security. Therefore, it is particularly important to improve the corporate governance structure of state-owned enterprises.
Global corporate governance can be divided into three models, namely, the US–UK market dominant model, the German and Japanese bank dominant model and the Southeast Asian family dominant model.
The market dominance in the United States and Britain is mainly manifested in decentralized equity structure, more investors, more external directors or independent directors serving as the board of directors, the establishment of a board of directors but not a board of supervisors, the board of directors has a professional committee, the chairman is generally concurrently the CEO, and the general legal counsel system is established.
The dominant type of German and Japanese Banks is mainly reflected in the shareholding of financial groups or financial institutions, relatively concentrated equity, the establishment of the board of directors and the board of supervisors, the majority of internal directors in the board of directors and the absorption of employees to participate in decision-making. In Southeast Asia, family ownership is mainly manifested as family ownership, relatively concentrated ownership, obvious paternalism in decision-making, and weakened external supervision.
In a word, the corporate governance structures adopted by different countries have their own characteristics, which are both worthy of reference and in need of improvement.
It can be seen from relevant documents of the central committee and Shanxi Province that, through top-level design, China puts the emphasis on the improvement of corporate governance structure to standardize the board of directors, clarify and implement the legal status of party organizations in corporate governance structure and the construction of boards of supervisors with external supervisors.
Generally speaking, the reform direction of corporate governance structure with Chinese characteristics is to learn from the market-oriented model of the United States and the United Kingdom, and implement relatively concentrated equity, co-existence of the board of directors and the board of supervisors, and separation of the chairman and the general manager.
Learn from the leading model of German and Japanese Banks, increase the proportion of external directors or independent directors, set up special committees of the board of directors, and promote the general legal counsel system in large state-owned enterprises.
On October 10, 2016, general secretary Xi Jinping at the national conference on party building of state-owned enterprises, the requirements, to strengthen the party’s leadership and improve corporate governance together, to build a modern state-owned enterprise system with Chinese characteristics.
On this basis, give full play to the leading and political functions of party organizations in enterprises, and make it clear that the decision-making of party committees (leading groups) in state-owned enterprises is the pre-procedure for the decision-making of the board of directors and the “triple and one” items.
6.3. Strengthening Technical Talent Cultivation
China is a country with a large population. However, <10% of the people have received higher education or advanced professional skills. To promote stable economic growth, it is necessary to increase the level of education and employees’ skills. The state should establish more skills training institutions, and carry out some intervention policies (such as raising 9-year compulsory education to 12-year compulsory education, etc.) to improve employees’ overall quality.
First, change the concept, improve the understanding, to create a suitable management environment for the development of talents.
To build a professional and technical personnel team, the first thing is to change the concept, to improve the status and role of professional and technical personnel understanding, establish a modern talent management of new ideas, new ideas.
Second, innovation management, establish a full mechanism, stimulate the vitality of professional and technical personnel.
The vitality of talents depends on the enterprise management mechanism, and a good mechanism will play a positive driving role in the quality and potential of talents. To this end, we should deepen the reform of personnel system in enterprises and institutions and constantly innovate the working mechanism of personnel management.
Third, overall planning, scientific layout, promote the construction of professional and technical personnel echelon.
Overall planning, form a rational structure of professional and technical personnel, according to the enterprise existing professional and technical personnel, formulates plans for the development of professional and technical personnel, scientific plan at the beginning of high, medium and the distribution of the structural layout, good use of the advantages of all age groups, and do a good job of complementary, in a planned and step by step to improve their professional ability.
By using various forms such as recruitment of college graduates and public recruitment, we will introduce talents with practical experience and strong technical ability who are urgently needed by enterprises, establish a talent pool for key majors and operation and management of enterprises, and continuously improve the overall quality and ability of the professional and technical personnel of enterprises through a variety of limited measures.
Fourth, strengthen education, adapt to the situation, improve the political quality of professional and technical personnel.
Strengthening ideological education, with Xi Jinping important thoughts such as head of the armed professional and technical personnel, guides them to adhere to the correct political orientation and ideal faith, sets up conforms to the spirit of the age, professional ethics and work to satisfy the needs of the enterprise development ideas, not just in business capability superior and first-class on job performance, but also to strengthen the cultivate good professional ethics, formation of hard pragmatic style of work, the arduous struggle, do “have ideal, morality, culture and discipline” of the worker, do is good for the people, are beneficial to the society.
It is a long and complicated systematic project to strengthen the construction of professional and technical personnel. We believe that the enterprise will usher in a more brilliant tomorrow. As long as we establish a scientific outlook on development and talent, perseverance.
6.4. Developing Supervision System
According to the current statistics from the Bureau of Statistics, there exists no authoritative approach of the measurement of capacity utilization in China, which result in blind investment due to information asymmetry, i.e., overcapacity in some industries. Therefore, China should learn development experience from foreign countries, establish a statistical supervision system that can promote economic growth, and improve the statistics of some indicators, so that authoritative data released by the state can effectively change the investment structure for effective resource allocation and avoidance of overcapacity.
First, reform the fiscal and taxation systems and the performance evaluation mechanism to regulate the investment behavior of local governments.
We will accelerate reform of the fiscal and taxation systems and straighten out the government assessment system as a breakthrough to curb the impulse of local governments to overinvest or invest blindly.
We will straighten out the division of government expenditures and further clarify the division of responsibilities between the central and local governments.
We will straighten out the division of revenue among governments, rebuild and improve the central and local tax systems, accelerate the reform of production-oriented VAT to consumption-oriented VAT, and cut off the direct link between expanding investment and increasing local fiscal revenue.
We will straighten out the system for assessing political achievements.
In the evaluation system, the weight of economic construction should be appropriately lowered, and the evaluation system of local government officials should be reformulated according to the requirements of the scientific outlook on development.
We will standardize the investment behavior of local governments and reduce their direct participation in project decisions.
We will strengthen the supervision and correction of non-market behaviors of local governments, standardize their investment promotion and investment management methods, strictly control the total amount of land development, and strengthen the implementation of the “recruitment, auction and listing” policy. Strengthen supervision and increase the transparency of land supply.
Local governments are prohibited from distorting the prices of resource elements by means of low land prices, low environmental standards, tax reductions and exemptions, and from using policies that do not accord with the principle of national treatment to attract investment.
We will actively promote the transformation of local government functions from direct intervention and participation in economic development to the creation of a fair market environment for competition.
Second, promote the reform of the property rights system and state-owned enterprises, and strengthen the self-discipline system of enterprises and industries.
We will accelerate reform of the property rights system in industries with excess capacity and shape the institutional basis for fair competition, and ensure fair competition among enterprises with different forms of ownership. For the environment. At the same time, we will relax controls and market access restrictions on monopolized industries, relax restrictions on the entry of private capital, and adjust the industrial layout and structure of state-owned capital, both in advance and in retreat.
Continue to expand and deepen the reform of state-owned enterprises, the state capital of monopoly industries accelerate the separate government functions from enterprise management, we should promote the transfer of state-owned shares, state-owned shares listed circulation of state-owned shares, state-owned shares converted into cash, and exit the market mechanism reform, set up in line with the market economy, clear responsibilities, constraints, strong system of the state-owned property right of principal-agent, increase the market competitiveness of state-owned enterprises, standardize the market behavior.
Third, improve the industry entry and exit policies, and improve the industry information statistics release system.
We will strengthen the functions of the central government in strategic planning and industry management standards, and make scientific use of resources, energy consumption, environmental protection, safety, quality and other functional regulatory standards manage industries with excess capacity.
From the perspectives of saving energy and resources, strengthening environmental protection, and social security, it gradually transfers from administrative management to functional supervision of social externalities in the industry mainly through legal means. Improve the relative independence of local environmental protection departments and strengthen the implementation of environmental protection policies.
We should prudently apply management standards such as technology, equipment and scale, and, on the premise of meeting regulatory standards, try to make micro-enterprises more independent in choosing suitable technology, equipment and scale based on their own conditions and the external competitive environment.
We will improve the exit assistance system for some industries with excess capacity and standardize procedures for the bankruptcy and closure of enterprises and the elimination of outdated production capacity, deepen reform of the social security system, and establish a mechanism for guaranteeing and compensating for the withdrawal of outdated production capacity. Improve the information statistics of production capacity as soon as possible, release relevant information and research results regularly, and timely track the industry supply and demand pattern Potential change, early warning industry overcapacity risk. Learn from the practice of the United States, Japan and other countries in monthly and annual release of detailed capacity utilization data of small industries, regularly statistics and release China’s industry capacity scale, capacity utilization level and other relevant data, to help enterprises make investment decisions and guide the investment of credit. Information on industrial production, technology, market and international economic and policy trends are regularly released to enterprises and the public.
CONFLICTS OF INTEREST
The author declares no conflicts of interest.
ACKNOWLEDGMENT
This paper is partly supported by Zhengzhou Normal University “Management Science (Lean Management Direction) Professional Comprehensive Reform Pilot” Project.
REFERENCES
Cite this article
TY  - JOUR
AU  - Xianhong Xu
PY  - 2020
DA  - 2020/02/23
TI  - Empirical Research on the Growth Path of China’s Industrial Economy under the Background of Supply-side Reform
JO  - International Journal of Networked and Distributed Computing
SP  - 76
EP  - 85
VL  - 8
IS  - 2
SN  - 2211-7946
UR  - https://doi.org/10.2991/ijndc.k.200217.002
DO  - 10.2991/ijndc.k.200217.002
ID  - Xu2020
ER  -