
Transitional Method for Identifying Improvements in Video Distribution Services
- DOI
- 10.2991/ijndc.k.190911.001How to use a DOI?
- Keywords
- Data science; customer satisfaction; ICT services; data mining; transitional evaluation; video distribution services
- Abstract
Customer satisfaction is an indicator that is generally utilized to improve goods/services for customer retention. Therefore, companies should understand the changes in customers’ perception of their goods/services and decide improvements. Therefore, a transitional evaluation approach is needed for goods/services rather than merely improving items with the highest dissatisfaction score. This paper proposes a transitional method for identifying improvements in video distribution services from questionnaire results over 4 years.
- Copyright
- © 2019 The Authors. Published by Atlantis Press SARL.
- Open Access
- This is an open access article distributed under the CC BY-NC 4.0 license (http://creativecommons.org/licenses/by-nc/4.0/).
1. INTRODUCTION
All companies make great efforts to retain customers, using Customer Satisfaction (CS) as an indicator to identify improvements in goods/services. Therefore, it is important to determine how to adequately improve CS. Consumers’ responses to questionnaires are generally used to evaluate CS. A simple method of identifying improvement factors for CS is to select those factors with high dissatisfaction scores at a given point of time. However, these factors change rapidly, especially in the information and communication technology (ICT) field, due to the rapid technological developments, competition, and the business environment. Thus, companies should adequately capture customers’ changes in perception of their ICT services.
Consider the example of video distribution services. In the broadcasting era, television was a major player at home and people went to cinema to watch movies. Later, with the advancement of video recording technology such as video home system and Betamax, rental video services became popular. This type of services satisfied users as they could easily watch movies at home. With the penetration of broadband network, Video-on-Demand (VoD) services have been provided by Set Top Box (STB). These enabled viewers to choose their favorite video programs whenever they wanted. STB is a device that allows channel selection. USEN was a well-known video distribution provider in Japan and provided free video distribution services such as “GyaO” since 2005. Consumer Generated Media (CGM) has gained considerable attention. YouTube and Niconico Douga have penetrated heavily in Japan. These video sharing services have become popular in Japan as they have dramatically changed the modern life-style and have made it easy for individuals to share information. Pay-per-view services that came from outside Japan, such as Hulu, Netflix etc., are also providing interesting content created outside Japan. Although the Japanese market for video distribution services is growing, the growth rate in Japan is very low. This is because the number of viewers of video distribution services in Japan is estimated at 15 billion in 2018, while that in America is 45 billion. We do not yet know of all the reasons for low penetration in Japan. Therefore, it is important to determine the key factors for improvement in video distribution services. Moreover, in addition to considering CS for the content provider, the viewpoints of the network carrier and terminal development vendor also have to be considered. Our aim is to improve CS; thus, it is important to know the most important factor.
This study focuses on video distribution services, which have recently become popular worldwide. A transitional approach to identifying improvement factors for video distribution services is proposed and evaluated using responses over 4 years to questionnaire that measures changes in CS.
The remainder of this paper is organized as follows. Section 2 describes issues related to using CS as an indicator and its application to video distribution services. Section 3 introduces the market trends of video distribution services. Transitional evaluation approach is proposed using video distribution services in Section 4. Data analysis is discussed in Section 5. Section 6 concludes this paper.
2. RELATED WORKS
The concept of CS was proposed in Denove and Power [1] as a way of thinking based on the demands and tastes of consumers instead of producers. Considering the consumer comments is the best approach to identify the improvement factors of goods/services for higher CS. Therefore, it is necessary to capture consumers’ demands adequately to ensure strong consumer loyalty. For most companies, the target of CS is mainly the core user, and their aim is to understand core user satisfaction at the time of use. This is effective for core customer retention; however, it is difficult to understand CS over a period of time. Most companies use this method. Research companies, however, can collect a variety of opinions through surveys, and can include not only experienced consumers but also inexperienced ones. Hence, statistical data are obtained for understanding CS. It is necessary to analyze these data to understand important factors. The Japan Customer Satisfaction Index (JCSI) [2] is a major criterion for evaluating CS. It covers all customers that have use experience to understand the brand image and customer demographics. A company evaluation based on medium-term experience is also possible. The results are utilized to manage targets and for company policy development, but not for finding improvement factors.
A company’s strategy significantly depends on the target customer segment, such as innovator, early adopter, early majority, late majority, or laggard [3]. The company should also carefully consider the chasm that between the early adopters and early majority to increase the penetration of goods/services [4].
The telecommunications field comprises several stakeholders, such as network carriers, equipment vendors, and information providers. This makes it difficult to understand and classify whether the obtained CS results are related to issues with the network carrier, the equipment vendor, or the information provider. Choi et al. [5] investigates the characteristics of CS in mobile services using a decision tree. Broadband access, such as fiber-to-the-home, and mobile services have been investigated from the viewpoint of user choice behavior [6,7]. The relationship between CS and switching effect has been studied in the context of mobile services [8,9]. Moreover, customer services and price fairness are described to be important factors for CS in the field of telecommunications [10]. These results have well-illuminated past user intentions. However, we carefully analyze the existence of both advantages and disadvantages of each requirement such as customer services and price fairness. In such a situation, it is difficult to decide our way. Moreover, the sheer number and various types of customers that use ICT services further complicate the adequate identification of improvement factors. For example, existing users who are accustomed to the services feel satisfied, whereas new comers feel dissatisfied when operating the services because of their unfamiliarity. Moreover, the significance of satisfaction level deeply depends on individual. From this point of view, several approaches have been introduced and compared for using tablet services as an example [11]. In a precious study, a transitional approach identified increasing applications/contents as the long-term improvement factor, and not battery survival time/tablet size or weight. The transitional approach has also been applied for e-Book services, and ease of purchase was identified to be a long-term improving factor [12]. It is worth identifying the improvement factors for other services using this approach. In this study, this approach is applied for the market of video distribution services.
3. VIDEO DISTRIBUTION SERVICES AND TRENDS
Owing to the penetration of smartphones, many people tend to watch video over internet instead of TV. Lots of providers have appeared and compete based on this tendency. Therefore, our objective is focusing on what factors contribute toward the expansion of video distribution services.
There are three types of video services as shown in Figure 1. Video distribution services, namely VoD, are provided by Hulu, Netflix, etc. as pay-per-view services (Figure 1a). Each viewer can choose his/her favorite video content (dotted line from a viewer to a provider as a request), and each content is streamed by video content provider (line from a provider to a viewer). A viewer can watch the content whenever he/she wants using a video recorder at home. Video share services are provided by YouTube, Dailymotion, etc. free of cost (Figure 1b). An amateur video maker uploads a content, also called CGM, to the provider free of cost (dotted line from a viewer to a provider) and all viewers can watch the content (line from a provider to a viewer). Video broadcast services are provided by Hikari TV, U-NEXT, etc. as digital terrestrial broadcasting (Figure 1c). The broadcasting provider sends contents according to the preset program schedule. In that case, a viewer selects a channel but has no control over its contents. This paper focuses on video distribution services.
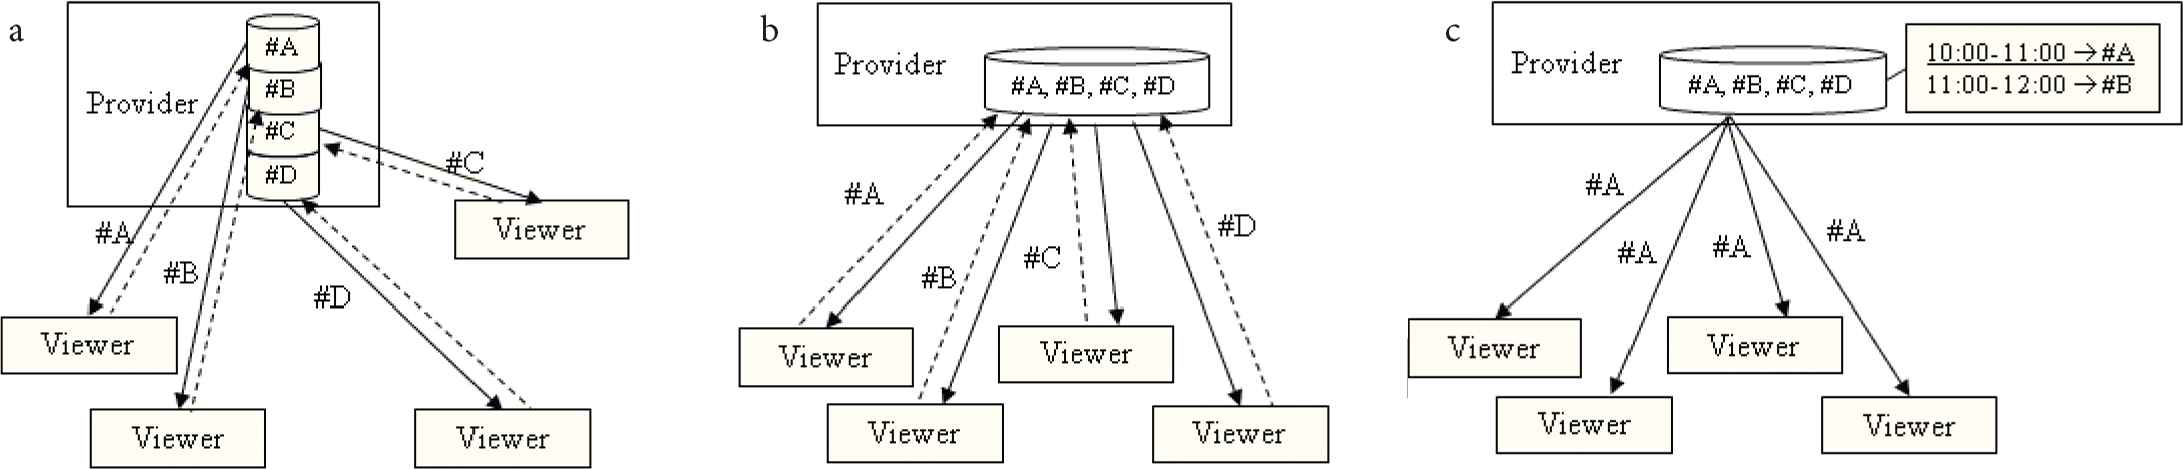
Type of video services. (a) Video distribution. (b) Video share. (c) Video broadcast.
The number of users of video distribution services was about 11.6 million in 2016, while that in 2020 the number is forecasted to be 21.9 million [13]. Market trend in Japan is indicated in Figure 2. The market size in 2017 has doubled since 2011 to about 170 billion yen [14]. The market size grows gradually in Japan and the growth rate has reduced.
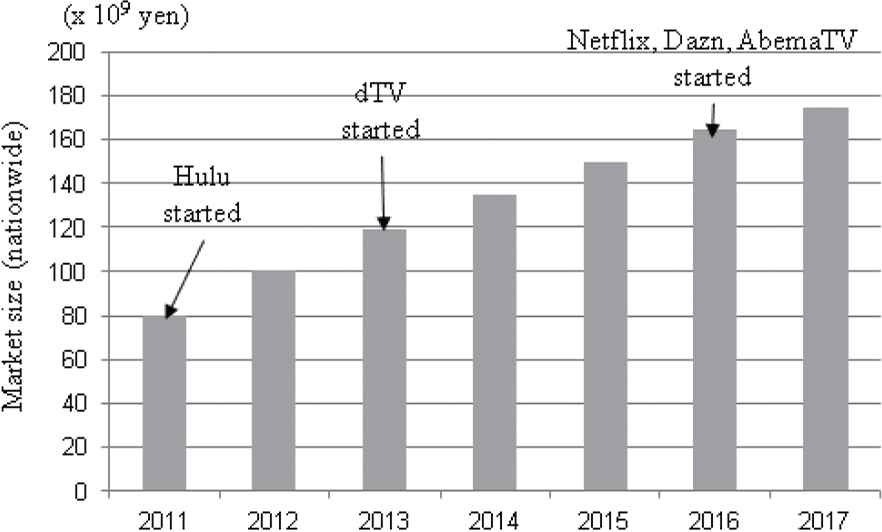
Market trend.
Although pay-per-view is essential for video distribution services, there are two types of business models are listed in Table 1. One is free for viewer and the other is paid for viewer. In the free business model, the provider earns revenue through advertisements by including advertisement clips within the content. Since the content is delivered free of cost, viewers have few problems watching advertisements and the provider collects revenue through advertisements to maintain its services. However, a lot of viewers are required for generating revenue through advertisements. For example, USEN, a content provider in Japan, started as free type of video distribution service as “GyaO”. However it was very difficult to sustain the business only from the revenue from advertisements. Only after the takeover of “GyaO” by Yahoo! Japan have their services become stable. On the other hand, there are two kinds of revenues for the paid business model. The provider earns revenue based on pay-per-view from viewers. If the provider’s content becomes popular and many viewers access that content, the provider earns a high profit. However, there exists a high hurdle for viewers to pay per view, and the profit is unstable. Therefore, the profit heavily depends on the popularity of the content. Alternatively, a provider can earn revenue by requiring a fixed monthly payment from viewers. The profit is stable in this type of business model. The disadvantage is the high usage of its services at a fixed monthly rate reduces profit margins. New active providers such as Netflix, Dazn, and AbemaTV have introduced monthly fixed rate revenue for stability.
| Type | Revenue | Merit | Demerit |
|---|---|---|---|
| Free for viewer | Ads. from enterprises | Low hurdle for viewers | Amount of ads. and viewers are needed |
| Pay for viewer | Pay-per-view | High profit expected | High hurdle for viewers, profit is stable |
| Monthly subscription | Profit is stable | High usage reduces profit |
Business model
Next, we discuss the complicated structure of the ICT field. Many players are involved in video distribution services, as shown in Figure 3. First, a viewer buys a device, such as a smartphone or a tablet PC, from the equipment vendor. Then, the viewer connects with the video content provider, and the provider’s video content, is downloaded through networks. In fact, content is delivered from the video content provider to a viewer as a download flow, after a viewer requests for his or her favorite content. It is easy to understand that many improvement points exist from the viewpoint of different players. Therefore, we have captured this point of improvement in the questionnaire.
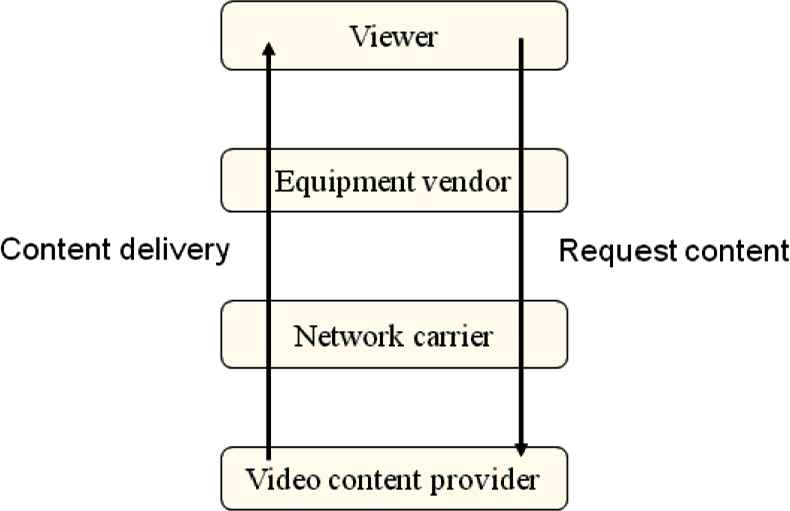
Relationship between players for video distribution services.
It is understandable to acquire regular customers for stable revenue. Therefore, CS plays an important role. The relationship between price, customer expectation (CE) and CS is shown in Figure 4. The basic concept of CS may be explained as follows. Customer loyalty generally depends on the relationships among three factors: price, CE, and CS. Price is decided during service optimization. Customer expectations are set based on sales promotions, and the customer experiences satisfaction based on these expectations upon obtaining the goods/services. The good/service is considered to be supported by a good strategy when CS is higher than CE. Loyalty decreases when this relationship is reversed, although the damage would be relatively small as long as CS is greater than price. However, customer retention will be difficult if CS is lower than price. Therefore, CS increases when CS is larger than CE; hence, the relationship between CE and CS is important. Therefore, we have captured this point of improvement in the questionnaire.
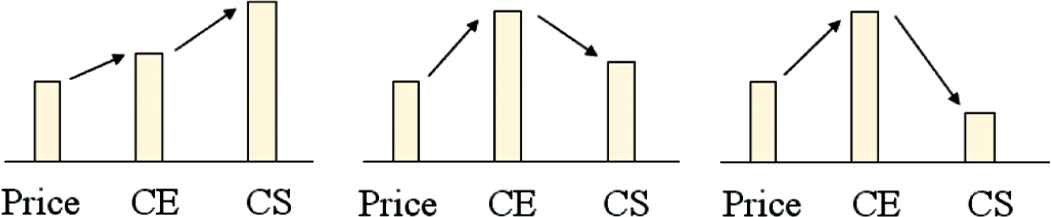
Relationship between price, CE and CS.
4. METHODS FOR IDENTIFYING IMPROVING FACTORS
We compared three evaluation methods for finding improving factors; evaluation using dissatisfaction scores (Method 1), evaluation using difference in satisfaction and dissatisfaction scores (Method 2), and transitional evaluation of satisfaction and dissatisfaction scores (Method 3).
4.1. Maximum Dissatisfaction Score
The improving factors can be easily found from maximum dissatisfaction scores. This approach corresponds to solving a superficial improvement by quick action. Therefore, this method only focuses on users’ unacceptable or negative feelings for a factor. Moreover, it is not possible to identify whether the factor is serious or not. This is because users, especially existing ones, have been accustomed to a factor over time. In fact, we sometimes observe a small effect despite a quick improvement. The score is calculated as follows:
4.2. Difference between Satisfaction and Dissatisfaction
Different users have different needs. Some users may find a factor acceptable, while others may find the same factor unacceptable. Method 2 can consider both good and bad points for each factor by calculating the difference between satisfaction and dissatisfaction scores and finding their minimum difference. However, it is difficult to find whether the improving factors have the desired effect or not because there is no transitional evaluation. The score is calculated as follows:
4.3. Transitional Evaluation
Method 3 calculates transitional values as follows.
- •
Step 1: Let A be the difference in satisfaction over 2 years.
- •
Step 2: Let B be the difference in dissatisfaction over 2 years.
- •
Step 3: Calculate value D using A and B.
- (i)
Pattern 1: A > 0 and B > 0, and A > B, then D = 0.
- (ii)
Pattern 2: A > 0 and B > 0, and A < B, then D = B – A.
- (iii)
Pattern 3: A > 0 and B < 0, and A > |B|, then D = 0.
- (iv)
Pattern 4: A < 0 and B > 0, and |A| < B, then D = |A| + |B|.
- (v)
Pattern 5: A < 0 and B > 0, and |A| > B, then D = |A| + |B|.
- (vi)
Pattern 6: A < 0 and B < 0, and |A| > |B|, then D = |A| – |B|.
- (vii)
Pattern 7: A < 0 and B < 0, and |A| < |B|, then D = 0.
There are seven patterns according to the combination of positive and negative value for differences in satisfaction (A) and dissatisfaction (B). The transitional value, D, which is based on the difference between trends of satisfaction and dissatisfaction, is calculated.
The patterns having D = 0 can be considered to have improved. Even though the dissatisfaction value is positive or negative, customers overall feel satisfied with the service in patterns (i), (iii), and (vii). Since dissatisfaction increase is larger than the magnitude of change in satisfaction in Patterns (ii) and (iv), it can be attributed to new customers, who are unable to see improvements in service. The existing customers, the improvement is either too little or they are accustomed to improvement. Therefore, providers must target new customers for improving factors in Patterns (ii) and (iv). The factors having scores in Pattern (v) are very serious, as satisfaction has decreased and dissatisfaction has increased. This cannot be attributed to any effect for existing or new customers. Therefore, it is necessary to urgently address the factors in Pattern (v), even when the score may not be high. Dissatisfaction seems to be small in Pattern (vi). This is because both the difference in satisfaction and dissatisfaction have decreased. Therefore, both new and existing customers accept the improvement. In this way, we can explain the results to be either due to users getting accustomed or due to improvements by taking into account the trends in satisfaction and dissatisfaction scores using the transitional method.
5. DATA ANALYSIS AND CONSIDERATION
In this section we compare the three methods on the questionnaire data, and discuss the need for transitional approach.
5.1. Questionnaire Results
Tables 2 and 3 show the questionnaire results for video distribution services in 2013–2016 [14]. The reasons for satisfaction with video distribution services are listed in Table 2, while those for dissatisfaction are listed in Table 3. Both satisfaction and dissatisfaction results are obtained from the same respondents.
| Item | 2013 | 2014 | 2015 | 2016 |
|---|---|---|---|---|
| Amount of content | 685 | 534 | 534 | 535 |
| Price | 259 | 383 | 397 | 449 |
| Service interruption | – | – | – | – |
| Quality of video & sound | – | – | – | – |
| Operability & interface | – | – | – | – |
| Streaming speed limit | – | – | – | – |
| Battery consumption | – | – | – | – |
| Pay-per-view | – | – | – | – |
| Flexibility among equipment | 102 | 87 | 73 | 92 |
| Content search | 79 | 46 | 40 | 22 |
| Ease of content selection | 485 | 140 | 136 | 153 |
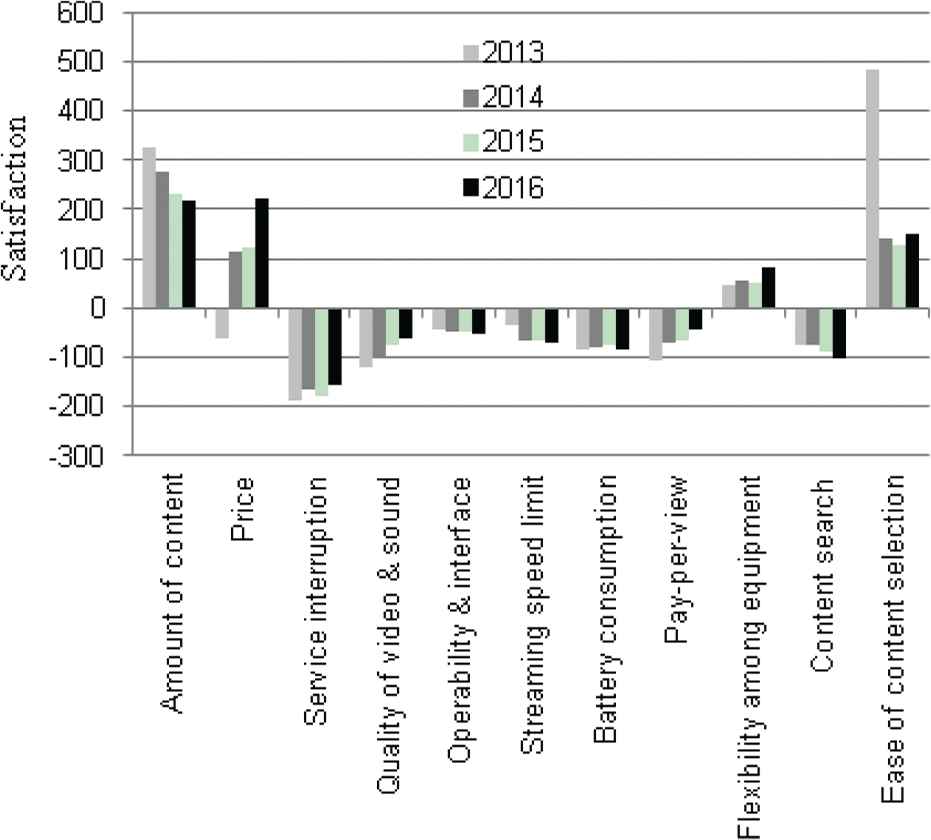
Questionnaire results for video distribution services (satisfied)
| Item | 2013 | 2014 | 2015 | 2016 |
|---|---|---|---|---|
| Amount of content | 359 | 257 | 304 | 316 |
| Price | 323 | 269 | 273 | 229 |
| Service interruption | 190 | 168 | 182 | 156 |
| Quality of video & sound | 120 | 97 | 78 | 64 |
| Operability & interface | 45 | 50 | 49 | 52 |
| Streaming speed limit | 34 | 65 | 68 | 73 |
| Battery consumption | 84 | 81 | 74 | 85 |
| Pay-per-view | 109 | 73 | 69 | 43 |
| Flexibility among equipment | 55 | 31 | 22 | 12 |
| Content search | 153 | 121 | 129 | 124 |
| Ease of content selection | – | – | 7 | 5 |
Questionnaire results for video distribution services (dissatisfied)
5.2. Results by Method 1
The items with top three satisfaction scores are “Amount of content,” “Ease of content selection,” and “Price” in 2013. Top three satisfaction scores changed to “Number of contents,” “Price,” and “Ease of content selection,” through 2014 to 2016 as shown in Table 2. Satisfaction score of “Price” gradually increases, while the scores of the other two items are almost stable.
It is easy to understand why “Amount of content” has the highest score and is stable for 4 years. This is because each provider provides tens of thousands of videos during these periods. As for “Price,” almost all the providers charge a monthly subscription between ¥500 and ¥2000. Therefore, viewers find it reasonably priced.
The top four factors for dissatisfaction in 2013 were “Amount of content,” “Price,” “Service interruption,” and “content search” as shown in Figure 5. All four factors are still top four in 2014–2016 as shown in Table 3. Moreover, these rankings are fixed over 4 years.
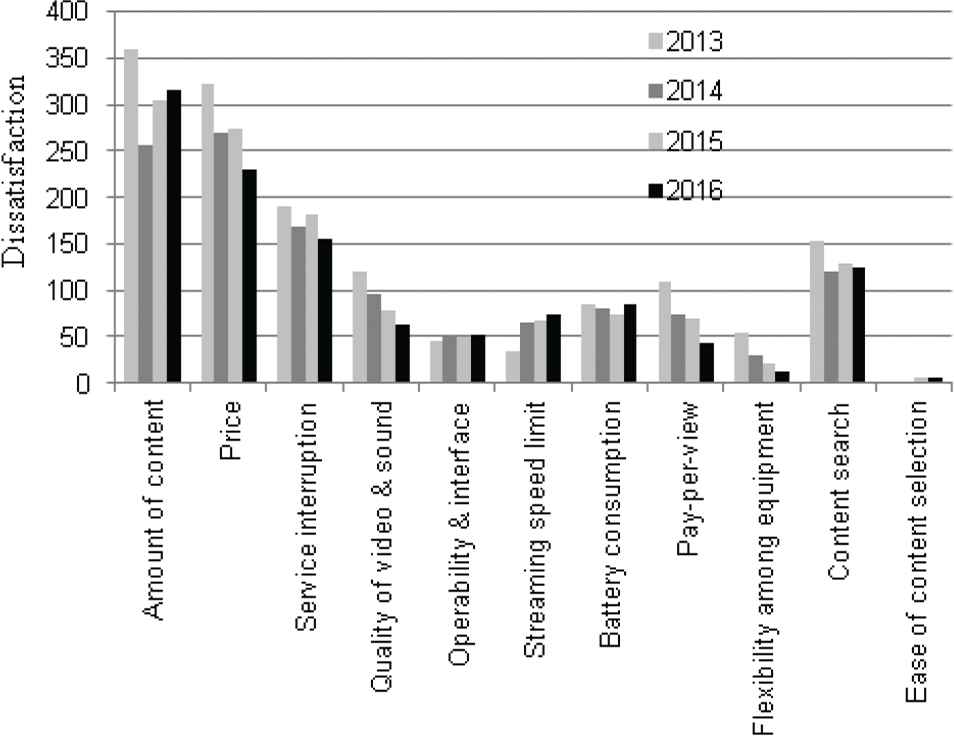
Maximum dissatisfaction.
Although providers are providing a lot of content, some viewers still want to watch the specific content such as a specific sports match, animation, or a recent movie. As viewers’ preferences become diversified, amount of content alone cannot address dissatisfaction. Moreover, as price heavily depends on the amount of content, dissatisfaction score is high.
5.3. Results by Method 2
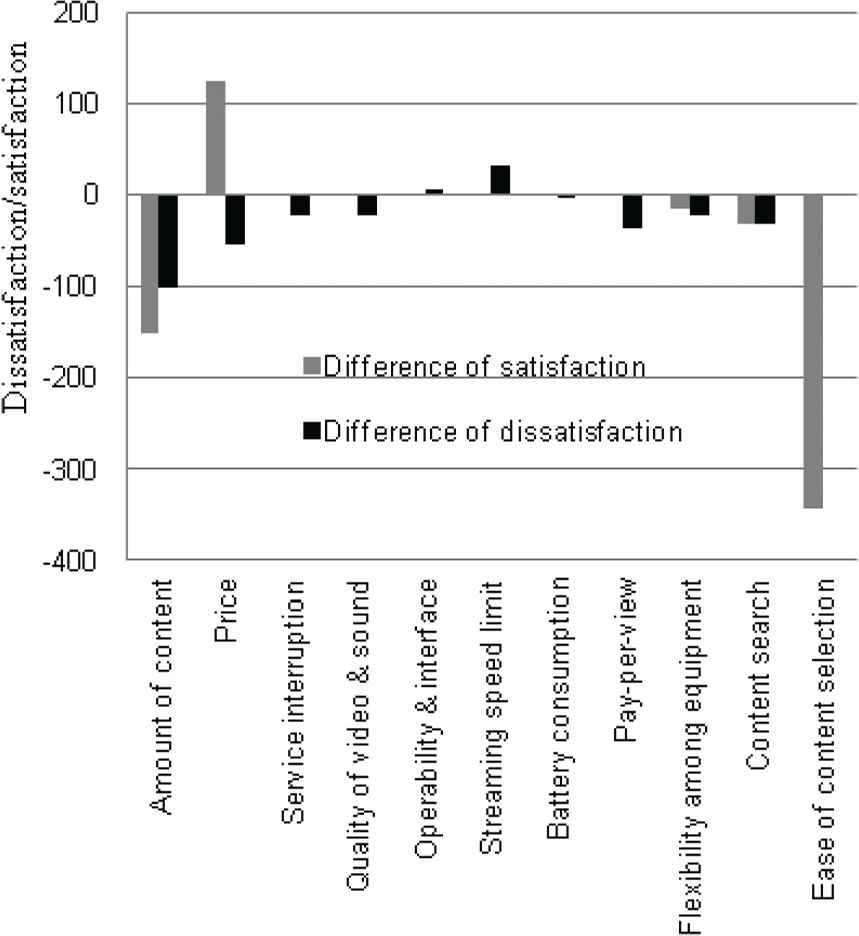
Although the items of satisfaction are not always the same as those of dissatisfaction, some items appear in both. Due to service customization, there are naturally consumers on both sides. Therefore, the differences between satisfaction and dissatisfaction are calculated in this subsection. Figure 6 shows the differences for the selected items from the results obtained in 2013–2016. A positive value means that satisfaction points are greater than those of dissatisfaction, while a negative value means that dissatisfaction points are greater than those of satisfaction. The differences between satisfaction and dissatisfaction are positive for “Amount of content,” “Flexibility among equipment,” and “Ease of content selection.” “Price” has positive values for the last three years, while it had a negative value in 2013. Therefore, these items are not critical because more people are satisfied rather than dissatisfied.
Satisfaction and dissatisfaction in difference.
On the other hand, the differences are negative for “Service interruption,” “Quality of video & sound,” “Operability & interface,” “Streaming speed limit,” “Battery consumption,” “Pay-per-view,” and “Content search.” These factors could be considered to be critical. However, there are no results of satisfaction for “Service interruption,” “Quality of video & sound,” “Operability & interface,” “Streaming speed limit,” “Battery consumption,” and “Pay-per-view”. These trends are rather important and these items are common for all viewers. This is because these qualities deeply depend on network and equipment. Therefore, the only important item that needs attention would be “Content search” to improve CS.
5.4. Results by Method 3
The analysis of every 2 years difference is described in the following subsections. This is followed by an analysis of 4 years as a transitional approach.
5.4.1. Difference in satisfaction and dissatisfaction between 2013 and 2014
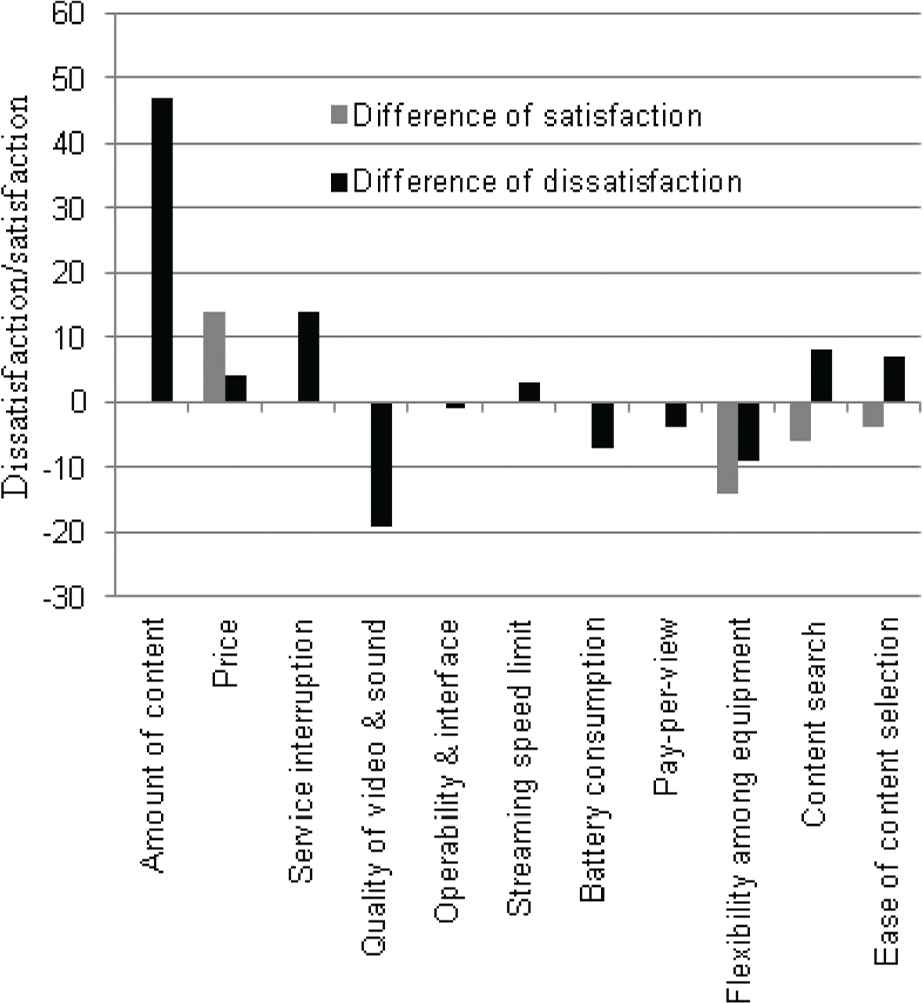
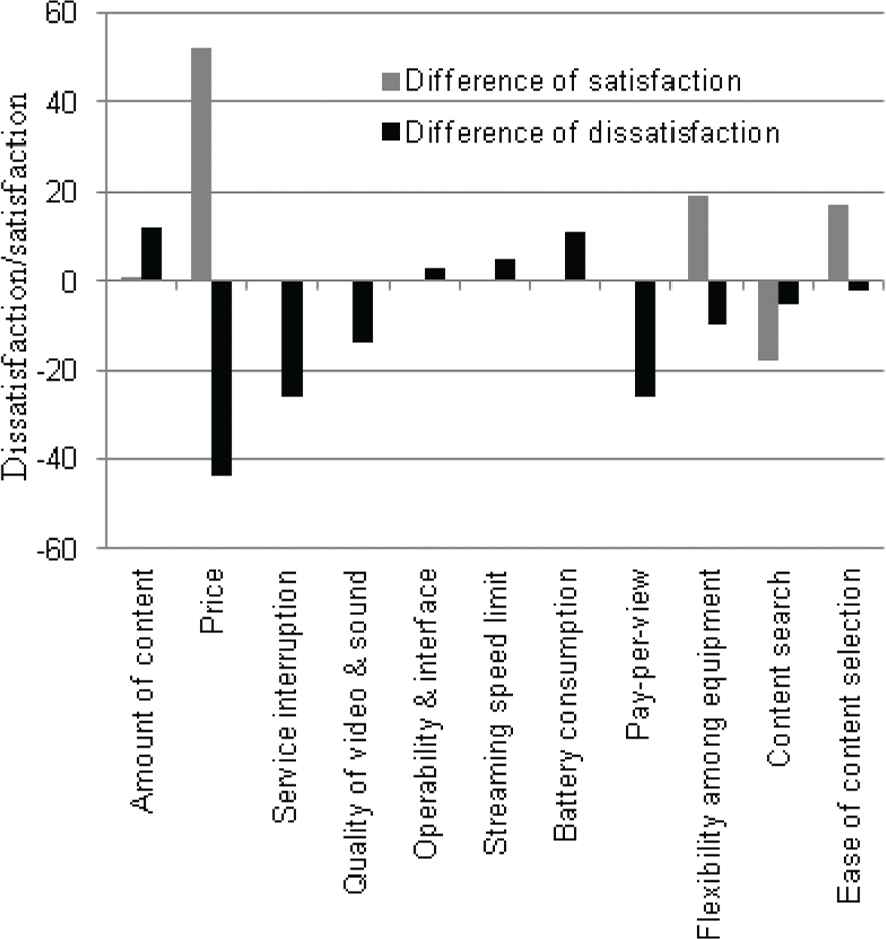
The difference in satisfaction between 2013 and 2014 is calculated as satisfaction in 2014 subtracted by that in 2013. The bar charts in gray are shown in Figure 7. Satisfaction is increased when the value is positive, while that is decreased when the value is negative. “Price” has large positive value as 124 points, whereas “Amount of content” and “Ease of content selection” have large negative values.
Transitional difference among satisfaction and dissatisfaction (2013–2014).
On the other hand, the difference in dissatisfaction between 2013 and 2014 is calculated in the same manner. The bar charts in black are shown in Figure 7. The dissatisfaction is increased when the value is positive, while it is decreased when the value is negative. Only “Streaming speed limit” has a positive value of 31 points and has thus increased.
As for the difference comparison point of view, the cases in which difference of satisfaction is negative or that of dissatisfaction is positive have to be checked (namely, “Amount of content” and “Streaming speed limit”). Although “Amount of content” has negative satisfaction value, it has also negative dissatisfaction value and that value is small. Therefore, users can be considered to be accustomed to the amount of content. Although the positive value of dissatisfaction of “Streaming speed limit” is small, the performance of server or network capacity may have to be checked.
5.4.2. Difference in satisfaction and dissatisfaction between 2014 and 2015
The difference in satisfaction between 2014 and 2015 is calculated as satisfaction in 2015 minus that in 2014. The bar charts in gray are shown in Figure 8. Satisfaction is increased when the value is positive, while it is decreased when the value is negative. Only “Price” has continues to be a positive value from 2013 and 2014. This can be attributed to users getting accustomed to purchasing for services.
Transitional difference among satisfaction and dissatisfaction (2014–2015).
However, “Flexibility among equipment,” “Content search,” and “Eases of content selection” have negative values.
The difference in dissatisfaction between 2014 and 2015 is calculated in the same manner. The bar charts in black are shown in Figure 8. Dissatisfaction is increased when the value is positive, while that is decreased when the value is negative. “Amount of content” has the highest positive value, followed by “Service interruption,” “Content search,” and “Ease of content selection”. “Quality of video & sound” has the largest negative value followed by “Flexibility among equipment,” “Battery consumption,” and “Pay-per-view”.
These results can be attributed to two types of users. The first are those who are already accustomed to using video distribution services, and thus feel satisfied. The second type is those who are new users and feel dissatisfied to inconvenience faced in using an unfamiliar service.
5.4.3. Difference in satisfaction and dissatisfaction between 2015 and 2016
The difference in satisfaction between 2015 and 2016 is calculated as satisfaction in 2016 minus that in 2015. The bar charts in gray are shown in Figure 9. Satisfaction is increased when the value is positive, while it is decreased when the value is negative. “Price” continues to have a large positive value as in the case between 2015 and 2016. “Flexibility among equipment” and “Ease of content selection” follow next.
Transitional difference among satisfaction and dissatisfaction (2015–2016).
The difference in dissatisfaction between 2015 and 2016 is calculated as the same manner. The bar charts in black are shown in Figure 9. Dissatisfaction is increased when the value is positive, while that is decreased when the value is negative. “Amount of content” and “Battery consumption” have large positive values, followed by “Streaming speed limit” and “Operability and interface”. “Price,” “Service interruption,” “Quality of video & sound,” and “Pay-per-view” have large negative values. “Amount of content” can be considered to be a potential factor, but the rate becomes small because of appearance of many providers. The situation that “Content search,” “Battery consumption,” “Streaming speed limit,” and “Operability & interface” appear means that users view not only by PC/smartphone at home but also by smartphone outside as the change of lifestyle.
5.4.4. Transitional approach
In considering the customers’ changes of perception and underlying dissatisfaction factors, the difference between trends of satisfaction and dissatisfaction is important. Because raw data for each customer are not included in the questionnaire results in this study, it is necessary to assume customer behavior. There are two types of assumptions. One is that a decrease in satisfaction is independent of an increase/decrease in dissatisfaction. The other is that a decrease in satisfaction is caused by dissatisfaction. We have assumed that satisfaction is independent of dissatisfaction in this study.
The results using method 3 are shown in Figure 10. The vertical axis shows the value D.
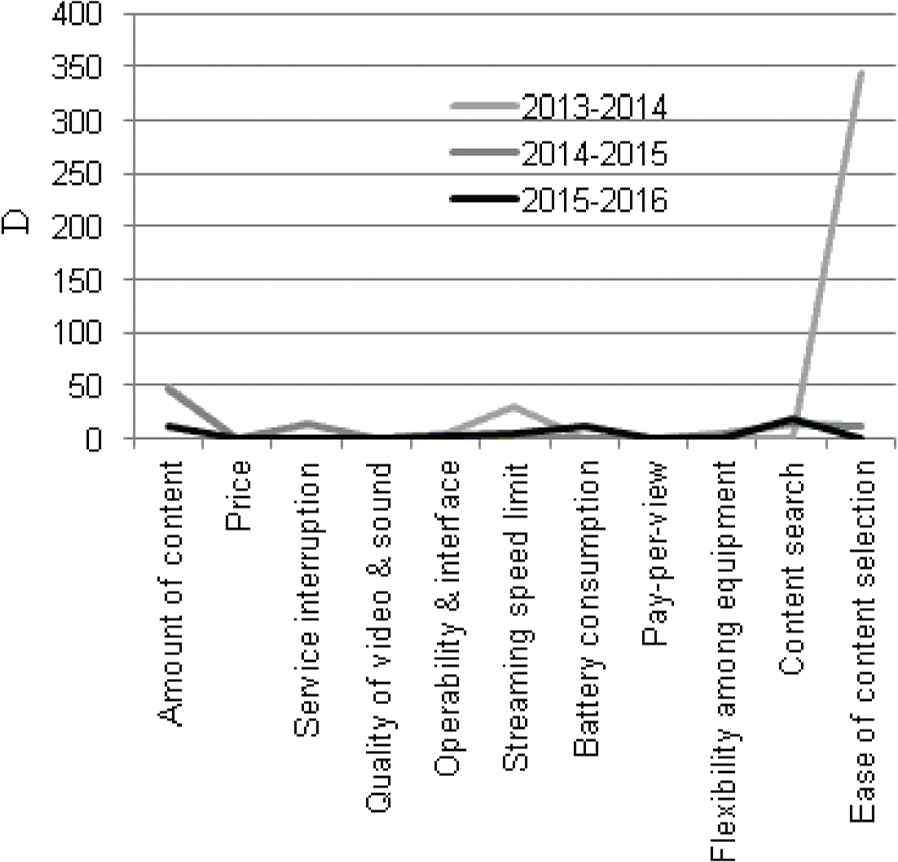
Algorithm and results.
Between 2013 and 2014, the largest D value is at “Ease of content selection,” and “Streaming speed limit” follows next. Between 2014 and 2015, the largest D value is at “Amount of content,” followed by “Service interruption,” “Content search,” and “Ease of content selection” follows next. Between 2015 and 2016, the largest D value is at “Content search,” then “Amount of content” and “Battery consumption” follows next. The changes of values are small during the 4 years except “Ease of content selection” in the early years.
Figure 11 shows the portfolio for the factors by calculated value D. There are four situations according to the D value and patterns. “Ease of content selection,” “Content search” and “Service interruption” move to no problem region as time goes by. It is considered that many users get accustomed to these situations or improvement has a positive effect on them. “Streaming speed limit” and “Amount of content” stays in Pattern 2 region. This means the improvement gives good effect for the existing users to some extent, while it is essential to consider this for new users. “Operability & interface” and “Battery consumption” move from no problem to Pattern 2. It is necessary to consider efficient countermeasures especially for new users and new lifestyle.
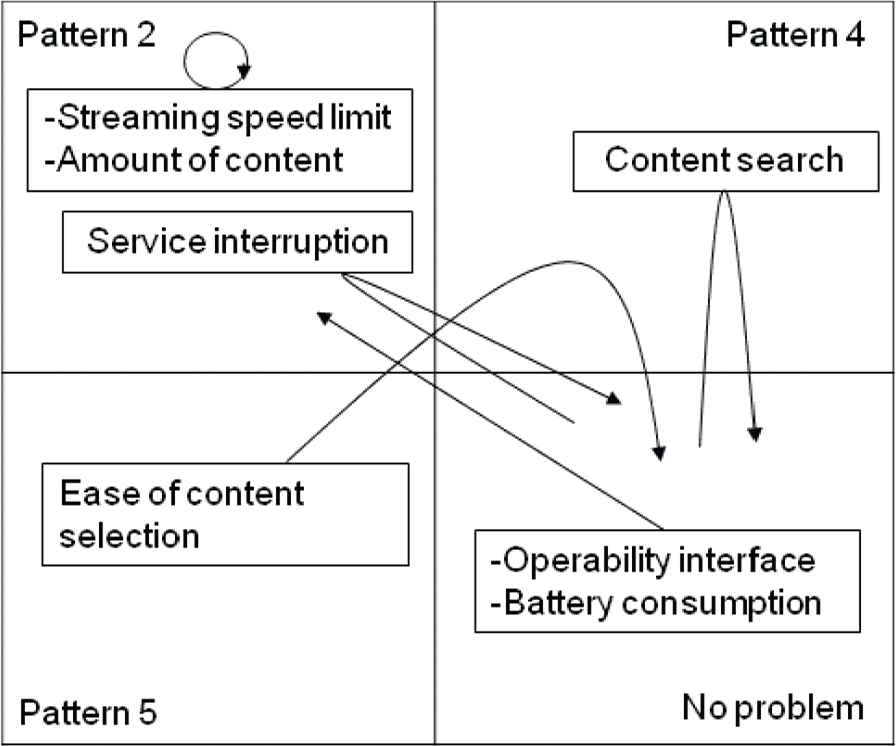
Portfolio representation for improving factors.
Over a period of time, as the number of viewers increases, the effect of each improvement decreases. The existing users get accustomed to using video distribution services. We can see the effect on new users from the results. The new users at early stages feel dissatisfied while searching their favorite contents due to poor application mechanisms, whereas those at later stages feel dissatisfied also due to network and equipment. We carefully account for these changes in user behavior.
6. CONCLUSION
Customer satisfaction is the key to customer retention. As ICT rapidly develops in every field, focusing on merely improving factors that satisfy/dissatisfy users at a given point in time is not effective. It is important to understand customers’ changes of perception and underlying dissatisfaction factors to increase customer base. For this reason, a time-series analysis considering the change of circumstances is important for ICT goods/services. This paper discussed a transitional approach to find improvement factors in video distribution services.
In general, obtaining raw data from questionnaire responses is expensive. Therefore, this method may not be attractive to small and medium enterprises. One of our objectives was to analyze only statistical data to reduce the costs. However, it is possible to cross-check the actual behavior using raw data to validate the transitional approach. Future work in this area will involve an analysis of the relationships among factors and customer demographics to characterize video distribution services.
CONFLICTS OF INTEREST
The authors declare they have no conflicts of interest.
REFERENCES
Cite this article
TY  - JOUR
AU  - Motoi Iwashita
PY  - 2019
DA  - 2019/09/24
TI  - Transitional Method for Identifying Improvements in Video Distribution Services
JO  - International Journal of Networked and Distributed Computing
SP  - 141
EP  - 148
VL  - 7
IS  - 4
SN  - 2211-7946
UR  - https://doi.org/10.2991/ijndc.k.190911.001
DO  - 10.2991/ijndc.k.190911.001
ID  - Iwashita2019
ER  -