
Stochastic Capacity Acquisition and Allocation Model for Bandwidth Brokers under Fuzzy Volume Based Pricing Scheme
- DOI
- 10.1080/18756891.2016.1149998How to use a DOI?
- Keywords
- Telecommunications market; bandwidth broker; fuzzy stochastic mathematical programming; fuzzy VSS and EVPI
- Abstract
In this paper, bandwidth acquisition and allocation problem of a telecommunications Bandwidth Broker (BB) is analyzed under uncertain end-user capacity requests and pay-per-byte (volume) based pricing policy. Furthermore, related objective function coefficients such as revenue and costs are modeled as fuzzy numbers in order to cope with vague market conditions. By integrating fuzzy mathematical programming and two-stage stochastic programming techniques, deterministic equivalent of single objective profit maximization problem of BB is obtained solved to optimality. In addition, infrastructure related performance measures such as delay and jitter amounts in the network are modelled via stochastic parameters that obey some known probability distributions. Two performance statistics namely fuzzy Expected Value of Perfect Information (EVPI) and fuzzy Value of Stochastic Solution (VSS) are defined to demonstrate the efficiency of proposed methodology compared to deterministic approach. In addition, several secondary performance measures such as expected capacity utilization, expected demand fulfilment ratio and capacity loss are calculated under different problem settings. In conclusion, numerical experiments showed that fuzzy stochastic method provides more profit depending upon problem size in compression with deterministic strategy.
- Copyright
- © 2016. the authors. Co-published by Atlantis Press and Taylor & Francis
- Open Access
- This is an open access article under the CC BY-NC license (http://creativecommons.org/licences/by-nc/4.0/).
1. Introduction and Motivations
During the last decades with the increasing usages of internet and other communication tools, telecommunications networks have become a very complex environment. It is possible to classify decision making problems that are encountered in telecommunication environment into three different levels such as technological, network and enterprise1,2. Figure 1 depicts telecommunication problem topologies. The technological level deals with design of different elements of telecommunication networks such as routers and switches2, packet scheduling and buffer management problems. Network level problems concentrate on design and planning of different kinds of telecom networks which may differ by size and by technology involved. Several decisions such as capacity expansion decision of links and allocation of servers are dynamic in nature and consist of several time periods. At the enterprise level telecom firms are considered as an actor in a market where they interact with other actors such as industrial companies and customers; thus this level can be classified as integration at the highest level. Determination of pricing policies, capacity provider selection and resource allocation, and selection of service types that telecom firm will offer to the market are examples of some basic decisions taken at this level2,3.
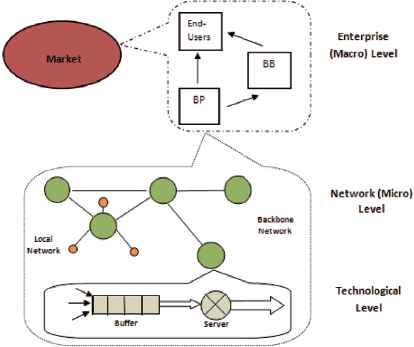
Telecommunications’ problems topology1.
The problem studied in this research falls into the enterprise level category. At this level, it is assumed that telecommunications market consists of three important main players, which are customers or end-users who use network capacity to accomplish their tasks, backbone network providers (BP) and inter-mediaries or bandwidth brokers (BB). Whereas BPs own the network infrastructure, BBs do not have their own network facilities and in order to provide the service BBs have to lease the necessary network capacity from BPs or other bandwidth brokers. Consequently, BBs have to decide how much capacity to acquire and the BPs decide the price to charge for the network capacity 3.
Due to the introduction of new technologies and services such as GPRS in GSM or ‘video on demand’ for digital subscriber lines, which have led to increase in the end-customer demands 4. Figure 2† depicts the progress of number of broadband users in Turkish telecom market. Hence, with the increasing number of end-customers, number of internet service providers (ISP) has increased in the market as well, which led to higher completion among ISPs.
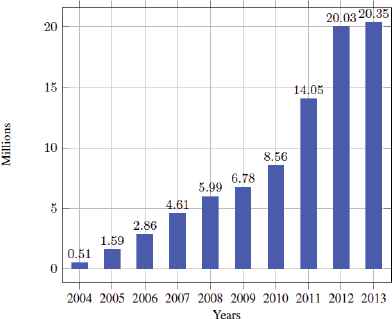
Number of Broadband Internet Subscribers in Turkey.
In Figure 3‡, market shares of Turkish IPSs in the recent years are presented. It can be concluded from recent data that even though market leader TTNet (only backbone in the market) keeps its position, its share decreases steadily. On the other hand, shares of BBs such as Superonline and Doğan Diğital increase in total. Therefore, modeling and solution strategies are needed for BBs in order to stay competitive in emerging markets, which is one of the motivations of this study.
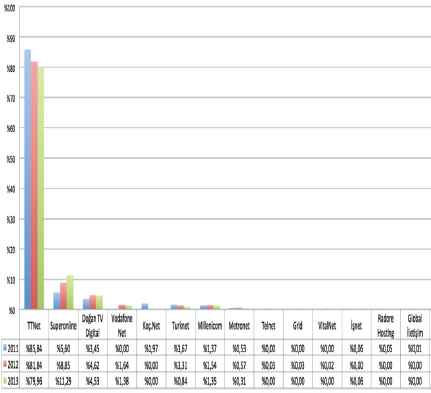
Progress of ISPs’ market shares in Turkey.
We consider BB’s profit maximization problem in an environment in which the firm can lease network capacity at competitive prices from different BPs with different quality of service (QoS). In order to gain profit, a BB has to first acquire (lease) the capacity (bandwidth) from BPs then lease bandwidth to end-users. After leasing decision, the BB has to allocate leased bandwidth into acquired capacities by meeting QoS requirements of each customer. Figure 4 depicts relationships and interactions between each players in the modeled telecommunications market.
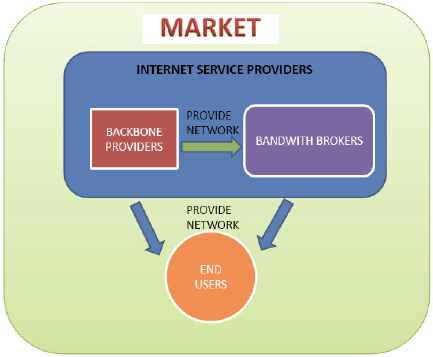
The modelled market structure.
The solution of the proposed model provide essential strategic planning information to the decision makers of BB such as how much bandwidth for how long should be leased from each BP, which service providers should be chosen by considering QoS levels, after realization of customers’ demands which customer’s bandwidth request should be accepted and which of them should be rejected. In addition, solution provides information about how accepted bandwidth demands should be allocated into leased capacity by considering quality of service parameters such as delay and jitter.
Like all real world phenomena, telecommunication network are affected by uncertainties. Uncertainties in telecommunications may arise from either environmental or internal reasons. In either case, neglecting uncertainties in the modelling stage may result in inaccurate and inefficient solutions1. Hence, we model and solve bandwidth acquisition and allocation problem of a telecommunications BB by taking into account uncertainties arising due to market and infrastructure conditions and by integrating fuzzy and stochastic programming methodologies.
In the remaining of this section, brief background information about pricing policies and QoS parameters in telecommunications are provided which are required to build up BB’s profit maximization model. Afterwards contributions and uniqueness of this study are emphasized.
There exist several pricing policies to model capacity acquisitions between BB and BPs as well as and endusers. Two widely used classes of pricing policies are static pricing and dynamic pricing. In the static pricing schemes, prices are fixed and are not depended on the system’s state. On the other hand, in dynamic pricing schemes, the service provider sets prices to the consumers based on the value; i.e., the amount of data, the transmission rate and Quality of Service (QoS) that the customers consider to the lease. Dynamic schemes models are believed to be more powerful and flexible than static pricing strategies and have been used in many areas of industry in addition to telecom (see rf.5,6,7), such as retailing, manufacturing, airlines, and e-business8,9. To illustrate, well-known all-you-can-send (or flat rate) pricing policy is a static scheme in which the customer leases bandwidth at a fixed price for a fixed contract period10,11. On the contrary, the pay-per-byte or volume based pricing scheme is a dynamic scheme due to the fact that total usage cost is calculated as a function of data transmitted with-out any loss which highly depends on the network conditions such as instantaneous congestion during data transmission12,13. A brief summary of past researches on internet pricing and dynamic pricing models can be found in14. In this research, the pay-per-byte scheme is integrated into profit maximization objective of BB to model both acquisition costs occurring during capacity purchases from BPs and capacity selling revenues obtained during bandwidth leasing to end-users. Applying volume based pricing scheme during both capacity buying and selling stages can be considered as one of the uniqueness of proposed model.
Serving numerous users with highly-diverse contents under limited resource capacity is a challenging issue15. Therefore, end-users with different requirements are classified into different service classes by capacity providers. For each class a particular QoS is assigned, which defines group of service measures representing the terms of user agreement of the service is assigned. Several metrics are defined in literature to measure QoS. Figure 5 presents a comprehensive taxonomy created by Malik et al.16. Common QoS metrics used during service provisioning are delay, packet loss, jitter, response time, reliability, and availability. Delay is measured as travel time of data packet from source to destination across the network structure17,18,19. The delays of scheduling from data packet to data packet may lead to buffered packet delay because of altering delays in transmission. This phenomenon is known as jitter20. The packet losses occur due to buffer overflow and indicates data dropped or damaged1. OoS requirements are usually application-specific. Certain applications such as voice conferencing are delay and jitter sensitive. For example, for VoIP applications round-trip delay must be in the range of to 200–300 ms, and jitter has to be less than 50ms so that playback at the receiver remains smooth21. In general, interactive applications, such as web browsing, video conferencing and live streaming are delay and jitter sensitive. On the contrary, Email, file sharing and remote login are not affected by jitters in the network traffic16. In addition, routine operations usually performed by firms such as bulk file transfer are concerned more with average packet loss rate. In this study, we will only focus on the QoS parameters of delay, jitter, and packet loss rate. In conclusion, BBs and all ISPs must support multiple QoS strategies to support different applications. However, without a appropriate pricing strategy, any QoS based scheme would be useless. Thus, has to identify suitable price for each end-user class and then allocate necessary network resources to meet all service agreements.
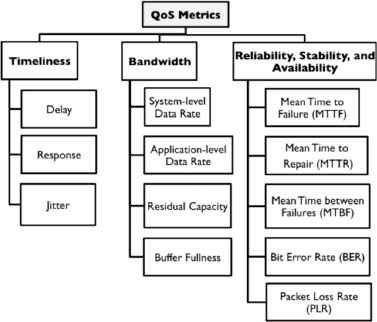
Classification of QoS metrics16.
The proposed research contributes the existing literature in both managerial and theoretical perspectives as follows: (a) BB’s point of view modeling approach rather than provider or firm side modeling, which dominates the current telecommunications literature. (b) Taking into account market related uncertainties such as profit and cost terms via fuzzy methodology and handling infrastructure related unknowns such as QoS parameters by stochastic programming techniques. (b) Integration fuzzy and stochastic techniques for solving managerial (macro) level telecommunication problem rather than network infrastructure (micro) level such as routing and network topology design problems. (d) From algorithmic point of view, development of two new metrics fuzzy expected value of perfect information and fuzzy value of stochastic solution in order to measure efficiency of methodology compared to deterministic approaches.
The rest of the paper is organized as follows: Section 2 presents brief literature survey about non-deterministic methodologies that are applied to telecommunication network problems both on managerial and infrastructure levels. Section 3 provides background information about fuzzy and stochastic programming then discusses how these two methodologies are integrated in order to solve BB’s profit maximization problem. In this section, the proposed model with probabilistic QoS constraints is discussed. In Section 4, algorithms for main performance statistics are provided. In addition, an extensive computational study with sensitivity analysis is given in order to demonstrate the efficiency of suggested method in comparison with deterministic approaches. Finally, Section 5 summarizes important results and describes future goals respectively.
2. Related Works
Stochastic and fuzzy methods have been applied to telecommunications problem for decades in order to find optimal or near optimal solutions under uncertainty. Hence, there exists huge amount of publication in the current literature. Related literature is divided into subsections to classify methods developed to solve different level of telecommunication problems. The first part of literature review lists article related to supplier selection and demand allocation not only in telecom networks but also in supply chain literature. In the following part, articles related to the fuzzy based routing algorithms in the networks are presented. The remaining parts are devoted to modeling of QoS parameters under uncertainty and forecasting of demand with fuzzy based methodologies. Besides, detailed discussions and review papers about fuzzy logic applications in telecommunications can be found in refs.22,23,24.
The first stream of the literature survey concentrates on provider (supplier) selections and order (demand) allocation articles encountered in telecommunications and the supply chain. Turan et al.25 investigate a stochastic optimization problem that a telecommunications intermediary faces when acquiring network capacity from a market. The problem is modeled as a two-stage stochastic integer programming under all-you-can send pricing policy. On the other hand, QoS parameters are assumed to be deterministic and modeled via crisp constraints. Finally, optimal behavior of intermediary analyzed under different problem settings such as changing demand distribution type and variance of the demand distribution of end-users. In studies26 and 3 QoS parameters (delay and jitter) are modeled as random variables, in which end-users and intermediaries are considered as decision makers, respectively. On the other hand, delay and jitter amounts guaranteed by network providers and maximum delay jitter levels tolerable for end-users are modeled as fuzzy numbers from telecom firm’s point of view in27. An outsourcing provider selection problem for a telecommunication company under vague information is studied by Uygun et al.28. Their integrated method uses Fuzzy Analytic Network Process (FANP) technique in combination with Decision Making Trial and Evaluation Laboratory (DEMATEL) technique. In proposed method as a first step, DEMATEL method is used in to put forward the interrelationship among the main criteria (competence of the company in field projects, experience of the company, etc.), and then local weights of the sub-criteria (credibility, total capital, etc.) and sub-subcriteria (GSM backgroud of managers, employee number in different units’ etc.) are calculated by Fuzzy ANP approach on the basis of cause-effect relationships that are exposed through DEMATEL method. In addition, Fu et al.29 also come up with fuzzy DEMATEL based method to evaluate telecommunications system providers. They introduce a fuzzy (grey)-based DEMATEL approach that involves the identification of GSDPs, understanding their interrelationship utilizing “fuzzy” data input from management, transforming the fuzzy data into crisp data, completing a series of DEMATEL steps, and eventually arriving at a final prominence–causal relationship diagram with associated analysis. Another interesting outsourcing problem in ISP market analyzed by fuzzy multi-criteria method is presented in30. They use an interactive group decision-making methodology to select/rank IS providers under multiple criteria. The proposed group decision making approach heavily depends on fuzzy TOPSIS approach. They list seven criteria for IS provider selection such as price, product quality, on-time delivery, technological capability, quality of relationship with ISP, professionalism of salesperson, responsiveness to customer needs. Onut et al.31 present an integrated FANP and fuzzy TOPSIS (FTOPSIS) methodology to evaluate and select the most suitable suppliers for a telecommunication company in GSM sector. They use triangular fuzzy numbers in all pair-wise comparison matrices, which is different from the conventional FANP method. In the mentioned study, criteria (cost, references, quality of the product, delivery time, institutionality, execution time) weights are inserted to the FTOPSIS methodology to rank the suppliers for selection.
In addition to telecommunications, Provider (vendor) selection and demand allocation problems under uncertainty especially under presence of vague information are studied extensively in the supply chain literature and several solution algorithms are proposed. Therefore, in this section of literature review a brief survey about fuzzy mathematical programming applications in other application domains rather than telecom is provided. Kabak et al.32 propose a possibilistic linear programming (PLP) model for supply chain networking decision. In the investigated model not only problem parameters such as demands and cost terms but also decision variables such as production amounts are assumed to be fuzzy numbers. As a solution methodology, the PLP model is converted to an LP model by using mathematical operations defined for fuzzy numbers. Mula et al.33 investigate a material requirements planning problem in an industrial environment under lack of knowledge in data and existent fuzziness jointly in the processes of production planning. Their model considers fuzzy constraints related to the total costs, the market demand and the available capacity of the productive resources and fuzzy coefficients for the costs due to the backlog of demand and for the required capacity. There also exists vast amount literature about multi-objective fuzzy optimization for supplier selection and demand allocation problems in diverse areas such as34,35,36.
Another application of fuzzy logic in telecommunications is designing and configuring large networks. Douligeris37 suggests using hybrid systems integrating expert systems and neural networks methods rather than classical hard decision methods for network design. Author presents an integrated fuzzy expert system, machine learning, and neural networks approach to evaluate computer network design. After designing stage, efficient routing decision and algorithms are needed. In this stage, a lot of critical routing factors should be taken into considerations such as reliability and availability. Fuzzy routing algorithms are commonly used alleviate arising difficulties in routing. To illustrate, Wang38 claim that a fuzzy-based routing scheme based on reputation, bandwidth and distance can improve the throughput of network. The task of routing data is also investigated by Ortiz et al.39, in which fuzzy logic is utilized to perform role assignment during route establishment and maintenance. Number of hops to the base station, and the remaining node energy are considered as input variables and modeled as fuzzy number. At the implantation of algorithm, they use Mamdani-based fuzzy rules.
During routing decisions, QoS constraints have to be taken into account. Thus, routing algorithms used should avoid unexpected delays that result in QoS fluctuations. Fernandez et al.40 develop fuzzy control method to provide QoS guarantees in a Diff-Serv telecom network. Their methodology applies a genetic algorithm to traffic statistics to obtain fuzzy controller parameters. Afterwards, fuzzy controller parameters are optimized by a genetic algorithm in order to produce an improvement in QoS metrics such as delay and jitter for time-sensitive traffic. There are also some studies in which QoS parameters are modeled as fuzzy number. For example, Mansouri et al.41 propose a combined QoS and Quality of Experience (QoE) evaluation system by utilizing the combination of fuzzy inference systems and fuzzy evidence (Dempster–Shafer) theory. They define fuzzy trapezoidal membership functions, which are estimated by interviewing with networking experts, for each QoS metric such as response time, availability, jitter and bandwidth. Another research study proposed by Chen et al.42 also models QoS parameters as trapezoidal fuzzy number. However, other source of uncertainties regarding bandwidth requests or prices are not included in their model.
One of the vital inputs of network traffic management, infrastructure optimization and planning in telecommunications is forecasting the data (demand) traffic. Decision makers of BPs and BBs can predict demand by making use of the historical data. In addition to commonly used statistical forecasting techniques, computational intelligence-based approaches have pervaded recent literature. In this direction, Mastorocostas and Hilas43 propose a modified Takagi–Sugeno–Kang fuzzy neural system in order to forecast the outgoing call volume of a University Campus with more than 6000 employees and 70,000 students. They also include performance comparison of proposed methodology with seasonally adjusted linear extrapolation methods, exponential smoothing methods and the SARIMA method. Another fuzzy neural network based data volume forecasting method in telecommunications is suggested in44. It is claimed that mentioned method perform forecasting without requiring prior knowledge of the exact order of the time-series due to the consequent parts of the fuzzy rules being small block-diagonal recurrent neural networks with internal feedback. After successful forecasting of end-users demand, BBs as well as BPs have to look for solutions to keep their customers satisfied and thus loyal with the company. As a solution to this issue, Keropyan and Gil-Lafuente45 present a fuzzy based Hungarian method that allow assigning different loyalty programs to customers with different characteristics in order to provide a model that helps decision makers deciding what kind of customer loyalty programs they should offer to their clients from different segments. Hanafizadeh and Mirzazadeh46 also study market segmentation problem of a telecommunication company. They present a technique which integrates Fuzzy Delphi method and self-organizing maps (SOM) to cluster customers according to their various characteristic variables such as demographics, socio-economic factors, and geographic location.
A recent fuzzy c-means based segmentation (clustering) algorithm for telecommunication data is developed in47. Country level telecommunications issues analysed by fuzzy methods are investigated in48,49. To illustrate, Stula et al.48 develop a Fuzzy cognitive map (FCM)that is a qualitative modelling and behavior simulation method predicts Internet spreading rate in different countries. Another example can be found in49, in which data envelopment analysis (DEA) and fuzzy data envelopment analysis (FDEA) are integrated for efficiency assessment of wireless communication sectors. The proposed algorithm uses indicators as cellular cost of a 3-min local call, cellular connection charge, and mobile communication revenue as input for efficiency assessment and optimization. Finally, fuzzy models regarding to ranking of the strategic actions of mobile cellular telecommunication using a fuzzy quality function deployment (QFD) method is suggested by Khademi-Zare et al.50. They model QFD input parameters such as customer attributes (delivery time, sim card price etc.) and strategic actions (traffic measurement, information technology etc.)as fuzzy triangular numbers to overcome ill-defined judgments on inputs.
In conclusion, even though there exist several research articles related to application of fuzzy and stochastic programming in the telecommunications as well as other areas, there is almost no study that combines both methodologies neither at lower level (routing and design) nor at upper level (provider selection) communication networks areas. Thus, the proposed study can extend the use of fuzzy and stochastic programming in backbone selection and demand allocation under volume based pricing scheme.
3. Fuzzy stochastic linear programming model
A fuzzy linear programming (FLP) model can be written as in Eq.(1) by using definition and notations introduced by51.
We assume that all fuzzy numbers used in the mathematical model have triangular membership function. In other words, any objective function co-efficient can be redefined as
Following is the single objective counterpart of the model (2):
In model (3), w is defined as w = (w1, w2, w3) ⩾ 0. Model turns into parametric linear programming problem, if w is chosen as w1 + w2 + w3 = 1 and set to w3 − w1 = ε. Here, ε, has to be altered between −1 and 151. All of the sets, parameters and decision variables used in mathematical formulation are presented in Table 1. The objective function of volume based pricing policy with fuzzy coefficients is presented in Eq. (4). Fuzzy revenues and fuzzy opportunity costs depend on scenarios therefore, the expected values for these terms have to be calculated. The fuzzy expected costs/revenues are obtained after mentioned terms are multiplied by realization probability of each scenarios ps and summed all over possible scenario set. The problem of BB is to maximize fuzzy expected profit under volume based pricing scheme. New model is a fuzzy stochastic linear programming model (FSLP) with fuzzy objective parameters.
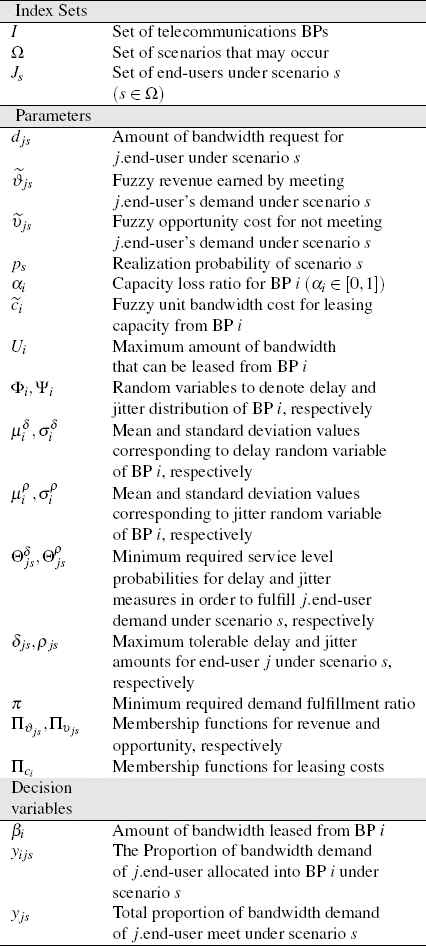
Mathematical model notations.
Eq.(5) explains how function Ξ is evaluated in terms of problem parameters.
After applying the methodology suggested by51 on objective function of BB in Eq. (4), transformed linear objective equation is showed in Eq.(6). Where unit revenues
Eqs.(6–15) presents FSLP model constraints. Constraint set (6) guarantees that it is not possible to allocate total customer demand that is more than the purchased capacity from corresponding BP under each scenario. Total capacity allocated to a particular backbone has to smaller than or equal to the acquired bandwidth from corresponding supplier minus capacity losses. Eq.(7) ensures that amount of bandwidth purchased from any BP can not be more than BPs’ capacity that is sold at the market.
Eq.(8) guarantees that bandwidth request of any end-user under any scenario can only be assigned to a purchased capacity that satisfies delay requirement of user above some predefined probability.
Similarly, Eq.(9) ensures that bandwidth demand of any end-user under any scenario can only be allocated to a particular purchased capacity that meets jitter requirement of customer above redefined probability.
It is generally assumed that QoS parameters are distributed normally. Based on this assumption, deterministic counter parts of Eqs.(8) and (9) can be rewritten as in Eqs.(10) and (11), respectively.
Both inequalities are in linear form, so FSLP of BB can be solved via traditional linear programming texhniques such as simplex algorithm.
Eq.(12) is used for ensuring the minimum demand satisfaction level met under each scenario considered. Eq. (13) ensures that total amount of allocated (satisfied) bandwidth portion of each end-user can not be more than their requests under all scenarios. The constraint set (14) guarantees that total amount of satisfied bandwidth demand of a customer has to be equal to sum of allocated bandwidth portions of that demand into BPs.
4. Computational Experiments
For computational study, three different types of problem setting with changing number of BPs (|I|), end-users (|J|) and scenarios (|S|) are chosen. Five different and independent problem instances are generated for each type of problem setting as in52. For example, problem set I15J50S10 in Table 2 indicates a problem type in which there exists 15 BPs, 50 end-users at market and there exist 10 possible future bandwidth demand scenarios that may occur.
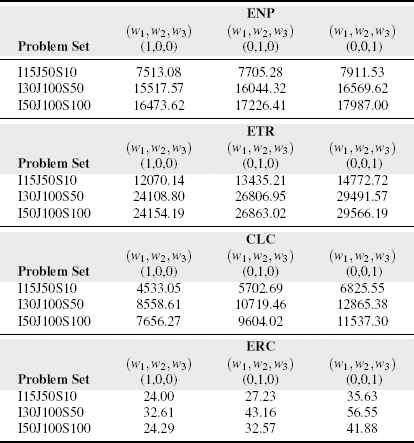
Optimal fuzzy ENP, ETR, CLC and ERC values for RP problem.
All of the generated problem sets are tested by using different w1, w2, w3 values. Changing values of (w1, w2, w3) are chosen from set {(1, 0, 0), (0, 1, 0), (0, 0, 1)} in order to find the most pessimistic, the most expected and the most optimistic values of net profit.
Each end-user’s demand djs is generated from normal distribution. However, to prevent negative bandwidth demand generation from normal distribution, truncation procedure is applied. The realization probabilities of each scenario are generated from uniform distribution between [0, 1] afterwards these probabilities are normalized.
The capacity acquisition and allocation problem of BB that is modeled in previous section provides so-called here-and-now solution, and the entire FSLP model named as recourse problem (RP) model. The optimal objective function value of RP (Eq.(6)) is denoted as
Table 2 summaries the averaged results under each problem setting for RP model. The increasing number of end-users |J| in the market leads to sharp increasing in fuzzy ENP value under every problem setting.
When the most optimistic and pessimistic values of ENP is compared, 5.30%, 6.78% and 9.19% differences are observed for problems sets I15J50S10, I30J100S50 and I50J100S100, respectively. Therefore, it can be concluded that increasing uncertainty via number of scenarios, end-users and back-bones causes larger gaps between optimistic and pessimistic values of ENP. On the other hand, the percentage gap between optimistic and pessimistic values remain unchanged for ETR and CLC statistics namely the gaps stay around 22.3% and 50% for ETR and CLC, respectively. The gap for ERC increases from 48% to 72% when problem type changed from I15J50S10 to I50J100S100.
Table 3 presents averaged secondary performance statistics such as fuzzy total capacity bought (TCB), fuzzy capacity loss (CL), fuzzy expected capacity utilization percentage (ECUP) and fuzzy number of selected backbone providers (NSS) for RP model. For a given value of w, statistics ECUP and CL can be evaluated as follows:
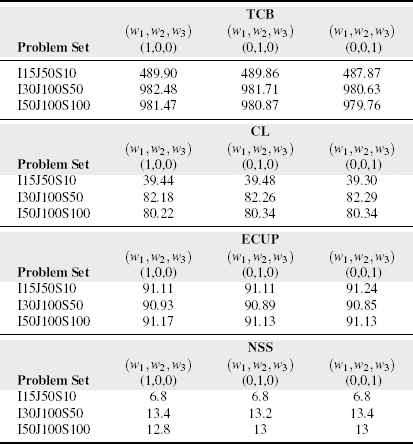
Optimal fuzzy TCB, CL, ECUP and NSS values for RP problem.
The natural consequence of increasing number of end-users in the market is the more bandwidth acquisition from BPs for BB. CL statistic and TCB are positively correlated which means that higher amount of capacity purchase causes increase in the amount of total capacity loss.
When the entire problem instances investigated, it can be seen that the acquired capacity is utilized around 90% (ECUP statistic). Interestingly, there is no obvious relationship between the changing value of w and CL, NSS and ECUP measures.
Another important statistics needed for decision makers of BP is the expected demand fulfillment ratio (EDFR), which provides information about the ratio of the satisfied bandwidth requests to total bandwidth requests of end-users. The higher value is needed to establish long term relationship with clients. Low EDFR may cause to diminishment in ENP values due to the decreasing capacity requests. Figure 6 depicts the averaged fuzzy EDFR for each problem type. EDFR statistic fluctuates between 98.6% and 99.5% and it is effected by w values. Moreover, it is observed that EDFR is relatively higher for the test instances in which total amount of bandwidth request is excessive.
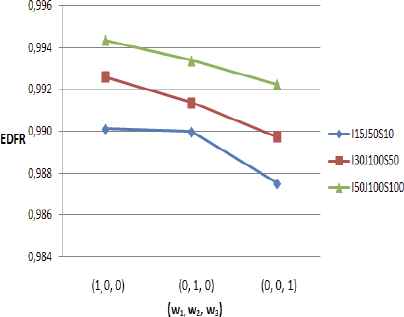
The effect of altering values of w on EDFR statistic for RP model.
4.1. Fuzzy Expected Value of Perfect Information (EVPI ˜ VSS ˜
In order to test applicability of proposed model, two new models which are called as WS and EEV have to set up and solved. WS model defines wait-and-see solution of the model and its optimal objective function value is
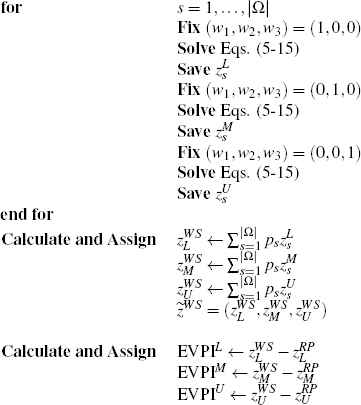
The proposed
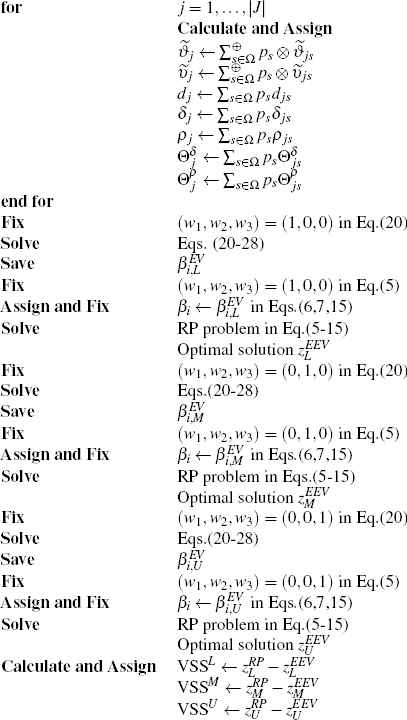
Just solving RP and WS models do not provide too much information to decision makers. Thus, BB has to measure the increase in fuzzy ENP obtained by solving the FSLP instead of the expected value problem (EV) that is attained by replacing all random variables by their expected values54. EEV is calculated by the expected objective value obtained while using the optimal solution of the deterministic problem EV. The Value of Stochastic Solution (VSS) measure combines RP and EEV and compares the here-and-now and expected value approaches53. The simpler version of FSLP is formulated between Eq.(20) and Eq.(28). EV model essentially tries to maximize fuzzy profit rather than expectation of it by not taking into account randomness arising in market and infrastructure. In EV model, none of the parameters depends on future scenarios that may occur.
The bandwidth acquisition amounts from each BP
The proposed
Table 4 summarizes results gathered from running fuzzy VSS and fuzzy EVPI algorithms for each problem set on RP, EEV and WS models. All of the results are presented in TFN format. Problem set I15J50S10 3 does not have a feasible solution when optimal solution of
| Problem Set | ||
| I15J50S10_0 | (134.37, 168.39, 208.35) | (55.72, 59.61, 63.32) |
| I15J50S10_1 | (512.87, 663.86, 814.63) | (164.48, 174.91, 186.66) |
| I15J50S10_2 | ((951.67, 1068.25, 1183.52) | (100.94, 118.40, 139.06) |
| I15J50S10_3 | (***, ***, ***) | (520.52, 607.66, 692.04) |
| I15J50S10_4 | (1499.31, 1673.50, 1850.60) | (207.18, 253.38, 294.84) |
| Average | (776.96, 903.76, 1033.48) | (209.77, 242.79, 275.18) |
| Problem Set | ||
| I30J100S50_0 | (1394.51, 1755.50, 2116.63) | (276.13, 327.98, 371.44) |
| I30J100S50_1 | (1221.35, 1542.25, 1854.57) | (247.08, 295.03, 344.69) |
| I30J100S50_2 | (927.40, 1190.52, 1452.70) | (420.09, 492.81, 556.95) |
| I30J100S50_3 | (2431.03, 3051.87, 3690.88) | (646.67, 763.28, 872.95) |
| I30J100S50_4 | (1827.09, 2297.66, 2777.53) | (560.96, 674.12, 786.42) |
| Average | (1560.28, 1967.56, 2378.46) | (430.19, 510.64, 586.49) |
| Problem Set | ||
| I50J100S100_0 | (1728.44, 2150.82, 2599.03) | (357.88, 433.65, 506.07) |
| I50J100S100_1 | (2243.64, 2834.07, 3421.93) | (469.44, 559.06, 643.20) |
| I50J100S100_2 | (1817.50, 2306.58, 2790.38) | (509.34, 602.77, 694.18) |
| I50J100S100_3 | (1190.82, 1504.82, 1799.91) | (325.80, 395.06, 460.78) |
| I50J100S100_4 | (1996.56, 2496.65, 2997.80) | (217.10, 253.60, 293.26) |
| Average | (1795.39, 2258.59, 2721.81) | (375.91, 448.83, 519.50) |
Fuzzy VSS and EVPI values for each problem set.
By using data presented in Table 4, the improvement ratios attained by RP model over EEV model can be calculated. In the same manner, the improvement ratios that can be achieved by knowing the future bandwidth demands and prices may also be calculated from presented data. Besides, decision maker of BB may set up a lower threshold ratio based on his experiences to determine which model to solve (RP or EEV).
For mentioned reasons two new statistics are defined as follows:
| Problem Set | ||
| I15J50S10_0 | (0.018, 0.022, 0.026) | (0.007, 0.008, 0.008) |
| I15J50S10_1 | (0.076, 0.098, 0.119) | (0.023, 0.023, 0.024) |
| I15J50S10_2 | (0.142, 0.157, 0.172) | (0.013, 0.015, 0.017) |
| I15J50S10_3 | (****, ****, ****) | (0.069, 0.078, 0.087) |
| I15J50S10_4 | (0.253, 0.284, 0.315) | (0.028, 0.033, 0.038) |
| Average | (0.115, 0.133, 0.150) | (0.028, 0.032, 0.035) |
| Problem Set | ||
| I30J100S50_0 | (0.089, 0.109, 0.128) | (0.016, 0.018, 0.020) |
| I30J100S50_1 | (0.087, 0.108, 0.129) | (0.016, 0.019, 0.021) |
| I30J100S50_2 | (0.065, 0.082, 0.098) | (0.027, 0.031, 0.034) |
| I30J100S50_3 | (0.201, 0.259, 0.323) | (0.045, 0.051, 0.058) |
| I30J100S50_4 | (0.134, 0.168, 0.203) | (0.036, 0.042, 0.048) |
| Average | (0.112, 0.140, 0.168) | (0.028, 0.032, 0.035) |
| Problem Set | ||
| I50J100S100_0 | (0.125, 0.155, 0.186) | (0.023, 0.027, 0.030) |
| I50J100S100_1 | (0.160, 0.200, 0.239) | (0.029, 0.033, 0.036) |
| I50J100S100_2 | (0.123, 0.153, 0.181) | (0.031, 0.035, 0.038) |
| I50J100S100_3 | (0.076, 0.092, 0.107) | (0.019, 0.022, 0.025) |
| I50J100S100_4 | (0.133, 0.163, 0.191) | (0.013, 0.014, 0.016) |
| Average | (0.122, 0.151, 0.178) | (0.023, 0.026, 0.029) |
Calculated
One of the most important results is the statistic
4.2. Sensitivity Analysis
Another important issue for decision makers is to test the stability of solution methodology under dynamic settings such as changing fuzzy revenues and costs. In this direction, the largest problem set I50J100S100 is tested under varying fuzzy objective parameters.
As a first part of the sensitivity analysis, all of the fuzzy parameters in objective function of RP model such as
Table 6 shows effect of ±20% change in fuzzy objective parameters on
| Test scenario | ||
| 20% increase | (2154.47, 2710.30, 3266.17) | (0.122, 0.151, 0.178) |
| Original case | (1795.39, 2258.59, 2721.81) | (0.122, 0.151, 0.178) |
| 20% decrease | (1436.31, 1806.87, 2177.45) | (0.122, 0.151, 0.178) |
| Test scenario | ||
| 20% increase | (451.10, 550.00, 623.40) | (0.023, 0.027, 0.029) |
| Original case | (375.91, 448.83, 519.50) | (0.023, 0.026, 0.029) |
| 20% decrease | (300.73, 359.06, 415.60) | (0.023, 0.026, 0.029) |
The effect of ±20% change in fuzzy objective parameters on
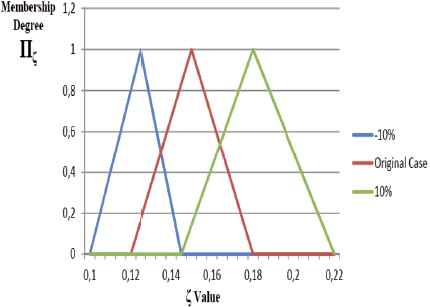
In the second part of sensitivity analysis on fuzzy objective parameters, fuzzy unit revenues are altered between (ϑjs) ± 10% from their original values while keeping the other parameters unchanged. RP, WS and EEV models are run under these new settings and main performance indicators (
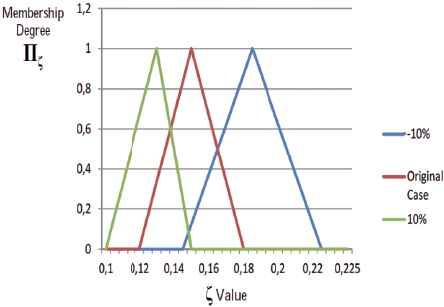
Effect of change in fuzzy unit revenues by ± 10% on
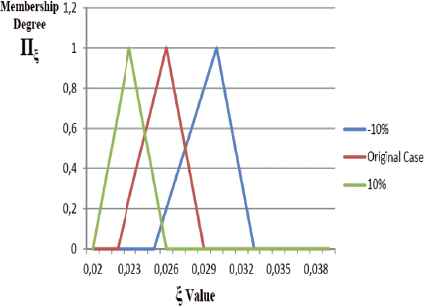
Effect of change in fuzzy unit revenues by ± 10% on
The increasing revenues lead to decrease in
Effect of change in fuzzy unit costs by ± 10% on
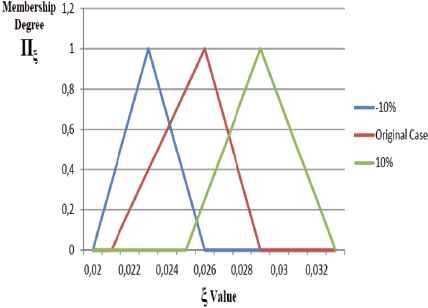
Effect of change in fuzzy unit costs by ± 10% on
The rising costs cause
5. Conclusions
In this research, an optimization problem of BB is analyzed when acquiring and allocating bandwidth from a market in which demands of end-users, prices and QoS levels are not known in advance. The main contribution of the paper is to develop an efficient solution algorithm to overcome computational issues as well as uncertainties in the non-deterministic nature of the telecommunication network environment. In order to handle randomness and vagueness, an integration of stochastic and fuzzy linear programming techniques is proposed.
Extensive computational study on randomly generated test instances showed that proposed methodology provides more than 10% more profit even in worst case scenarios. We analyze the effect of fuzziness in managerial point of view. We show that randomness should be taken into account due to very high competition in telecom market and limited profit margins.
It is concluded that increasing problem size makes suggested approach more compelling than deterministic methodology for BB’s decision makers. Solving RP model rather than EEV model leads to more profit in fuzzy sense. In other words, ignoring uncertainty in the bandwidth demand and treating BB’s problem as deterministic model result in profit loss. Moreover, the RP model is better to be chosen and used by BB under pessimistic market conditions. Finally, carried out sensitivity analysis on fuzzy objective parameters demonstrated the robustness of procedure.
As a further study, it would be worthwhile to expand investigated two-stage model into multi-period (multi-stage) model. In addition, an interesting future study would be to study fuzzy multi-objective optimization problem of BP rather than BB in which fuzzy expected profit maximization as well as fuzzy expected capacity loss minimization objectives are optimized simultaneously. Even though most of the time it is sufficient to model imprecise parameters by triangular fuzzy number, improving proposed methodology that is capable of handling general fuzzy number would make solution methodology more applicable, which would be a theoretical contribution.
Acknowledgements
Preliminary findings of this article was presented in ISCSE 2013 Proceedings book with title the “A Fuzzy Capacity Acquisition and Allocation Model for Bandwidth Brokers under Uncertainty52”.
Footnotes
Retrieved from http://eng.btk.gov.tr/kutuphane_ve_veribankasi/pazar_verileri/2013_Q1_ECM_MarketData.pdf on 14/02/2014.
Retrieved from http://webrazzi.com/2014/03/24/ulkemizdeki-internet-servis-saglayicilarin-pazar-paylari\\-webrazzi-pro/ on 24/10/2014.
References
Cite this article
TY  - JOUR
AU  - Hasan Hüseyin Turan
AU  - Nihat Kasap
AU  - Dursun Delen
AU  - Mehmet Nahit Serarslan
PY  - 2016
DA  - 2016/04/01
TI  - Stochastic Capacity Acquisition and Allocation Model for Bandwidth Brokers under Fuzzy Volume Based Pricing Scheme
JO  - International Journal of Computational Intelligence Systems
SP  - 227
EP  - 244
VL  - 9
IS  - 2
SN  - 1875-6883
UR  - https://doi.org/10.1080/18756891.2016.1149998
DO  - 10.1080/18756891.2016.1149998
ID  - Turan2016
ER  -