Integrating Pattern Features to Sequence Model for Traffic Index Prediction
 , Zhijie Xu1, Jianqin Zhang2, Jingjing Wang3, Lizeng Mao3
- DOI
- 10.2991/ijcis.d.210510.001How to use a DOI?
- Keywords
- Deep learning; Traffic index prediction; Pattern features learning; Sequence-to-sequence network
- Abstract
Intelligent traffic system (ITS) is one of the effective ways to solve the problem of traffic congestion. As an important part of ITS, traffic index prediction is the key of traffic guidance and traffic control. In this paper, we propose a method integrating pattern feature to sequence model for traffic index prediction. First, the pattern feature of traffic indices is extracted using convolutional neural network (CNN). Then, the extracted pattern feature, as auxiliary information, is added to the sequence-to-sequence (Seq2Seq) network to assist traffic index prediction. Furthermore, noticing that the prediction curve is less smooth than the ground truth curve, we also add a linear regression (LR) module to the architecture to make the prediction curve smoother. The experiments comparing with long short-term memory (LSTM) and Seq2Seq network demonstrated advantages and effectiveness of our methods.
- Copyright
- © 2021 The Authors. Published by Atlantis Press B.V.
- Open Access
- This is an open access article distributed under the CC BY-NC 4.0 license (http://creativecommons.org/licenses/by-nc/4.0/).
1. INTRODUCTION
Traffic index is a conceptual measure of traffic congestion, with a value between 0 and 10. The higher the value, the more severe the traffic congestion is. As an advanced integrated traffic management system, intelligent transportation system can provide diversified services for traffic participants, which is the development direction of future transportation system. As a part of intelligent transportation system, traffic index prediction plays a positive role in promoting the development of intelligent transportation system.
The current approaches for traffic index prediction can be roughly divided into two types. The first type is the prediction methods based on specific mathematical model. Over the years, traffic prediction using different mathematical models have been proposed and improved, e.g., using ARIMA model and Kalman filter [1], or using Wavelet analysis and Hidden Markov model [2,3]. Guo et al. proposed to predict the traffic index by pattern sequence matching, and they used a time attenuation factor based on inverse distance weight to improve the accuracy [4]. Taking advantage of strong theoretical foundation, this type of method can be explained well and is easy to understand. However, methods based on specific mathematical model are not designed to adapt to various data. They cannot update their model according to the data. When actual data disagree with the model assumption, their performances are limited.
The second type is prediction methods based on deep learning [5–18]. Currently, many different deep network architectures are developed and used for traffic prediction. Fang et al. proposed global spatial-temporal network (GSTNet) for traffic flow prediction [5]. Zhang et al. use residual networks to predict citywide crowd flows [6]. In 2018, Li use long short-term memory (LSTM) to predict the short-term passenger flow of subway stations [7]. In 2018, Liu select gated recurrent unit (GRU) neural network to predict urban traffic flow [8]. Benefit from the availability of large datasets and the power of deep nets, the prediction performance has improved significantly.
While more attention has been devoted to designing deep architectures, analysis of the data is much less. Here we analyze the traffic index data. Specifically, the changing curve of daily average traffic index from Monday to Sunday and holiday in September and October 2018 is shown in Figure 1. From Figure 1, we can see that the change trend of the traffic index on different days appears significant differences. There is a big difference between the curve of working days, weekend, and holidays. But the curve from Monday to Friday is much more similar. Moreover, according to the Euclidean distance between the daily average traffic index, the multidimensional scaling (MDS) of the traffic index is carried out, and the results are shown in Figure 2. From Figure 2, similar conclusions can be drawn, i.e. there are several different latent patterns embedding in traffic index data. Monday to Friday account for one pattern, while Saturday, Sunday and holidays account for different patterns.

Graph of traffic index from Monday to Sunday and holiday.
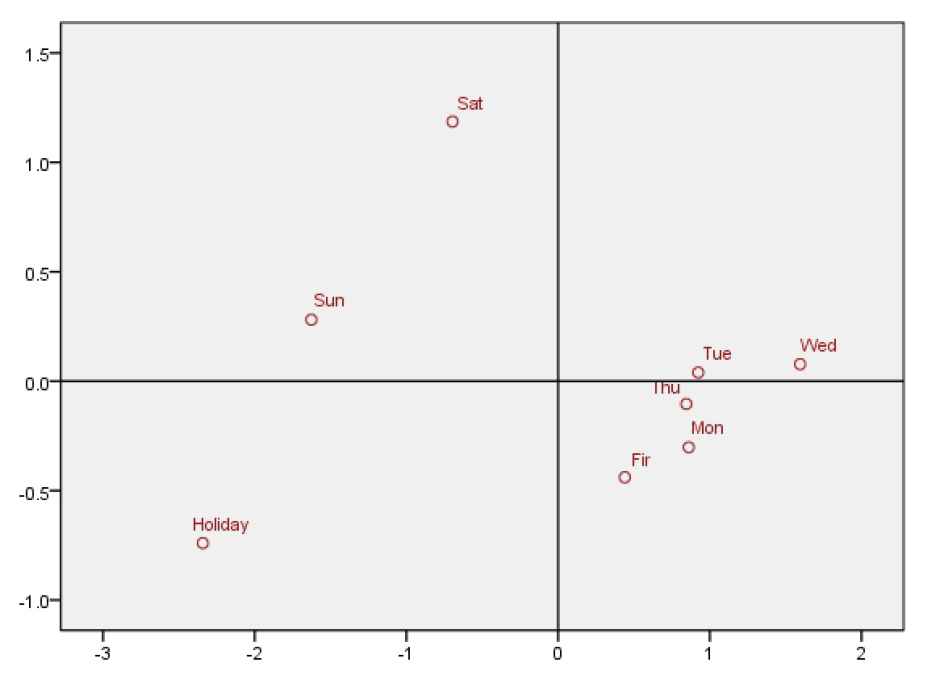
(Euclidean distance between the daily average traffic indices) MDS-map.
Based on above analysis and inspired by the success of deep learning methods, we propose a method integrating pattern features to sequence model for traffic index prediction. We design a CNN-based pattern feature extraction module (PEM) to extract pattern features. Then, the extracted pattern feature is added to the sequence-to-sequence (Seq2Seq) network as auxiliary information to assist traffic index prediction. Furthermore, noticing that the prediction curve is less smooth than the ground truth curve, we also use linear regression (LR) module to fine tune the model structure.
To summarize, the main contributions of this paper are as follows: (i) We use pattern feature as auxiliary information to help deep learning models capture the temporal dependencies between the traffic indices. (ii) We integrate Seq2Seq network and CNN network, making full use of the advantages of both. (iii) We add LR module to fine tune the prediction results.
2. PROPOSED METHOD
In this section, we first briefly review the LSTM network and the Seq2Seq network, then we present our method in detail.
2.1. Review of LSTM Network and Seq2Seq Network
LSTM has been successfully applied to time series prediction problems, such as text translation, robot dialogue, traffic prediction, etc. [19–21]. The specific structure is shown in Figure 3, and the calculation formula is as follows:

LSTM network structure diagram.
Seq2Seq network [22,23] was proposed in 2014 and has been applied to fields of machine translation, text generation, etc. [24–28]. The Seq2Seq network is composed of an encoder and a decoder. The specific structure of the network is shown in Figure 4, which takes LSTM as the basic unit, and the calculation formula is as follows:

Seq2Seq network structure.
2.2. Prediction Model with Pattern Feature
In our work, we design a PEM to extract the pattern features of traffic indices. Its structure is shown in Figure 5.
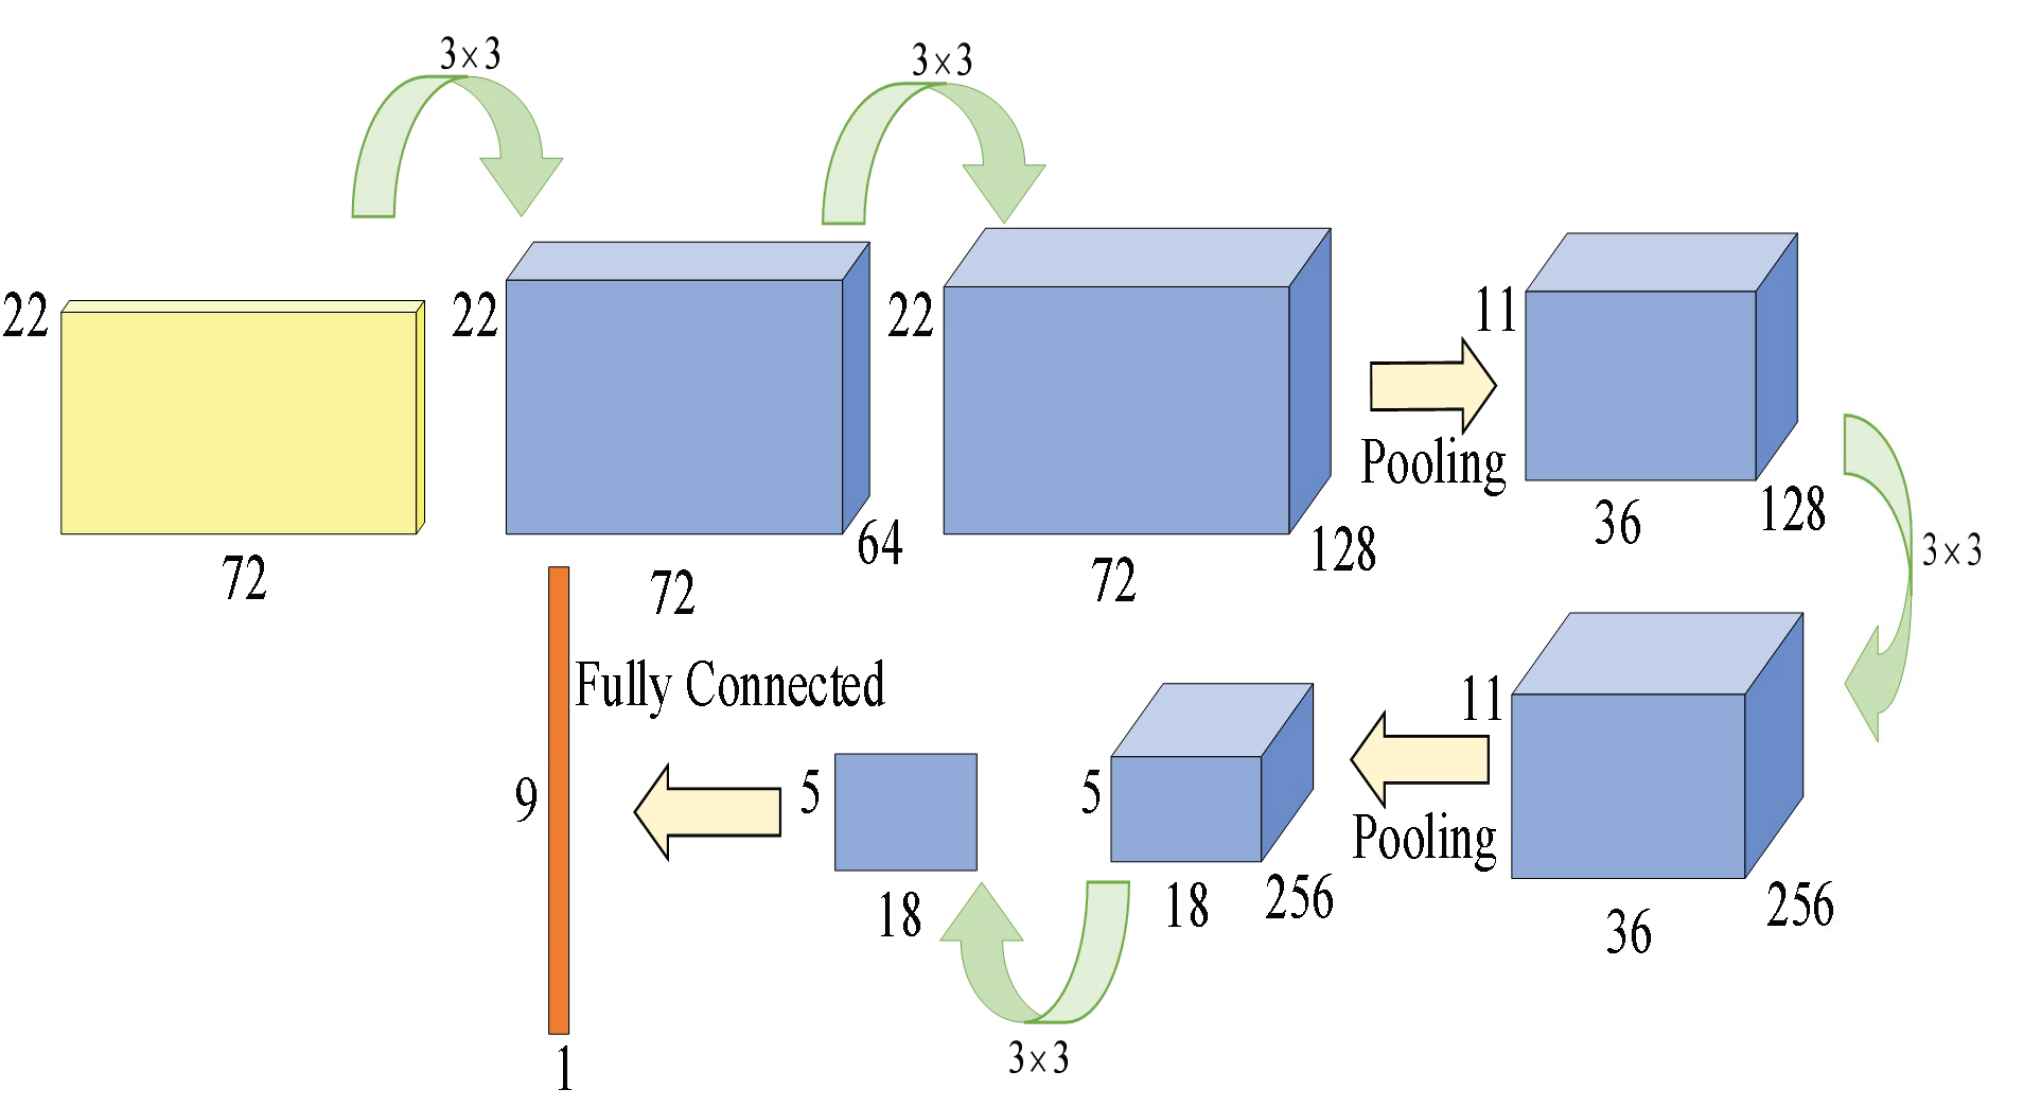
Pattern feature extraction module (PEM).
Firstly, we use K-means algorithm to cluster the traffic indices of 91 days in September, October, and November 2018 into four clusters, which correspond to the patterns of Midweek, Saturday, Sunday, and Holiday respectively. Then CNN network is used to extract the features of four patterns. Specifically, we randomly selected traffic indices of 22 days in each mode as input, and in order to extract the global and local features, we use small filters many times and multiple channels. Finally, the PEM module outputs a 9-dimensional feature vector, which represents the feature of the traffic indices of pattern
We integrate pattern feature to sequence model for traffic index prediction. An overview of our method is shown in Figure 6. In this framework, pattern feature of traffic indices is extracted by PEM, then it is input to the decoding layer as auxiliary information to assist Seq2Seq model to predict traffic index. The calculation process is formulated as follows:
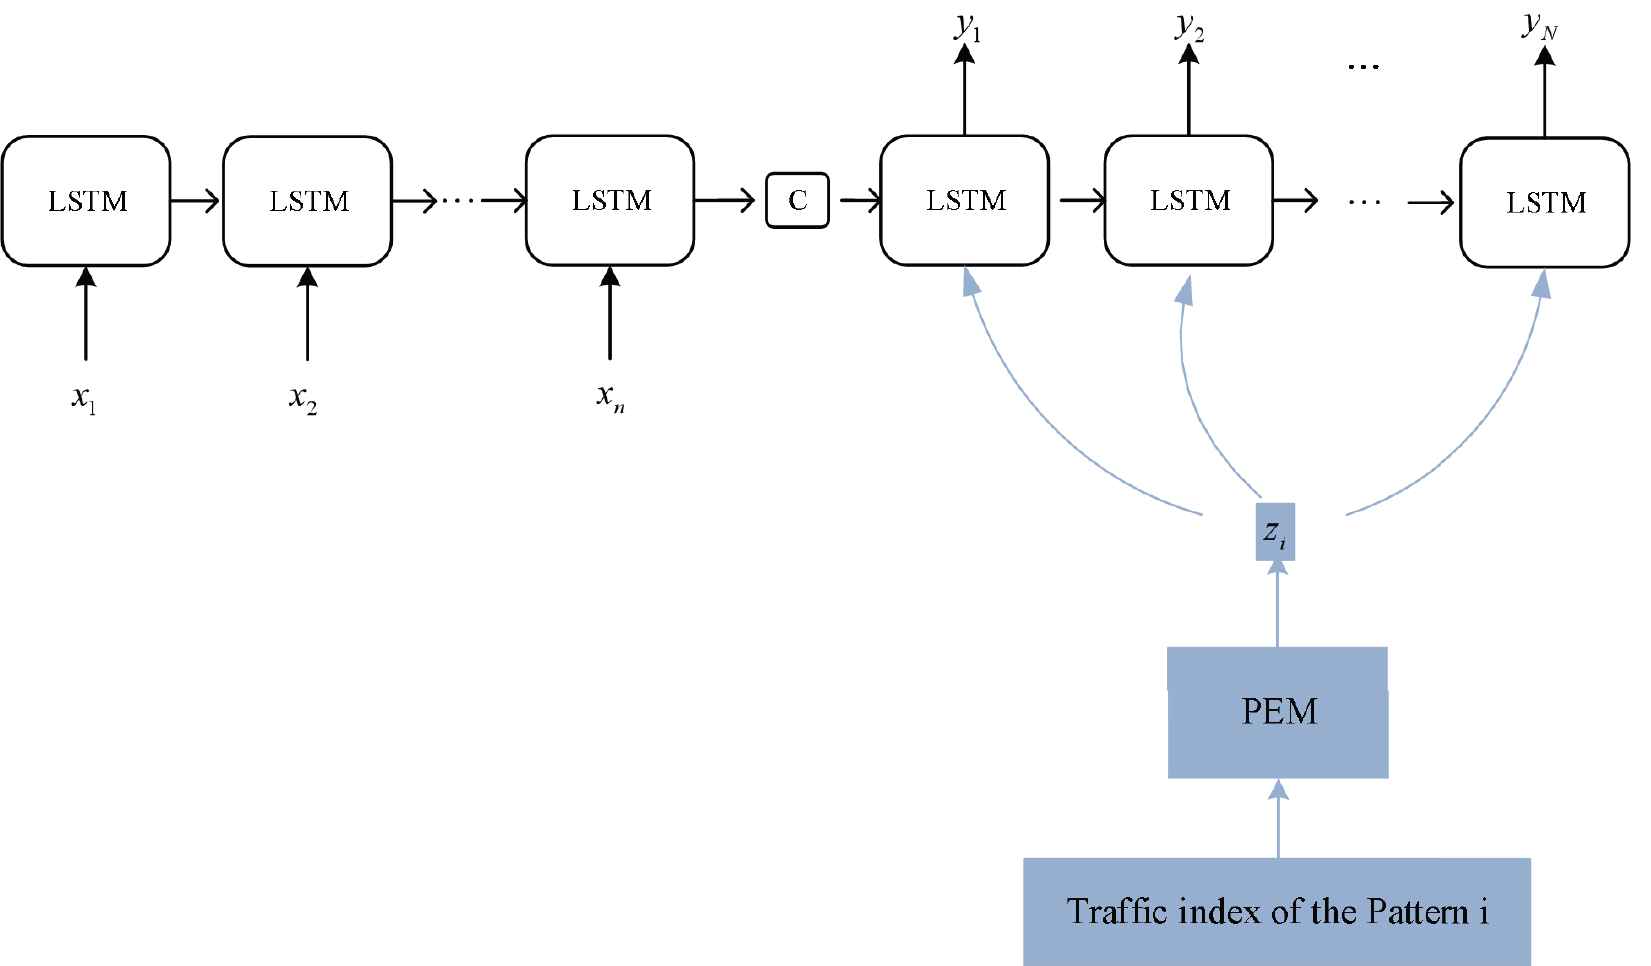
An overview of PMPF.
2.3. LR Module for Fine Tuning
In order to improve the prediction performance of our method, we add a LR module to the architecture. The overall framework is illustrated in Figure 7.
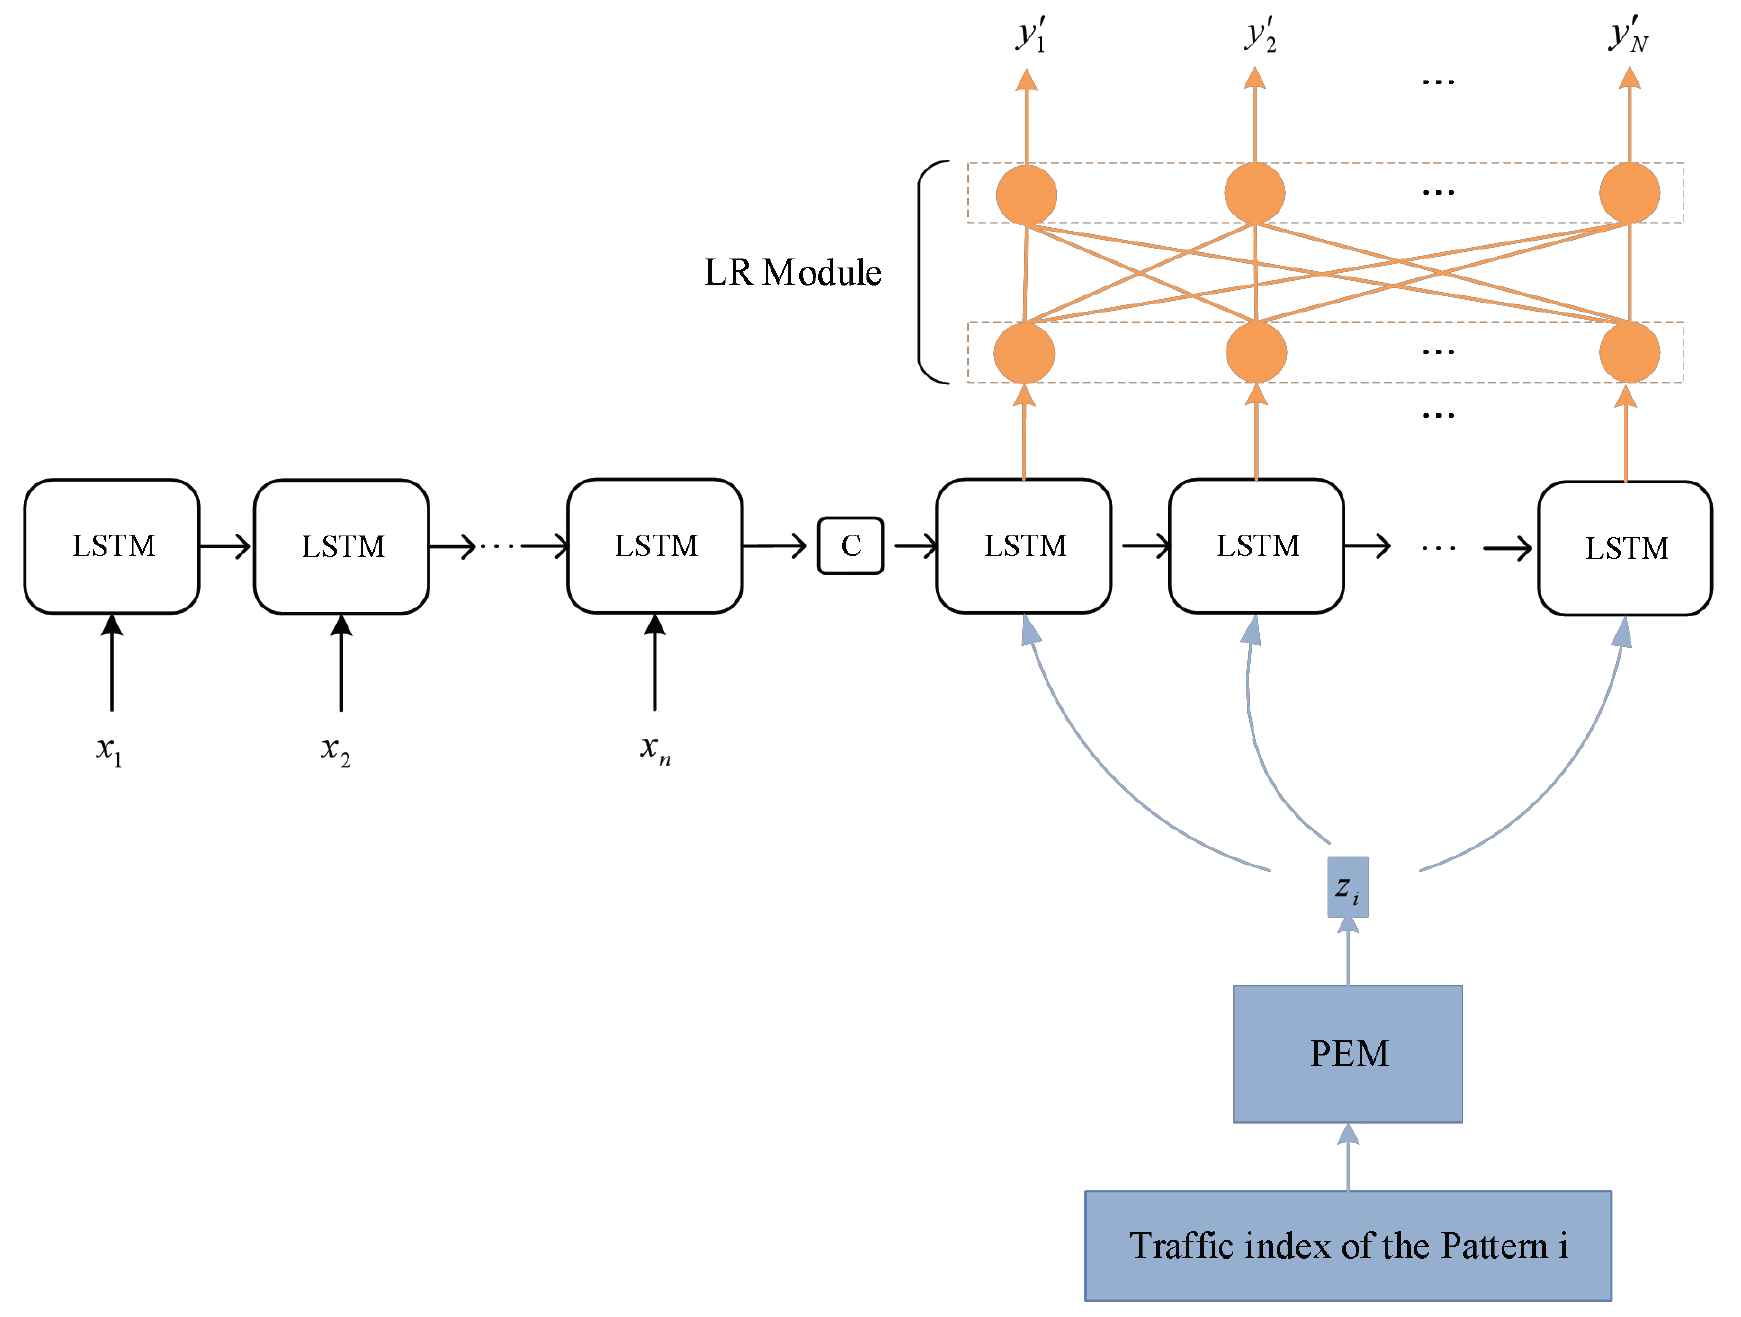
An illustration of our PMPF+LR framework.
In the framework, the output of Seq2Seq model with pattern feature are input to LR module to obtain the prediction value. The LR module is composed of a fully connected network with identity activation function. This architecture adds linear components to the prediction value of nonlinear model to tune the prediction results. It combines the advantages of nonlinear model and linear model. The specific calculation formula are as follows:
We use the mean squared error as the loss function, which is formulated as follows:
3. EXPERIMENTS
3.1. Implementation Details
The data set in this paper is composed of 15-minute granularity data in the period of 03:00–21:00 every day in September, October, and November of 2016, 2017, and 2018. The first 80% of the above data is used as the training set, and the last 20% as the test set.
There are 180 days for the midweek pattern, 36 days for the Saturday pattern and Sunday pattern, and 22 days for the holiday pattern. To sum up, 22 days from each of the above four patterns are randomly selected as the input data set of PEM module.
Mean absolute error (MAE) and mean absolute percentage error (MAPE) are selected as performance measures.
3.2. Implementation Results
In this section, we choose LSTM network and Seq2Seq network for comparison. The experimental results are shown in Table 1 and Figure 8. According to Table 1 and Figure 8, MAE and MAPE of the above four models decreased with the shortening of the prediction period. The MAE and MAPE of LSTM model are the largest, and the errors vary greatly with the shortening of the prediction period, indicating that the model has limited memory of traffic indices. MAE and MAPE of Seq2Seq model are in the middle of LSTM model and proposed prediction model with pattern feature (PMPF), and as the prediction period is shortened, the prediction error does not show a big difference, indicating that compared with LSTM, Seq2Seq model can remember the traffic indices for a longer time. PMPF model performed best in MAE and MAPE compared with the LSTM model and Seq2Seq model. The difference between PMPF model and Seq2Seq model is the former incorporates pattern features. The results show that the pattern features can improve the accuracy of the model without increasing the training difficulty.
| Models | 9_hours |
6_hours |
1_hours |
0.5_hours |
||||
|---|---|---|---|---|---|---|---|---|
| MAE | MAPE (%) | MAE | MAPE (%) | MAE | MAPE (%) | MAE | MAPE (%) | |
| LSTM | 1.01 | 63.16 | 0.93 | 56.08 | 0.50 | 27.43 | 0.36 | 14.29 |
| Seq2Seq | 0.60 | 25.14 | 0.55 | 23.69 | 0.45 | 15.98 | 0.36 | 12.52 |
| PMPF Model | 0.52 | 17.57 | 0.49 | 16.22 | 0.35 | 12.07 | 0.25 | 9.57 |
| PMPF+LR | 0.50 | 15.82 | 0.49 | 15.66 | 0.31 | 10.93 | 0.23 | 8.95 |
MAE and MAPE at different prediction periods.

MAE and MAPE at different prediction periods.
Compared with PMPF model, MAE and MAPE of PMPF+LR model are smaller, which indicates that LR model can further improve the accuracy.
Taking the 6_hours_prediction as an example, Figure 9 shows the comparison between the predicted value and true value in different patterns by PMPF model. Figure 10 shows the comparison between predicted value and true value of the PMPF model and PMPF+LR model in different patterns.

Comparison of PMPF predicted value with true value: (a) holiday pattern; (b) midweek pattern; (c) saturday pattern; (d) sunday pattern.
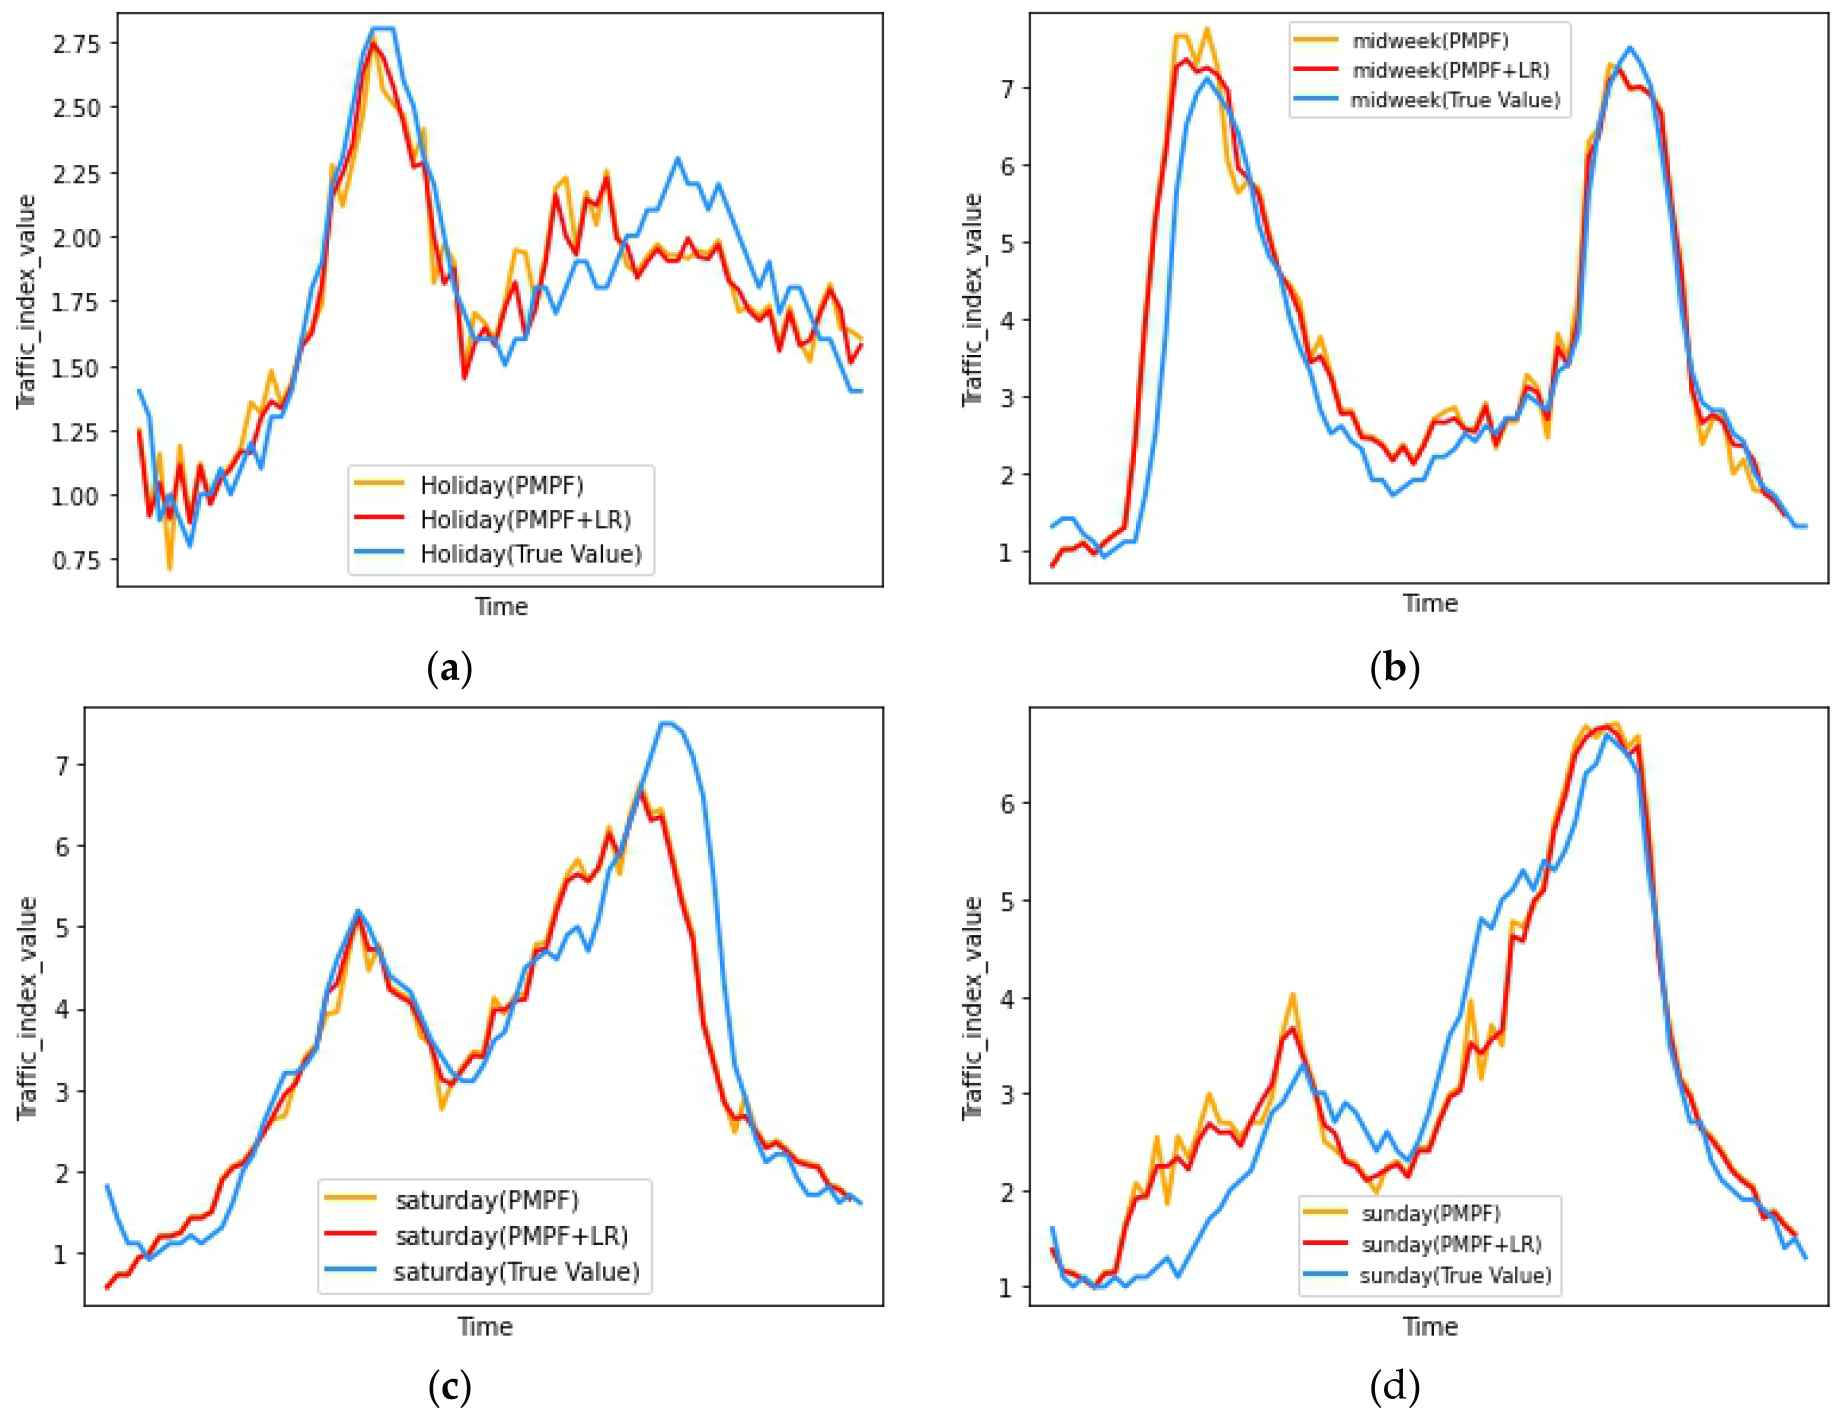
Comparison between the predicted value of PMPF model, PMPF+LR model, and true value: (a) holiday pattern; (b) midweek pattern; (c) saturday pattern; (d) sunday pattern.
Although the prediction accuracy of PMPF model is higher than that of LSTM and Seq2Seq, according to Figure 9, compared with the true value curve (blue), the predicted value curve of PMPF model (orange) is not smooth enough. If the predicted value curve of the PMPF model becomes smoother, the prediction accuracy will be further improved. Therefore, this paper combines LR with the PMPF model and adds a linear component to the predicted value of the nonlinear model to make the predicted value curve smoother.
According to Figure 10, the trend of PMPF+LR forecast curve (red) and PMPF forecast curve (orange) are very close, but there are still some slight differences between the two. The red line is smoother than the orange line. For example, in the (d) chart, before the second peak, the orange line has many sharp bumps (branch points), while the red curve has undulations but is more smoother (everywhere-differentiable) than the orange, and most of the points on the red curve are closer to the true value curve (blue), Table 1 also verifies this conclusion.
4. CONCLUSIONS
We studied the traffic index prediction problem. We combine the Seq2Seq network and CNN network [31,32], and propose to add the pattern features as an auxiliary information to the prediction model. Compared with LSTM network and Seq2Seq network, the prediction accuracy of our PMPF model is higher. The prediction accuracy increases with the shortening of the prediction time. To sum up, it can be seen that the pattern features play a positive role in promoting the traffic index prediction without increasing the training difficulty.
The comparison between PMPF+LR model and PMPF model shows that the prediction curve of PMPF+LR model is smoother. The results show that, to a certain extent, the linear model can assist the nonlinear model to fine-tune the prediction results, so as to improve the accuracy.
PMPF model and PMPF+LR model basically meets the application requirements and can be used as a part of intelligent traffic system. However, due to the limitation of data, the accuracy of our model still needs to be improved. Besides, other patterns existing in daily life are not considered in this paper, which is also the difficulty in the application of our model. In the subsequent studies, we will continue to improve the model.
ACKNOWLEDGMENTS
This research was funded by National Natural Science Foundation of China (grant No. 41771413, grant No. 41701473), Beijing Municipal Natural Science Foundation (grant No.8202013).
REFERENCES
Cite this article
TY  - JOUR
AU  - Yueying Zhang
AU  - Zhijie Xu
AU  - Jianqin Zhang
AU  - Jingjing Wang
AU  - Lizeng Mao
PY  - 2021
DA  - 2021/05/14
TI  - Integrating Pattern Features to Sequence Model for Traffic Index Prediction
JO  - International Journal of Computational Intelligence Systems
SP  - 1589
EP  - 1596
VL  - 14
IS  - 1
SN  - 1875-6883
UR  - https://doi.org/10.2991/ijcis.d.210510.001
DO  - 10.2991/ijcis.d.210510.001
ID  - Zhang2021
ER  -
