
Analyzing Online Shopping Behaviors via a new Data-Driven Hesitant Fuzzy Approach
 , Sezi Cevik Onar2,
 - DOI
- 10.2991/ijcis.d.210205.003How to use a DOI?
- Keywords
- Online shopping; Customer behavior; Generation cohort; Hesitant fuzzy cognitive mapping; Partial least squares structural equation modeling
- Abstract
Understanding online shopping behaviors is crucial for the survival of many firms. Modeling the customers' online shopping behaviors is a complex problem that involves uncertainty, hesitancy, and imprecision since different generations have different attitudes toward e-commerce. In this study, a new data-driven, hesitant fuzzy cognitive map methodology evaluates the different generations', namely, generations X, Y, and Z, online shopping behaviors. The model is constructed based on the technology acceptance model, diffusion of innovation theory, and extended unified theory of acceptance and technology use. The relations and the level of relations among the parameters are defined by using a data-driven approach. Utilizing a statistical approach enables us to define the relations among the parameters and customer behaviors better. The study's objective is to reveal the impact of different conditions on the customers' online shopping behaviors and help the decision-makers with their online shopping strategies. The statistical model has limitations since it does not reflect the hesitancy and imprecision inherent in customers' online shopping behaviors. We utilize hesitant fuzzy cognitive maps to reflect uncertainty and hesitancy and analyze different scenarios with this map. Different cognitive maps and three scenarios are developed for every generation type, and the customer behaviors are observed through these hesitant fuzzy cognitive maps.
- Copyright
- © 2021 The Authors. Published by Atlantis Press B.V.
- Open Access
- This is an open access article distributed under the CC BY-NC 4.0 license (http://creativecommons.org/licenses/by-nc/4.0/).
1. INTRODUCTION
Shopping via the Internet or online shopping has made a crucial impact on our lives. Under emerging conditions such as Covid-19 pandemics, the importance of electronic commerce has become even more critical. Online shopping has been growing day by day. Shoppers want to go through more alternatives and reduce their shopping time. According to the World Bank, OECD countries had approximately 30 billion U.S dollars B2C electronic commerce trading volume in 2000. According to the Informatics Industry Association of Tukey, electronic commerce trading volume on the earth approximately 3.5 trillion U.S dollars, while only Turkey had 31.5 billion U.S dollars for B2C electronic commerce and 28.4 billion U.S dollars for non-B2C electronic commerce trading volume in 2018. China, the United States, and Japan take the lead on electronic commerce trade volume worldwide. When viewed from this aspect, online shoppers' behavior is vital for electronic commerce companies. In this study, we try to evaluate consumer intentions to continue online shopping.
Various factors have an impact on individuals' motivations for online shopping. In the literature, several theories try to understand online shopping adoption or online any process adoption. For instance, Kuswanto et al. focus on the enjoyment, perceived risk, and social influence over online shopping [1] while Liu et al. focus on hedonic satisfaction [2]. Ladhari et al. try to understand and categorize women's online fashion shopping behavior who belong to Gen Y [3] while Chang and Wang try to segment Generation Y and Generation Y based on their risk attitude over electronic commerce [4]. However, many theories try to reveal the customers' online shopping behaviors, a comprehensive study that combines the perspectives of different theories is missing in the existing literature.
Moreover, one of the significant limitations of the existing studies is that they neglect that different generations may have different attitudes toward online shopping. For instance, the difference between the online shopping behaviors of people who can be considered Generations X and the people who can be considered Generation Z are not comprehensively revealed by the existing studies. We carefully examine the literature to construct our research model and assess the relationships between the models used in the literature. We set the proposed model forth inspired by three primary models, which are diffusion of innovation (DOI) theory [5], technology acceptance model (TAM) [6], and unified technology of acceptance and use of technology (UTAUT2) [7]. An integrated model is developed by using the innovativeness (IN) and relative advantage (RA) factors from the DOI theory; perceived usefulness (PU), perceived ease of use, attitude toward use (ATU) factors from the TAM, and finally, habit (HBT), hedonic motivation (HM), and social influence (SI) from UTAUT2. Moreover, we use the behavioral intention (BI) factor as individual motivation to continue shopping online. Finally, we investigate the difference and similarity of BI between Generation X, Generation Y, and Generation Z.
Consumer online shopping behavior prediction is a multi-dimensional problem that involves many uncertain parameters that have complicated relations. We establish an integrated model based on the literature, and we test the model with a hybrid approach. We blend the partial least squares structural equation modeling (PLS-SEM) and hesitant fuzzy cognitive mapping (HFCM) methods to measure online shoppers' behaviors and predict generations' impact on this behavior. To run the proposed model, we have done a survey that includes 822 online shopping customers and separately run the model for each generation. Hesitant fuzzy sets are excellent tools that enable us to deal with hesitancy [8–10]. Hesitant linguistic evaluations are considered valuable tools for representing human-like evaluations and are used in many different areas [11,12]. We utilize hesitant fuzzy cognitive maps to understand and predict different generations' online shopping behaviors under different scenarios.
The relations among the parameters are obtained from the data-driven statistical model. In this way, we try to annihilate uncertainties on the explanation of consumer online shopping behaviors. However, the online shopping behaviors of customers involve imprecision and uncertainty. Nevertheless, the statistical model was not able to represent the hesitancy of the decision-makers. To shrink uncertainties on interpretation of customer online shopping behaviors, we integrate the result part of the statistical model as an input to the HFCM method. To define the relations among the factors and the human behaviors are engaged in the system, we conduct a survey and utilized statistical methods for calculating the magnitude of the relations.
Moreover, the survey results include hesitancies. To better represent the model's hesitancy and uncertainty, we model online shopping behaviors with fuzzy cognitive maps. We utilize analyzed different scenarios with this new model.
The rest of the paper is organized as follows: In Section 2, the conceptual framework of the online shopping adaption of customers is developed. The impact of generations on customer behaviors is highlighted in this section. The proposed hybrid methodology is given in Section 3. A real-case analysis of the generations' online shopping behavior is given in Section 4. In Section 5, different scenarios are analyzed based on generation types. Section 6 concludes and gives further suggestions.
2. ONLINE SHOPPING ADOPTION OF GENERATIONS CONCEPTUAL FRAMEWORK
In the literature, many studies focus on understanding customers' online shopping behaviors. Yet, a comprehensive study that utilizes different perspectives is missing in the literature. The DOI theory, TAM, the UTAUT2, and the general definition of generation types are the theories that can help understand customer behaviors. Each one of these theories creates a different perspective on understanding online shopping behaviors. Combining these three theories will be very beneficial to understand different aspects of online shopping behaviors. This study combined these three theories to understand customers' online shopping behaviors better. The DOI theory was inspired by Gabriel Tarde's multi-step flow theory (1902) and was developed by Everett M. Rogers [5]. Rogers explained the propagation of an idea or an innovation in a social system with innovation or an idea itself, communication channels, and time. This theory wants to explain an idea or an innovation on how to spread in society. Many studies use the definitions/factors of DOI theory to explain electronic commerce adoption. IN and RA are some of the most used factors of DOI used to explain electronic commerce adoption in the literature. Adopting a new idea before any other person in a social system [6] or making a decision without affected by others is called IN [14]. Many types of research used IN to explain the adoption of the electronic commerce process. Biegne-Alcaniz et al., Crespo and Rodriguez, Zarmpou et al., Lee, Thakur and Srivastava, and Oliviera et al. are some of the used IN to explain online shopping adoption or online any process adoption in their researches [14–19]. We adapt the IN to our research as the capability to use online shopping, and we investigate relationships between IN and BI and PEoU. RA is defined as “the degree to which an innovation is perceived as being better than the idea it supersedes” [13]. We customize the RA to our research to perceive online shopping against the classical shopping method. We investigate the relationships between RA and BI and PU.
Fred D. Davis developed the TAM in 1989. Davis used the model to examine information system adoption. After the theory was developed, it has been used by many researchers in many areas. TAM analyzes the distinct attitudes of individuals against specific situations. TAM evolve out of the Theory of Reasoned and Action by Fishbein and Ajzen [20].
We adapt all TAM factors to our research, which are PEoU, PU, and ATU. There are many types of research in many areas that used TAM to explain the adoption process. Electronic commerce studies use TAM factors frequently. Many studies, including Vijayasarathy, Crespo et al., Faqih, Chi, Lestari, and Park et al., used TAM factors in their research in the electronic commerce area [21–26]. We also use the TAM factors to build the proposed model on a factual basis and test it among Turkish online shoppers. Thus, we try to localize the canonical relationships among TAM factors in the electronic commerce area. PEoU is defined as “the degree to which a person believes that a particular system would be free of effort” [6]. We adapt the PEoU to our research as online shoppers' perception toward ease of handling or user-friendly online shopping. We examine the relationships between PEoU and BI, IN, PU, and ATU. PU is defined as “the degree to which a person believes that using a particular system would enhance his or her job performance” [6]. From an online shopping perspective, PU is any gain of an individual when shopping online [25]. We adapt the PU to our research as a benefit from a shoppers' perspective. We investigate the relationships between PU and RA, PEoU, ATU, and SI. ATU is the degree to which shoppers like online shopping ideas [21]. We examine the ATU relationships used in the literature, whether statistically significant or nonsignificant, and we investigate relationships between ATU and BI, PU, PEoU, HM, and SI.
The extended UTAUT2 [7] model is derived from the UTAUT [27], which can be considered as the successor of the TAM. UTAUT has factors that bear a resemblance to factors of TAM. UTAUT2 is an extended version of UTAUT. Venkatesh et al. add HM, price value, and HBT factors to UTAUT and establish the UTAUT2 model [7]. We adapt SI from UTAUT and HM and HBT from the UTAUT2 model to our research. HBT is an act that a person performs automatically after many learnings [7]. We adapt the HBT to our research as a shopping desire online consistently. This factor in our research also can be thought of as an addiction to online shopping. We investigate the relationships between HBT and BI, ATU, HM. Hedone is a word that comes from the ancient Greek era and means pleasure [28], and HM is to take pleasure in doing something [7]. We adapt the HM to our research as the pleasure taken from online shopping. Lu and Su, Oliviera et al., and Herrero et al. investigated HM and BI's relationship [19,20,29]. We explore the connection between HM and ATU, HBT, and SI. Thereby, we conclude the indirect relationship between HM and BI SI is the social effect on an individual from other people [7]. SI is about the individual's perception of his/her social circle. An individual can reflect that his/her social status might increase or decrease with using innovation or technology [30]. In our study, we used the SI to perceive the positive or negative perception due to online shopping of their social circle.
In this study, we carefully examined existing theories in the literature. Considering all of these relationships used in the literature, we combine these relationships and create new relationships. In this way, we generate a novel model to test consumer online shopping behavior.
According to Karl Mannheim, people are affected by similar historical events in the same region. As a result of this, they resemble each other. Generations can be classified as individuals born with the same era affected by the same historical and social phenomenon. Individuals within the same group have similar acts, opinions, and attitudes [31]. There are five postulated generations up to this time, which are Silent Generation, Baby Boomer, Generation X, Generation Y, and Generation Z. We investigate the difference in online shopping between Generation X, Generation Y, and Generation Z. Generation X (Gen X) are born between 1965 and 1979. They are familiar with media and technology [31]. Unlike the Western world peers, in Turkey, Gen X missed technological improvement [32]. Generation Y (Gen Y) are born between 1980 and 1996. Gen Y is the first generation who are meet with high technological developments.
Similarly, Gen Y peers in the western world have the same opportunity in Turkey [32]. Members of Generation Z (Gen Z) are born in 1996 and after. Gen Z has born in high-level technology and the digital era. Gen Z is very good at using technology and sees technology as their limbs [33].
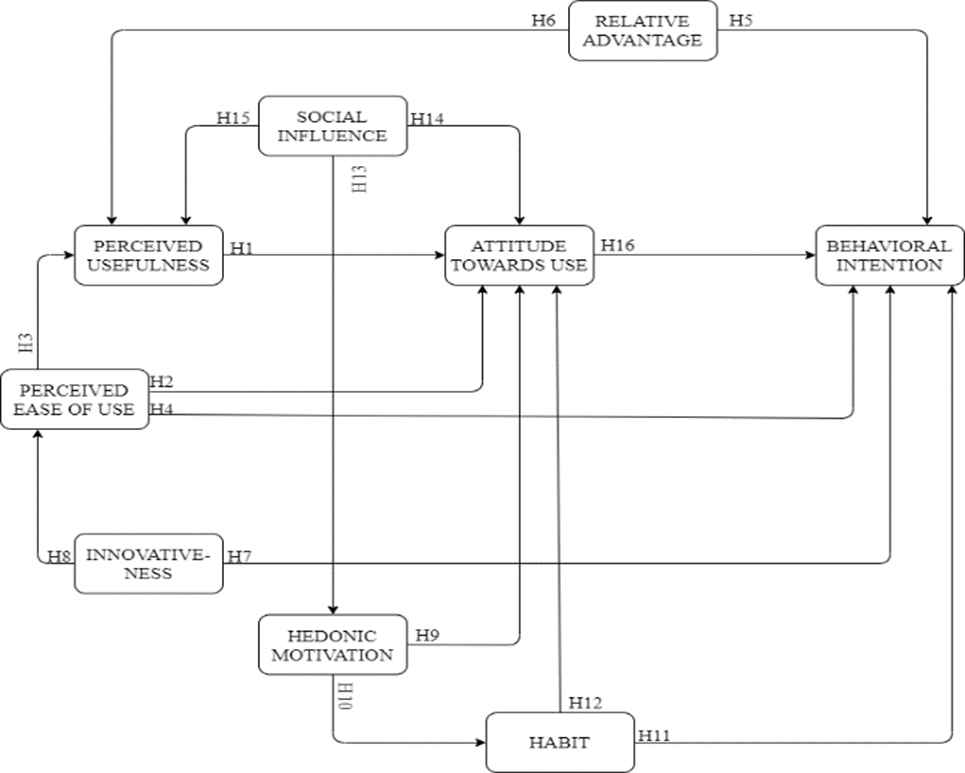
After a careful literature review, we build the model and hypotheses. According to the literature, we integrate the nine factors of three main models to our model: DOI, TAM, and UTAUT2. The model is built in order to test sixteen hypotheses according to consumer behavior. In Figure 1, the proposed model and hypotheses can be seen. All arrows represent a hypothesis, and the pointy head of the arrow represents the hypothesis's impact direction. For instance, as shown in hypothesis 10 (H10), HM positively affects HBT. All hypotheses are built-in a positive direction.
3. METHODOLOGY: A COMBINED DATA-DRIVEN HESITANT FUZZY COGNITIVE MAP DESIGN
This study utilizes structural equation modeling (SEM) and hesitant fuzzy cognitive maps to evaluate customers' online shopping behavior. SEM is a statistical method that is used in sociology, behavioral science, pedagogy, biology, and the medical research field [34] or a statistical method that is used for testing hypotheses [35]. PLS-SEM is variance based multivariate analysis exploratory technique [36] that is consisted of a measurement model (external model) and structural model (internal model) [37]. HFCM is an approach that enables the interpretation of uncertain conditions using interpretations of experts or experts [38]. Hesitant fuzzy sets are the extensions of fuzzy sets that are developed by Torra [39].
We combine the methods as mentioned earlier using outputs of the PLS-SEM as an input of the HFCM. The research model is tested with PLS-SEM, and results of PLS-SEM are used to get HFCM explication. In our proposed hesitant fuzzy cognitive map, we utilized hesitant fuzzy linguistic term sets (HFLTSs). HFLTSs enable us to use linguistic expressions to define the hesitancy in the evaluations. Hesitant fuzzy sets are excellent tools to deal with hesitancies, where more than one value could be possible for defining a relationship [40]. The HFLTSs proposed by Liu and Rodriguez are the tools that enable assigning multiple linguistic evaluations to define the same relations [41].
Let
The obtained
The envelope of an
In order to calculate the numerical value of an
The comparative linguistic expressions based on
| Linguistic Term | Scale |
|---|---|
| negligible | (0,0,0.17) |
| very low | (0,0.17,0.33) |
| low | (0.17,0.33,0.5) |
| medium | (0.33,0.5,0.67) |
| high | (0.5,0.67,0.83) |
| very high | (0.67,0.83,1) |
| absolute | (0.83,1,1) |
These
The coefficients of
3.1. Partial Least Squares Structural Equation Modeling
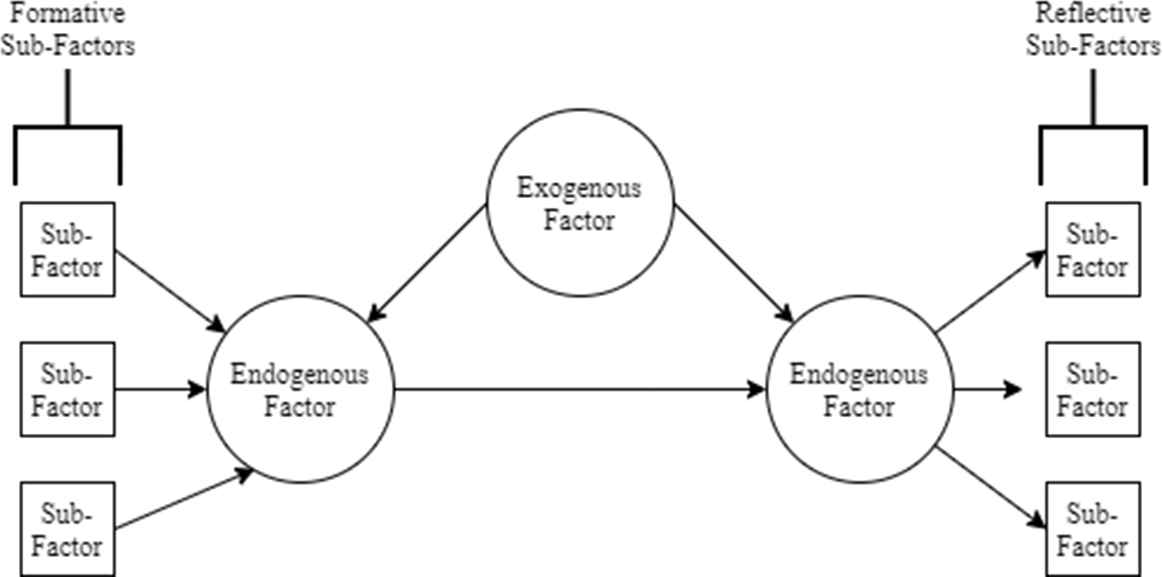
PLS-SEM is the most used type of SEM that has a soft perspective about sample distribution, average sample number, and measurement [46]. PLS-SEM may be used for small sample sizes and complex models without a distributional assumption of the sample [36]. In order to build a model for PLS-SEM, factors are required. There are two types of factors: Endogenous factors and exogenous factors, and every factor has sub-factors. Endogenous factors have at least one relationships that come from the other factors to itself. For instance, PU is an endogenous factor in our research model. Exogenous factors do not have a relationship that comes from other factors to themselves. For instance, SI is an exogenous factor in our research model [43]. Likewise, the factors, there are two types of sub-factors in PLS-SEM: formative and reflective. If there are relationships from factor to sub-factors, these sub-factors are called reflective sub-factors, and vice versa is called formative sub-factors [37]. Every question in the questionnaire represents a sub-factor, and we use the reflective sub-factors in our research model. A general overview of factors and sub-factors can be seen in Figure 2.
Validity and reliability check is done with internal consistency reliability, convergent validity, and discriminant validity. Cronbach's alpha and composite reliability values are used to check internal consistency reliability. Composite reliability is calculated from the factor (outer) loadings, and the calculation is shown in Eq. (8).
Cronbach's alpha is a criterion that takes values between 0 and 1 based on an assumption of the equality of factor loadings for all sub-factors. Nunnaly and Bernstein (1994) explained the steps of calculation of Cronbach's alpha. The calculation of Cronbach's alpha is shown in Eq. (9). k indicates the number of factors,
Convergent validity is checked with the average variance extracted (AVE) and factor loadings. Hair et al. define the AVE as “the sum of the squared loadings divided by the number of indicators.” This definition is given in Eq. (10) where
Table 2 is adapted from Hair et al., and it shows the Fornell–Larcker criterion table. F1, F2, and F3 represent the factors in a model, and “Corr” shows the correlations between factors. All values on the diagonal should be greater than the below values of itself [36].
| F1 | F2 | F3 | |
|---|---|---|---|
| F1 | |||
| F2 | |||
| F3 |
3.2. Data-Driven HFCM
The steps of the novel data-driven hesitant fuzzy cognitive map can be given as follows:
Step 1. Development of the network model: In this step, a conceptual framework is developed by using the existing literature and expert opinions. This conceptual model can be represented as a map; the relations among the parameters can be virtualized by using the conceptual map.
Step 2. Defining the degree of causal relationships among concepts: The degree of causal relationships among concepts is defined based on the data-driven approach. In this level, structure equation modeling, namely partial least squares SEMg given in Section 3.2., is used to define the degree and the magnitude of the casual relationships. Since the data-driven approach involves hesitancy, HFLTSs represent the magnitude of the relationships.
Step 3. Defining the fuzzy envelope of the HFLTSs [9]: OWA operators defined in Eqs. (5–10) are utilized to aggregate hesitant fuzzy linguistic evaluations.
Step 4. Utilizing the hesitant fuzzy cognitive maps: The weight matrix
At every step, the threshold function is utilized to define the next state vector. The hyperbolic tangent function is utilized as a threshold function.
These steps are calculated until reaching the condition in Eq. (16).
4. REAL-CASE ANALYSIS OF THE GENERATIONS' ONLINE SHOPPING BEHAVIOR
In this study, we focus on consumer behavior in online shopping. In order to finalize our analysis, we propose a hybrid approach. In order to complete our analysis, we collect the data with the survey method. The questions of the questionnaire are shown in Appendix, which are adapted from the literature in keeping with our research concept. The questionnaire has 38 total questions. Eight of them are related to the demographic of participants, and 30 are prepared to test the model. In order to test the model, we have generated 30 questions based on the literature. A total of 822 people have attended the survey, and 788 participants are fit the target population. 77 out of 788 participants are determined as outliers, and we take out of them from the sample and have 711 participants who fit our criteria. 86 out of 711 participants are Gen X; 426 out of 711 participants are members of Gen Y, and 199 out of 711 participants are members of Gen Z.
There are two steps in our hybrid approach: PLS-SEM and HFCM. At first, we use PLS-SEM approach to test our proposed model, and secondly, we use the PLS-SEM outputs for HFCM as inputs. We transform the quantitative results of PLS-SEM into linguistic terms for HFCM. We use Smart PLS (v. 3.2.8) for PLS-SEM analysis, and we use general formulas of HFCM to procure the results.
4.1. General Overview of Sample
We have done an online survey for our research; however, we did not put any attendance criteria. After completing the questionnaire, we have picked over our target population, which is Gen X, Gen Y, and Gen Z. After that sorting through the target population, we have subtracted the outliers. Two questions identified outliers. We have asked two dummy questions in the questionnaire: “Please do not answer this question.” We have put aside the participants who have answered this question.
4.2. PLS-SEM Results for Generations
Our analysis has two steps. In the first phase, we examine the generations' online shopping behavior with PLS-SEM method. Table 3 shows the PLS-SEM results for all generations together. 8 out of 16 relationships for Gen X, 12 out of 16 relationships for Gen Y, and 12 out of 16 relationships for Gen Z are statistically significant. Relationships between
| Generation X | Generation Y | Generation Z | ||||||
|---|---|---|---|---|---|---|---|---|
| Hypothesis | f2 | Significance | Hypothesis | f2 | Significance | Hypothesis | f2 | Significance |
| PU → ATU | 0.183 | Significant | PU → ATU | 0.118 | Significant | PU → ATU | 0.154 | Significant |
| PEoU → ATU | 0.001 | Nonsignificant | PEoU → ATU | 0.12 | Significant | PEoU → ATU | 0.087 | Significant |
| PEoU → PU | 0.101 | Significant | PEoU → PU | 0.064 | Significant | PEoU → PU | 0.221 | Significant |
| PEoU → BI | 0.002 | Nonsignificant | PEoU → BI | 0.015 | Significant | PEoU → BI | 0.026 | Significant |
| R.A. → BI | 0.004 | Nonsignificant | RA → BI | 0.002 | Nonsignificant | RA → BI | 0 | Nonsignificant |
| RA → PU | 0.718 | Significant | RA → PU | 0.374 | Significant | RA → PU | 0.352 | Significant |
| IN → BI | 0.002 | Nonsignificant | IN → BI | 0.001 | Nonsignificant | IN → BI | 0.013 | Nonsignificant |
| IN → PEoU | 0.084 | Significant | IN → PEoU | 0.106 | Significant | IN → PEoU | 0.013 | Nonsignificant |
| HM → ATU | 0.087 | Significant | HM → ATU | 0.072 | Significant | HM → ATU | 0.087 | Significant |
| HM → HBT | 0.152 | Significant | HM → HBT | 0.316 | Significant | HM → HBT | 0.21 | Significant |
| HBT → BI | 0.012 | Nonsignificant | HBT → BI | 0.003 | Nonsignificant | HBT → BI | 0.002 | Nonsignificant |
| HBT → ATU | 0.064 | Nonsignificant | HBT → ATU | 0.008 | Nonsignificant | HBT → ATU | 0.038 | Significant |
| SI → HM | 0.173 | Significant | SI → HM | 0.16 | Significant | SI → HM | 0.113 | Significant |
| SI → ATU | 0.041 | Nonsignificant | SI → ATU | 0.083 | Significant | SI → ATU | 0.055 | Significant |
| SI → AF | 0.055 | Nonsignificant | SI → AF | 0.054 | Significant | SI → AF | 0.108 | Significant |
| ATU → BI | 3.374 | Significant | ATU → BI | 1.847 | Significant | ATU → BI | 1.605 | Significant |
5. SCENARIO ANALYSIS
f2 values represent the impact of casual relationships. Definition of f2 values in linguistic terms as these: <0.02 represents there is almost no impact; 0.02–0.015 represents there is weak impact; 0.15–0.35 represents there is average impact and >0.35 represents high impact between relationships. From this point of view, general structures of HFCM is created. The following part consists of the simulation of divergent scenarios under HFCM model. The scenarios have been run under hyperbolic tangent function, and λ value, which represents time-dependent changes, is taken as 0.25.
5.1. PLS-SEM Results for Generations
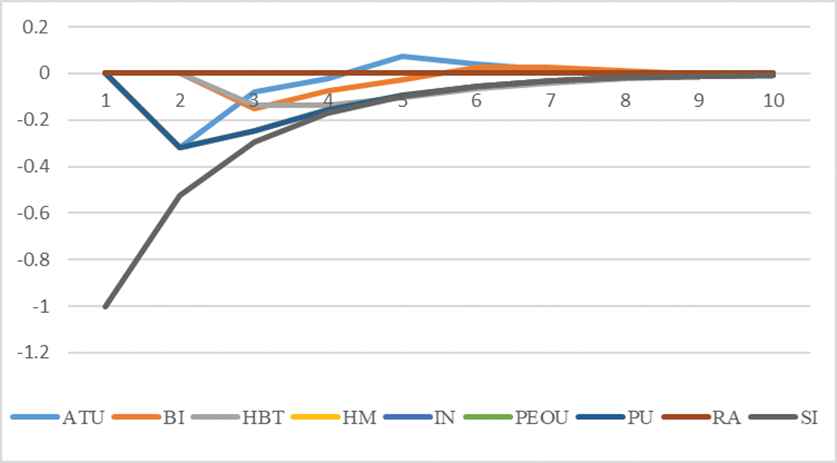
We generate three scenarios for all generations separately. The first scenario analyzes the lack of PEoU condition for Gen X. Figure 3 shows the simulation of lack of PEoU in the system for Gen X. After the 20th iteration, the system has become stable. In the short term, when the absence of PEoU in the system, ATU and BI have decreased, respectively. This simulation implies that a lack of PEoU for online shopping reduces the intention to shop online. Besides that HBT has decreased in the short term for Gen X for this simulation. It can be deducted that the absence of PEoU has impacted the HBT negatively; even their relationships have not existed as regards our proposed model.
The second scenario for Gen X simulates the lack of HM condition. Figure 4 demonstrates the absence of HM in the system. After approximately 20 iterations, the system has become stable. When HM is removed from the system, ATU has decreased dramatically. After ATU, BI has started to decrease. In the short term both factors have decreased. In addition to this SI has decreased in the short term.
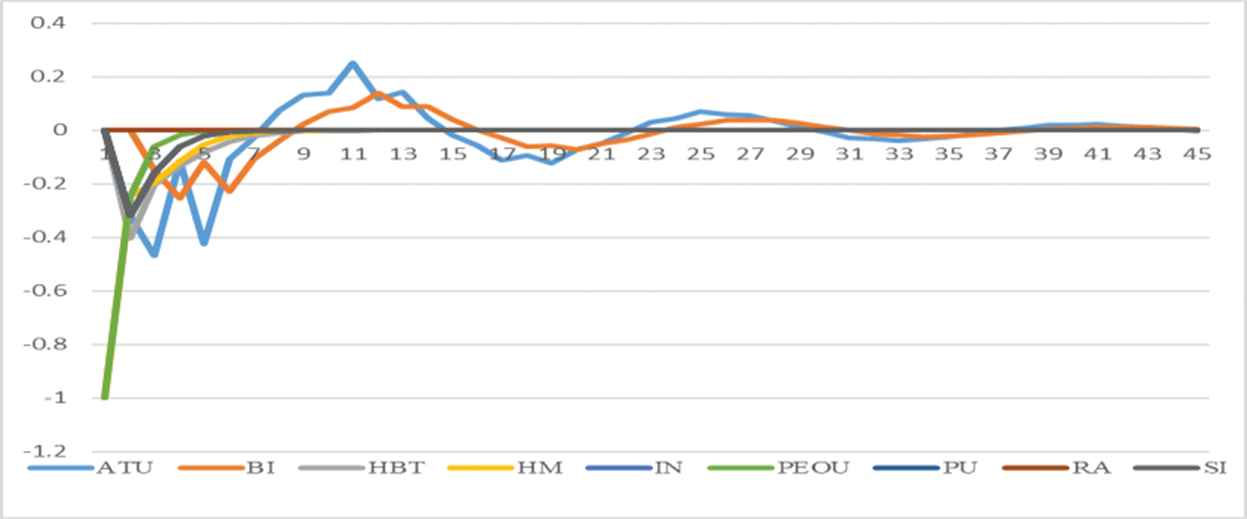
Besides these two scenarios, we generate the scenario that simulates the mutual absence of HM and PEoU. Figure 5 shows the lack of HM and PEoU. When the absence of HM and PEoU, ATU and BI have decreased in the first place, and after, they have wavy shapes on time. After approximately 40 iterations, the system has become stable.
5.2. Scenarios for Gen Y
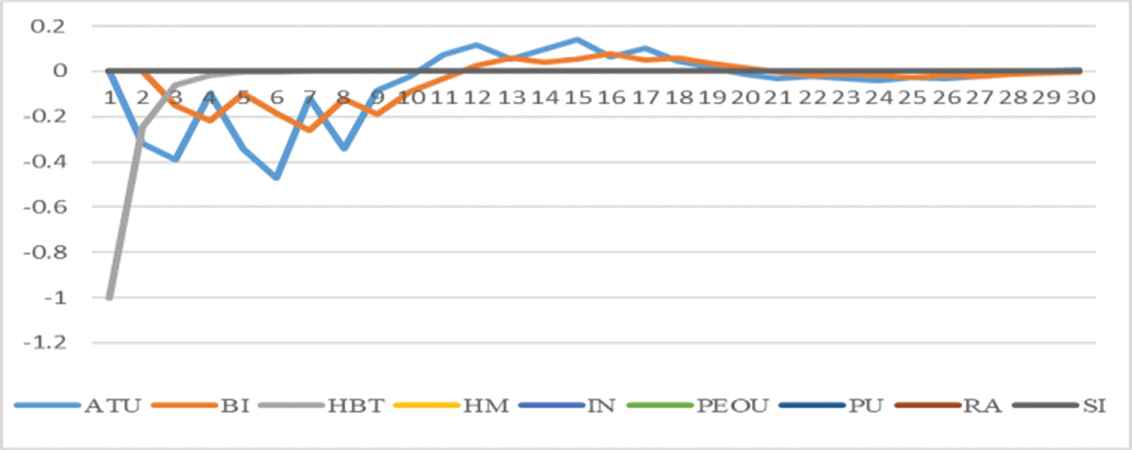
We simulate three scenarios for Gen Y. We tackle the situation in the absence of HM and SI In the first scenario, we examine the consumer online shopping behavior under lack of HM Figure 6 shows the absence of HM for Gen Y. After approximately 23 iterations, the system has become stable. HBT has decreased in the short term and ATU and BI for Gen Y; however, both ATU and BI have increased after decreasing.
The second scenario for Gen Y is the absence of SI. Figure 7 represents the simulation of the lack of SI in the system. ATU and BI have increased in the first place despite the decrease. It can be deduced that SI has almost no impact on customer online shopping behavior for Gen Y.
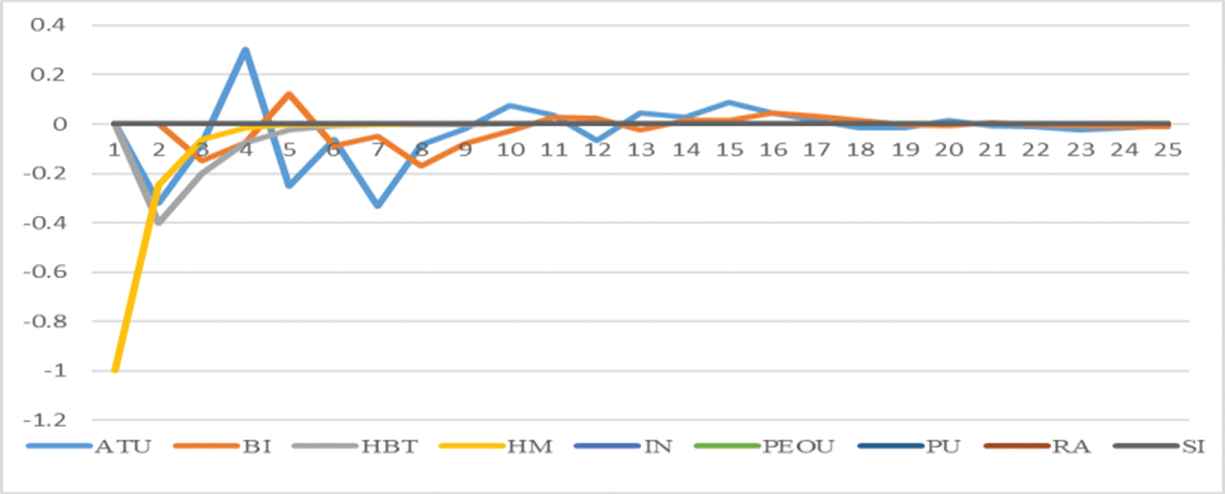
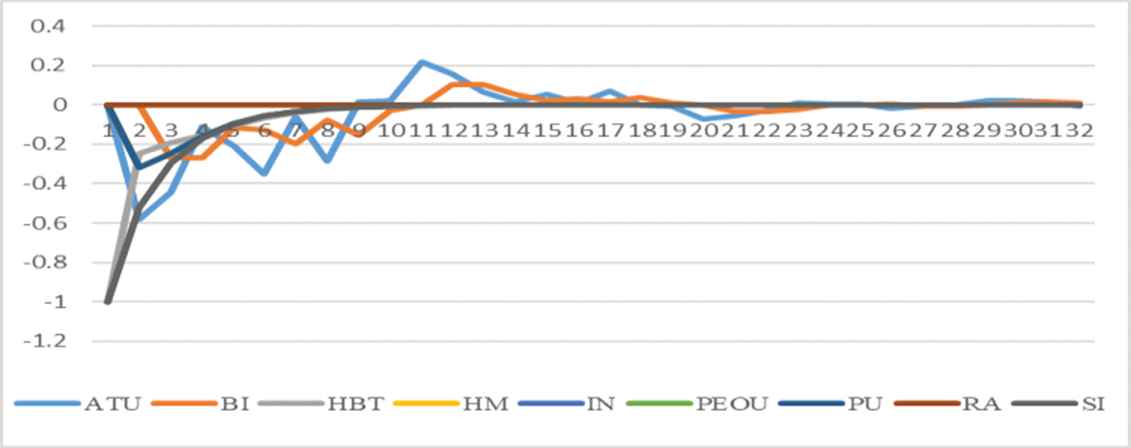
We run the third scenario as the absence of HM and SI for Gen Y. Figure 8 shows the absence of HM and SI in the system. When both factors take from the system, ATU and BI are affected negatively in the short term. Both of them have increased after decreasing in the first place, however, they have decreased after that, and they have increased after that. Gen Y's online shopping behavior has positively and negatively demonstrated a wavy shape under the lack of SI and BI.
5.3. Scenarios for Gen Z
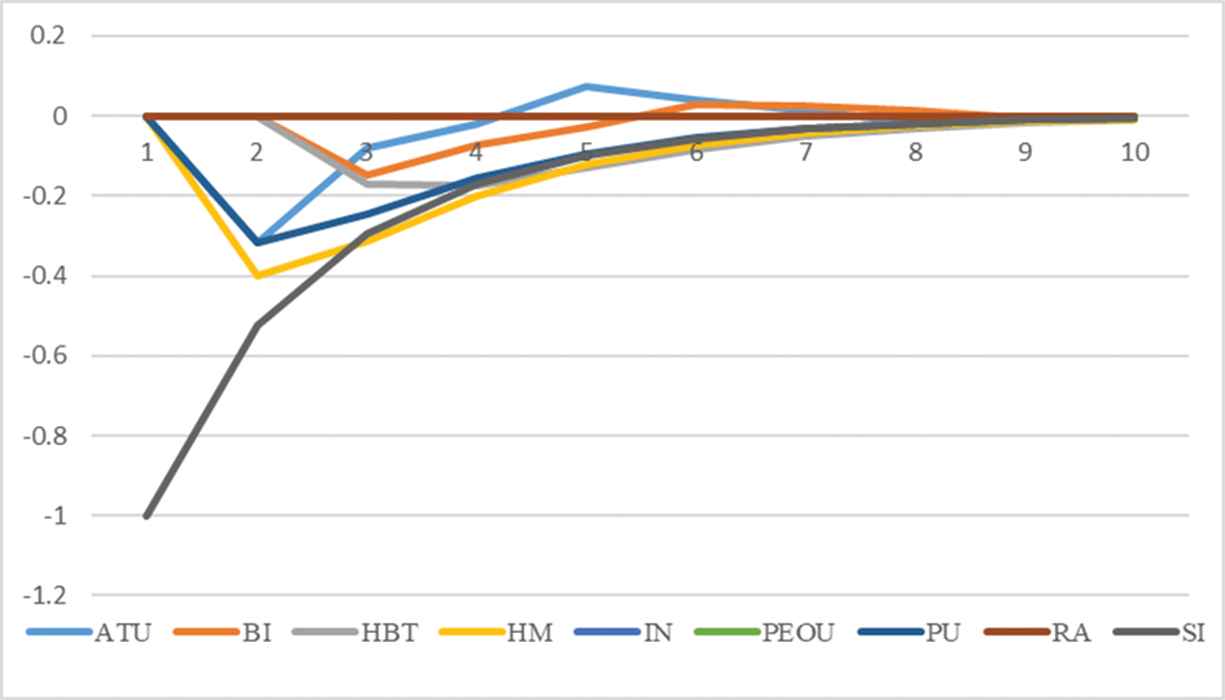
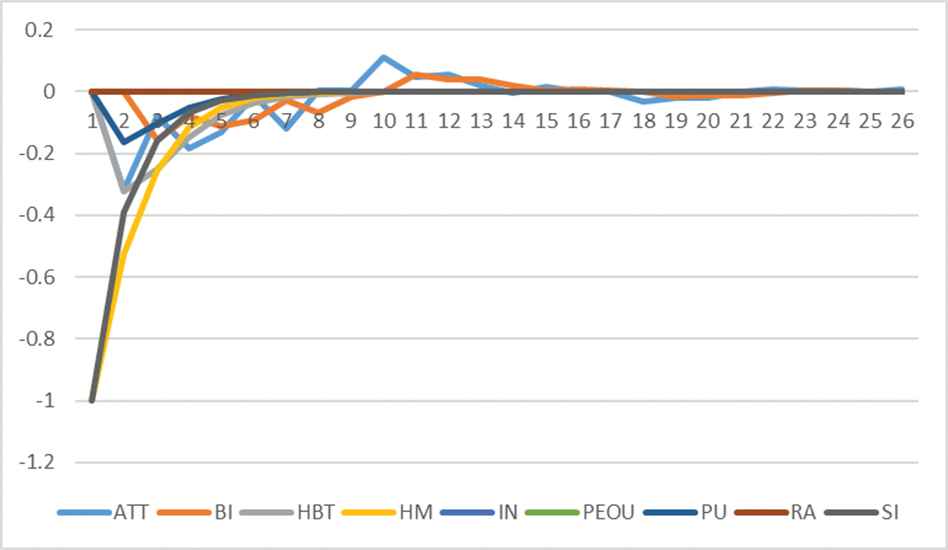
We generate three scenarios for Gen Z as for Gen X and Gen Y. We take SI and BI from the system one by one and together. Figure 9 shows the absence of SI for Gen Z. After eight iterations, and the system has become stable. ATU has decreased in the first place, and BI has decreased afterward when the lack of SI for Gen Z. PU follows the ATU, and HBT follows the BI in the decreasing phase. However, all factors have increased after decreasing in the short term.
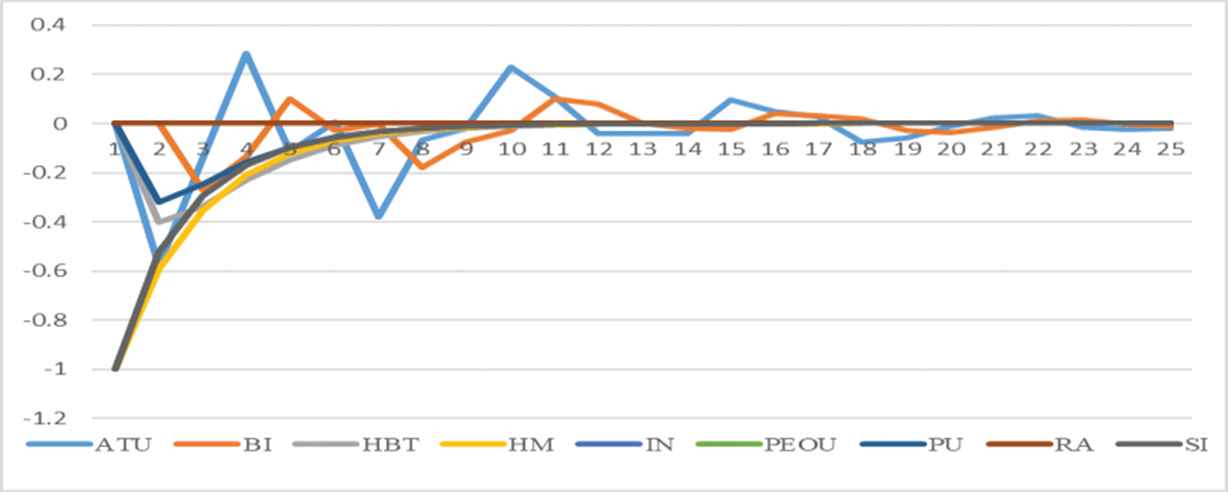
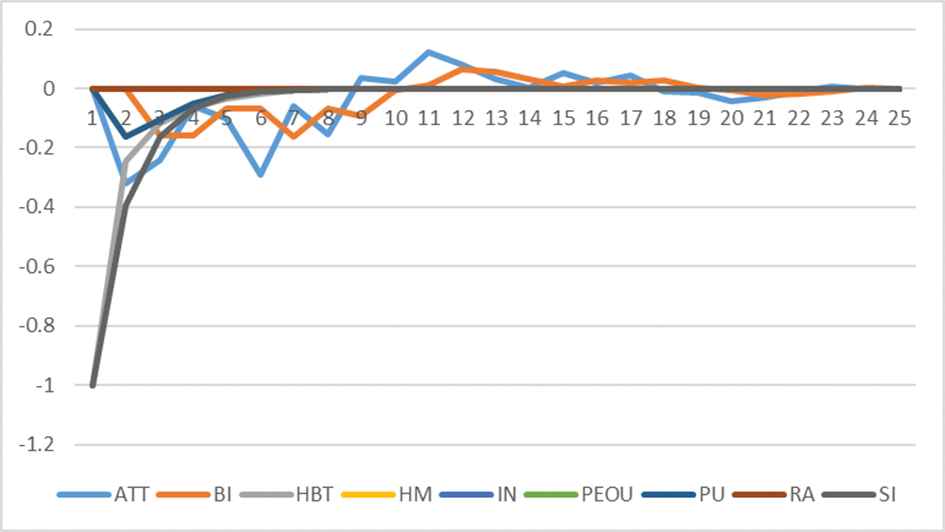
The second scenario for Gen Z demonstrates the lack of HBT in the system. Figure 10 represents the simulation of the absence of HBT. The slope of a BI and ATU have stayed in a negative direction for a while. ATU and BI have hardly become positive after approximately ten iterations. The absence of HBT for Gen Z has affected online shopping behavior negatively, as shown in Figure 10.
Our last scenario simulates the lack of HBT and SI together. Figure 11 shows the absence of SI and HBT. ATU has decreased dramatically in the first place, and BI has decreased afterward. The graph is similar to almost lack of HBT condition for Gen Z. It can be deduced that HBT factor is the dominant factor for Gen Z online shopping behavior.
5.4. Comparison Analysis
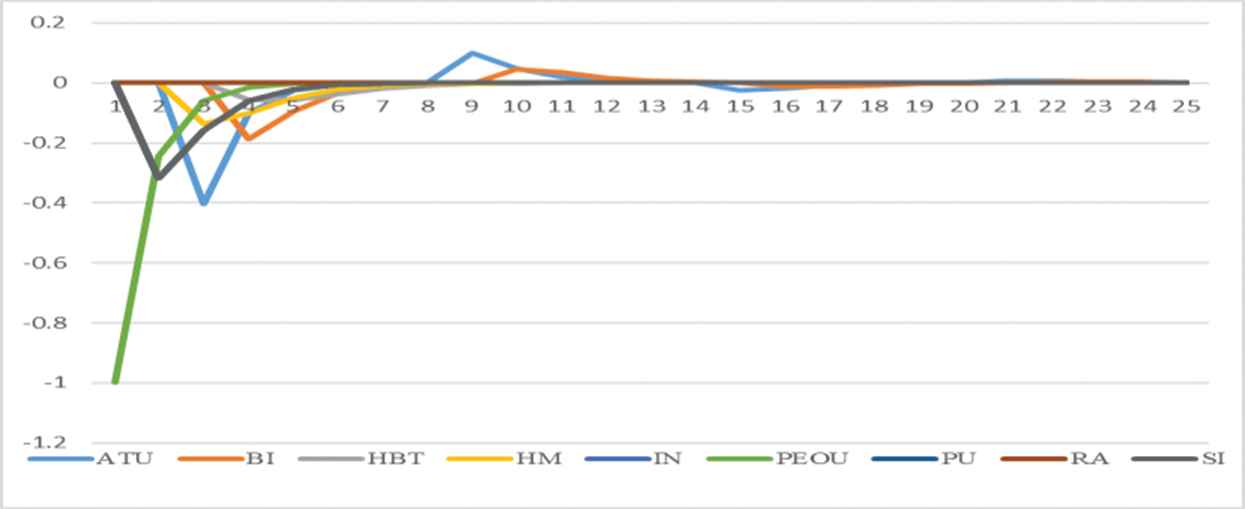
After all the simulations are generated, we have controlled the what-if scenarios under the circumstances of crisp coefficients. We simulate a scenario for each generation and compare the results. Figure 11 represents the lack of the HBT and PEoU condition under crisp coefficients for Gen X. It can be seen that in Figure 11, ATU and BI are acting under hesitant fuzzy conditions. However, under the crisps coefficient, the changes in the different steps are sharp and hard to explain. In other terms, hesitant fuzzy ensures a broader observation.
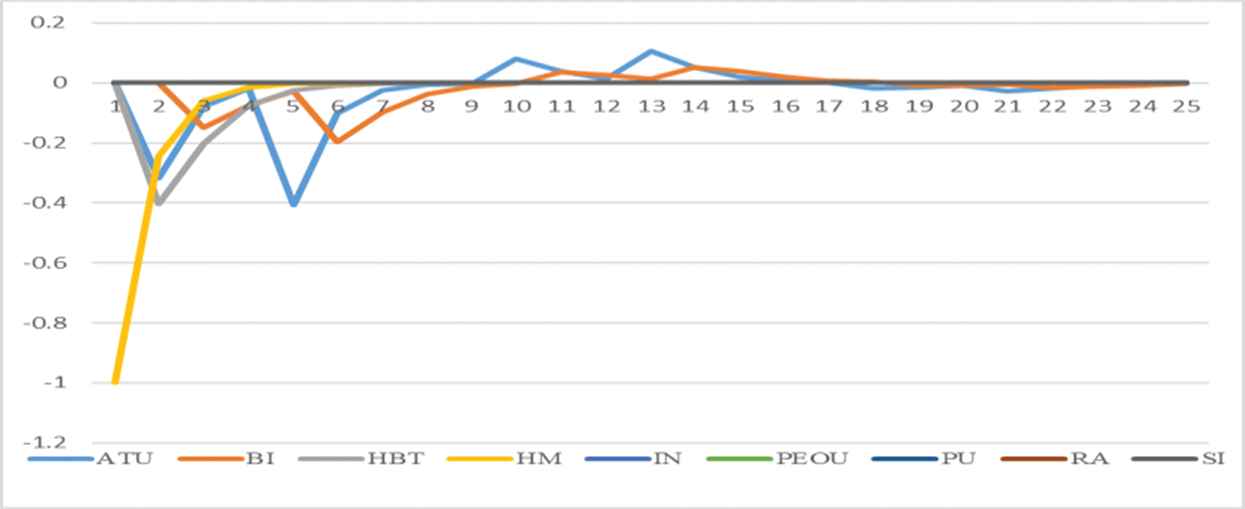
Figure 12 shows the absence of the HM and SI condition for under crisps coefficients for Gen Y. As it can be seen in Figure 12, ATU and BI have reached a positive scale after the 9th iteration. Under the hesitant fuzzy condition, we positively observe the same iteration number; however, we cannot see positive behavior between the start and ninth iteration under the crisps coefficients. Differently from the under crisps condition, we can see more various detail about factor's behavior journey
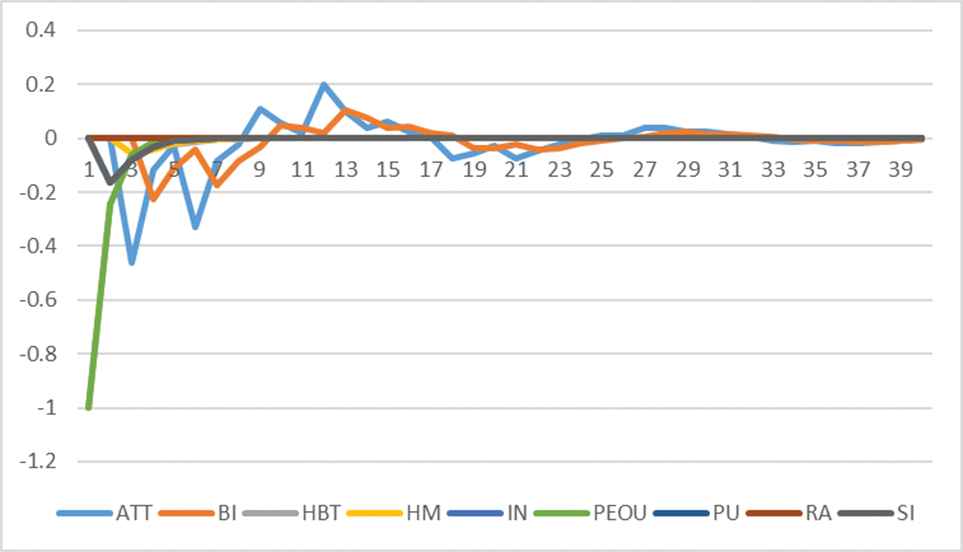
Figure 13 represents the lack of HBT and SI conditions under crisps coefficients for Gen Z. We observe similar outputs as in Gen X and Gen Y. Under the crisps coefficient, all factors are observed on a narrower scale for Gen Z.
Our method allows the broader observation scale in comparison with the crisps coefficients. In this way, more detail might be seen about the system, and if precaution is necessary, it might implement quicker. Taking hesitancy into consideration gives us an opportunity to examine the details of the system.
6. CONCLUSION
This study developed a hybrid data-driven, hesitant fuzzy cognitive map approach to deal with uncertainty and imprecision in evaluating online shopping behaviors. We focused on factors that affect online shopping. For these purposes, we used PLS-SEM and HFCM methods. First of all, we developed 9-factor-model, which is gathered from 3 main models. We examined their relationships, and we found statistically significant relations for each generation separately.
Solutions obtained from PLS-SEM is used to generated scenario. The effect size between significant relationships was transformed into linguistic terms for the HFCM method. The generation types have a significant impact on online shopping. Three different hesitant fuzzy cognitive maps are developed based on the data-driven model to identify the impact of different generations. The impact of different situations on generations' behaviors are observed through scenarios.
This approach can be thought of as our proposed hybrid method, contributing to the literature as a new method. For each generation, three different scenarios were generated. One factor is taken away from the model, which affects the ATU and B.I. Simulation has been shown and the result of the simulation is interpreted briefly for each generation separately.
For further studies, this new data-driven hesitant cognitive map methodology can be applied to different problems that involve uncertainty and hesitancy. The new extensions of fuzzy sets such as Pythagorean fuzzy sets, spherical fuzzy sets, intuitionistic fuzzy sets can be utilized to model the fuzzy cognitive map.
Our data-driven method might have combined with Zhang's algorithm [50] to reduce linguistic terms' hesitancy. Our novel approach may have also been used with Yu's approach [51] in a large-scale group decision-making field to make sure the hesitancy of consensus measure procedure would reduce. Instead of HFCM, Pythagorean fuzzy numbers with a Bonferroni mean aggregation might have used, as Wang [52]. After the statistical part, our model will extend the scope of the data-driven approach.
APPENDIX
| Factor | Sub-factor | Question | Reference |
|---|---|---|---|
| Perceived usefulness | PU1 | Shopping in online expedites the shopping and buy me an extra time. | Davis [6] |
| PU2 | Shopping in online increases my shopping quality and I can find better products. | Davis [6] | |
| PU3 | Shopping in online increases the my control over shopping process. | Davis [6] | |
| PU4 | In general, I find the online shopping useful. | Davis [6] | |
| Perceived ease of use | PEoU1 | Shopping in online is easy and understandable process. | Venkatesh et al. [27] |
| PEoU2 | I can easily handle my wishes when I shopping in online. | Davis [6] | |
| PEoU3 | I can reach whatever I want when I shopping in online. | Venkatesh et al. [27] | |
| PEoU4 | In general, shopping in online is easy for me. | Davis [6] | |
| Habit | HBT1 | Online shopping becomes a pattern for me. | Venkatesh et al. [7] |
| HBT2 | It can be said that I am addicted the shopping in online. | Venkatesh et al. [7] | |
| HBT3 | I feel compelled to do shopping in online. | Venkatesh et al. [7] | |
| Relative advantage | RA1 | Online shopping is faster than classical shopping method. | Moore and Benbasat [48] |
| RA2 | My shopping quality is greater than classical shopping method when I am shopping in online. | Moore and Benbasat [48] | |
| RA3 | Online shopping is more productive than classical shopping method. | Slyke et al. [49] | |
| RA4 | Online shopping is easier than classical shopping method. | Slyke et al. [49] | |
| Hedonic motivation | HM1 | Shopping in online is joyous. | Venkatesh et al. [7] |
| HM2 | Shopping in online is pleasurable. | Venkatesh et al. [7] | |
| HM3 | Shopping in online is quite entertaining. | Venkatesh et al. [7] | |
| Innovativeness | I1 | I look for a way to try new technologies. | Crespo and Rodriguez [16] |
| I2 | I am the one of the first trier to new technologies amongst my peers or my friends. | Crespo and Rodriguez [16] | |
| I3 | I like to try new technologies. | Crespo and Rodriguez [16] | |
| Social influence | SI1 | My social circle thinks that online shopping is better than classical shopping method. | Venkatesh et al. [7] |
| SI2 | My social circle thinks that online shopping is useful. | Venkatesh et al. [7] | |
| SI3 | My social circle thinks that I should shop in online. | Venkatesh et al. [7] | |
| Attitude towarduse | ATU1 | I like the idea of shopping in online. | Crespo and Rodriguez [16] |
| ATU2 | It is possible that I will continue the shopping in online. | Crespo and Rodriguez [16] | |
| ATU3 | I find continue the online shopping reasonable. | Crespo and Rodriguez [16] | |
| Behavioral intention | BI1 | I intend continue the shopping in online. | Venkatesh et al. [7] |
| BI2 | I intend online shopping more frequently. | Venkatesh et al. [7] | |
| BI3 | I think I will continue the online shopping in the long view. | Crespo and Rodriguez [16] |
REFERENCES
Cite this article
TY  - JOUR
AU  - M. Çağrı Budak
AU  - Sezi Cevik Onar
PY  - 2021
DA  - 2021/02/16
TI  - Analyzing Online Shopping Behaviors via a new Data-Driven Hesitant Fuzzy Approach
JO  - International Journal of Computational Intelligence Systems
SP  - 847
EP  - 858
VL  - 14
IS  - 1
SN  - 1875-6883
UR  - https://doi.org/10.2991/ijcis.d.210205.003
DO  - 10.2991/ijcis.d.210205.003
ID  - Budak2021
ER  -