
APOLLO: A Fuzzy Multi-criteria Group Decision-Making Tool in Support of Climate Policy
 , Konstantinos Koasidis2, , Alexandros Nikas2, *, , Apostolos Arsenopoulos2, Haris Doukas2,
 - DOI
- 10.2991/ijcis.d.200924.002How to use a DOI?
- Keywords
- Linguistic decision-making; Consensus; 2-tuple TOPSIS; APOLLO; Multi-criteria group decision-making; Austria; Climate policy
- Abstract
Multi-criteria decision-making is a daily process in everyday life, in which different alternatives are evaluated over a set of conflicting criteria. Decision-making is becoming increasingly complex, and the apparition of uncertainty and vagueness is inevitable, especially when related to sustainability issues. To model such lack of information, decision makers often use linguistic information to express their opinions, closer to their way of thinking, giving place to linguistic decision-making. However, the participation of multiple experts usually involves disagreements within the group, leading to unreliable solutions. To assist in decision-making and reduce such complexities, A grouP decisiOn fuzzy TOoL in support of cLimate change pOlicy making (APOLLO), a fuzzy decision support system, is introduced to deal with such problems in climate change and policy. The tool implements a framework for group decision-making, using 2-tuple Technique for Order Preference by Similarity to Ideal Solution (TOPSIS), coupled with a new consensus measuring model to increase robustness of selected solutions. The operation of the software tool is showcased in a real case carried out in Austria, where stakeholders were asked to assess the risks embedded in pathways for decarbonizing the country’s iron and steel sector. Results indicate that a coherent strategy addressing funding and competition issues is necessary, with experts displaying a consensus level of 85% in that these risks are the most threatening for the transition.
- Copyright
- © 2020 The Authors. Published by Atlantis Press B.V.
- Open Access
- This is an open access article distributed under the CC BY-NC 4.0 license (http://creativecommons.org/licenses/by-nc/4.0/).
1. INTRODUCTION
Decision-making (DM) problems range from the most common situations in human beings’ daily lives (e.g., what film to see at the cinema) to much more complex ones that may affect larger social units, including communities (a new policy to reduce pollution in a city center), nations (a financial incentive to boost technological innovation), regions (sectoral coverage of the European Union’s Emissions Trading System), or the globe (effort sharing in mitigating climate change). A DM problem always comprises a set of alternatives or possible solutions for the problem, and often a group of experts with different attitudes, who evaluate these alternatives in order to collectively select the “best” one. More often than not, the evaluation of the alternatives is based on several criteria, leading to multi-criteria decision-making (MCDM) [1,2].
However, in many MCDM problems, complexity significantly increases, with conflicts emerging among alternatives’ performances across the evaluation criteria and reaching one optimal solution not being a straightforward process [3]. Furthermore, combined with the lack of information related to the alternatives, this complexity often implies the apparition of uncertainty. In this situation, modeling uncertainty is not a trivial task, since experts are usually unable to express it by using exclusively discrete assessments. To overcome the latter limitation, linguistic variables [4] have been used successfully [5]. By means of such variables, experts can express their opinions by using linguistic terms, such as good or very bad, high, or insignificant, etc., which are closer to their way of thinking. Under these conditions, MCDM becomes linguistic decision-making (LDM) [6].
The classical resolution scheme for MCDM problems considers only the aggregation of the experts’ opinions over the alternative actions in order to obtain a ranking of these actions and select the best one [7]. This could often lead to situations where the possible disagreements that may emerge in the group are ignored or not reflected in the aggregate preferential model [8]. Consequently, some experts might not agree with the solution achieved and feel outside of the decision process. To increase the robustness of the chosen solutions, a consensus level of the experts can be measured [9] to identify sources of proximity and disagreement.
Nowadays, many of the most important real-world MCDM problems are related to sustainability issues [10]. The effects of global environmental change are becoming increasingly obvious and its impacts on our societies, economies, and environment, today and in the near future, constitute one of the main concerns worldwide. This is why nations have long set out to address this challenge (e.g., the Kyoto Protocol and, recently, the Paris Agreement), in a globally coordinated and cooperative manner [11].
The enormous complexity of problems associated with climate change and action, especially in the context of an all-inclusive, participatory, and transparent dialogue, based on the principles of Talanoa [12], makes experts often come up with a series of assumptions that fail to reflect the real-world constraints, in order to reduce such complexity. MCDM has long been used to address challenges and resolve problems associated with environmental, energy, and climate policy [13]. Respectively, decision support systems, i.e., software tools used to support decisions, judgements, and courses of action, have recently been developed, featuring the capacity to solve climate change-related MCDM problems from the perspective of multiple stakeholders (e.g., Nikas et al. [14]; Jeong [15]), without however aiming to improve consensus.
In this direction, this research aims to make an important qualitative contribution within the climate change policy research area by presenting a new fuzzy decision support system, A grouP decisiOn fuzzy TOoL in support of cLimate change pOlicy making(APOLLO). The main aim of APOLLO is to facilitate a consensus measuring process of a group of individuals toward reaching the best decision for an MCDM problem related to climate change and policy issues. Additionally, the software has the ability to analyze the conflicts (or disagreements) that emerge among the experts. Furthermore, in order to validate it and showcase its usefulness, APOLLO is presented and stress-tested in a real-world case study that was carried out in Austria, in the context of assessing the risks embedded in pathways for decarbonizing the country’s iron and steel sector.
From a methodological point of view, this paper seeks to contribute to the literature by establishing a new decision support system that focuses on dealing with problems related to climate change adaptation and mitigation policy issues. It takes into account the challenges of engaging with multiple actors from various stakeholder groups and thereby increases ownership of decisions, while introducing a new consensus analysis method, drawing from the literature.
The rest of the paper is organized as follows: Section 2 reviews several basic concepts toward facilitating the understanding of proposed method and tool. Section 3 introduces both the resolution process and the architecture of APOLLO. Section 4 describes the real-world case study on evaluating risks associated with the decarbonization of Austria’s iron and steel sector, showcasing the performance of the APOLLO decision support tool. Finally, in Section 5 some conclusions and prospects of our research are drawn.
2. METHODS AND TOOLS
This section describes the proposed methods and tools that will be implemented in APOLLO. First, the choice of linguistic variables is facilitated through the review of LDM and the presentation of the 2-tuple linguistic model. Second, the 2-tuple Technique for Order Preference by Similarity to Ideal Solution (TOPSIS) model that APOLLO uses to solve group DM problems is described. Finally, the new consensus measuring framework is introduced.
2.1. Linguistic Decision-Making
Human beings are continuously faced with decision problems; what to eat, what mobile phone to buy, or what shoes to wear today are common examples of this type of problems. As the problematic, along with the impacts of a decision to address it, shifts from individuals to larger social units (e.g., policymaking), the decision-making process requires ownership of a collectively acceptable solution and therefore entails the engagement of more than one decision maker. Formally, in these cases, the DM problem is formed by a set of experts,
As complexity of a DM problem increases, with decision makers not knowing all of the information required to make a decision about the problem, uncertainty and vagueness are present. Under these circumstances, the classical probabilistic models cannot be used to obtain a solution and a different approach to deal with these problems is necessary. The fuzzy linguistic approach and fuzzy variables [4] have been widely used in the DM area in order to model the inherent uncertainty that appears in many decision situations, giving place to LDM [6]. In an LDM problem, the group of engaged individuals provide their opinions by using linguistic expressions, which are considered closer to the way in which human beings express their ideas.
Due to experts using linguistic expressions to give their opinions, it is essential to carry out computations with such linguistic information in order to provide consistent solutions for the LDM problems. Furthermore, these results should also be represented linguistically to promote understanding from the decision makers’ point of view. The Computing with Words (CWWs) methodology [16–18] tries to mimic the reasoning process of human beings, by obtaining linguistic outputs from the linguistic inputs provided by the stakeholders. Many DM methods follow this methodology to solve an LDM problem. In this research, we focus on an extension of the TOPSIS, based on the 2-tuple linguistic model.
2.2. The 2-Tuple Linguistic Model
The 2-tuple linguistic computational model [19] is a symbolic model that was introduced as an improvement of other linguistic modeling approaches [20]. It carries out linguistic computational processes in an easy and comprehensive manner, without losing information, using a continuous linguistic domain, and outputs results that are expressed in the same linguistic domain [14].
To represent linguistic information, the 2-tuple model uses a pair of values that is called linguistic 2-tuple
Let
In essence, the 2-tuple linguistic representation model extends the use of indexes modifying the fuzzy linguistic approach, by adding a symbolic translation that represents the linguistic information by means of a linguistic 2-tuple.
Finally, for a linguistic term set
Evidently, the conversion of a linguistic term into a linguistic 2-tuple consists of adding a value 0 as symbolic translation:
2.3. The 2-Tuple TOPSIS Model
TOPSIS [21] is an MCDM method based on the idea that the best alternative is the closest to a positive ideal solution and the farthest from a negative ideal solution. Initially, TOPSIS was proposed as an MCDM method that can deal with numerical assessments and has been found to be relevant in the climate policy domain [14]; but, as already discussed, uncertainty often appears in many DM problems and, consequently, the need for linguistic information emerges. Several fuzzy TOPSIS methods have been proposed both in the broader literature as well as in climate policy support research [13].
Here, we build on the 2-tuple TOPSIS approach introduced in Ref. [22], which makes use of the 2-tuple linguistic model [23] and a new distance function that allows to obtain more precise and interpretable results than other models. However, instead of aggregating the initial input from the stakeholders using average values and then perform the 2-tuple TOPSIS, we follow the methodology established by Krohling and Campanharo [24] where the fuzzy TOPSIS was used in the experts’ preference to create a global model and then another round of fuzzy TOPSIS was performed to acquire the global solution with the experts’ individual solutions acting as the criteria. Nikas et al. [14] expanded the concept of using a double round of TOPSIS in group DM by using behavioral instead of fuzzy TOPSIS. The 2-tuple TOPSIS method to be used on this study consists of the following steps:
Defining a weight vector
Calculating the normalized 2-tuple weight vector
Normalizing with the cardinal of the linguistic scale instead of the maximum value, as suggested in the original method, is preferred to avoid exaggerating the differences between the responses.
Defining the decision matrix
Calculating the weighted decision matrix
Calculating the positive and negative ideal solutions for each stakeholder
Determining the distance of each alternative from the positive and negative ideal solutions for each stakeholder
andwhereCalculating the relative closeness degree of each alternative from the positive ideal solution for each stakeholder
the current form the results are expressed in the linguistic scale S used by the stakeholders to increase interpretability. The results could have been displayed in the scaleComputing the collective 2-tuple linguistic decision matrix
Calculating the positive and negative ideal collective as
Determining the distance of each alternative form the positive and negative ideal solutions for each stakeholder t as
Finally, calculating the relative closeness degree of each alternative from the positive ideal solution as
The results could have been displayed in the distance scale
2.4. Consensus Measuring
MCDM methods allow to obtain a solution for a DM problem. In certain occasions, however, the solutions obtained do not satisfy all of the engaged stakeholders participating in the decision-making process. For this reason, Ref. [25] suggests measuring a realistic and “human-consistent” degree of consensus to calculate these differences, softening the concept of complete agreement by introducing the “soft” consensus degree [1,26,27]. Kuncheva [28] identifies five metrics for consensus measuring based on comparisons between the experts’ evaluations, which capture either common ground among the answers or sources of disagreement [9]. Many studies used such metrics to extract consensus level information from comparing the experts’ preference data [29,30]. However, Herrera-Viedma et al. [31] argue that these methods can withhold information or underestimate consensus, since different evaluations may lead to similar solutions. To avoid this bias, they propose an alternative approach, which is based on comparing the rankings of the experts’ assessments with a global solution instead of each other’s preferences. Boroushaki and Malczewski [32] adapted the model to integrate geographical information systems with MCDA, while Ben-Arieh and Chen [33] also considered the degree of importance of each expert.
However, in this approach, alternatives with similar evaluations in the global solution may result in huge differences in the rankings, which will subsequently lead to exaggerations of dissimilarity, if only the rankings are taken into account. Here, we build on Ref. [31] by applying a consensus measuring model that is similarly based on the comparison of a global solution with the experts’ assessments but takes advantage of the 2-tuple TOPSIS evaluations provided by the distance function instead of the rankings. The model is described below:
The dissimilarity of each expert for each alternative
where i stands for each expert, j stands for each alternative, b can be in the range of (0, 1) to control the rigorousness of the model,Next, we calculate the consensus degree of all experts on each alternative
where m stands for the total number of experts.Finally, we calculate the consensus measure over the set of alternatives, called
where k is the total number of alternatives. In the original model, the aggregation of the consensus degree of each alternative into the final consensus measure was performed by using the S-OWA OR LIKE operator [34]. Through this process the set of alternatives was split in a set of solutions and a set of remaining alternatives, where the former is given an increased weight, leading to the dependence of the consensus measure on the choice of the OWA operator. To avoid this issue, in our approach, the aggregation is performed through a weighted average formula, where the evaluation of the 2-tuple TOPSIS of the global solution for each alternative is used as the weight of the consensus degree over this alternative.Applying a similar approach with the consensus measure, the proximity of i-th expert to the global solution can be calculated:
A group decision fuzzy tool in support of climate change policy making's (APOLLO) resolution scheme.
3. APOLLO
This section introduces a fuzzy MCDM group decision tool, APOLLO, to solve multicriteria problems under uncertainty, related to climate change and policy. First, we discuss the different steps that describe the resolution scheme of the introduced software, and then we present its architecture.
3.1. Resolution Scheme
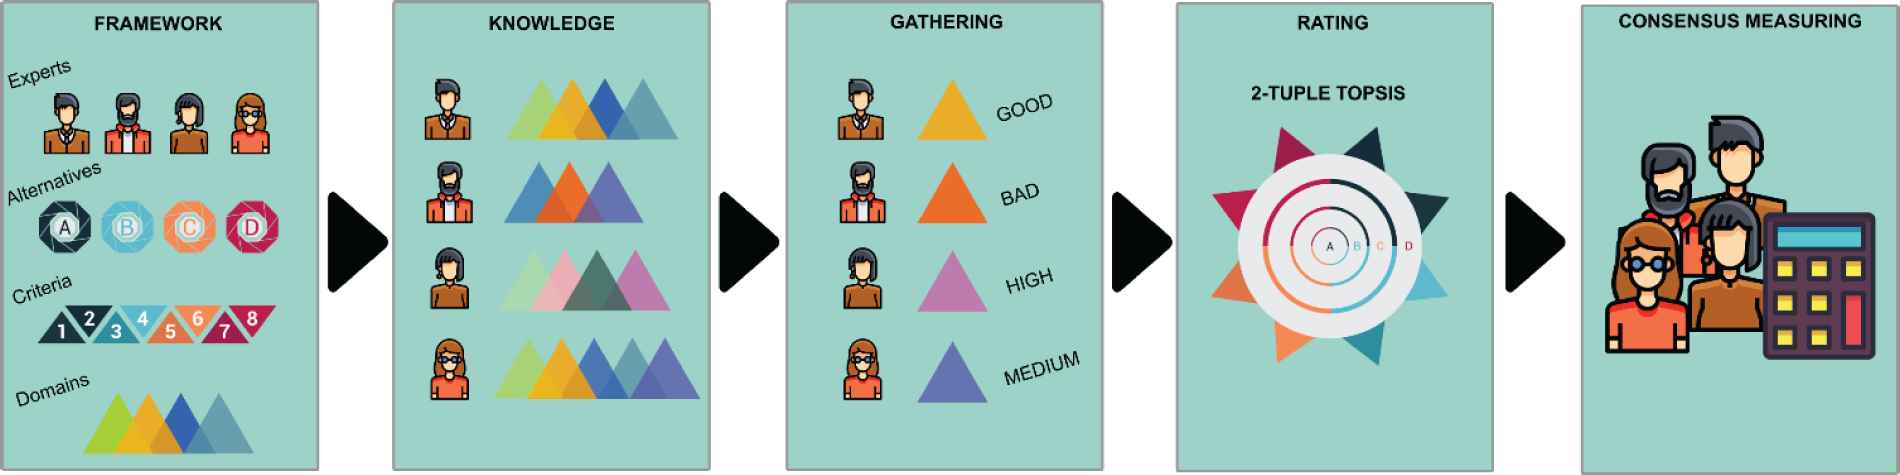
APOLLO has been developed with the aim of solving LDM problems related to climate change issues, fully aligned with policy developments, such as the Paris Agreement and the Talanoa dialogue, as well as with emerging scientific paradigms in support of these developments (e.g., Doukas et al. [11]; Weitzel et al. [35]). Furthermore, due to the complexity and importance usually linked to these kinds of problems and in the aim of maximizing governance (of science, risks, and policy), our goal is to also provide solutions in which the majority of stakeholders (and stakeholder groups) participating in the decision process agree with one another. Hence, it is necessary to propose a specific LDM solving process that, on one hand, allows using MCDM methods in order to provide solutions for the decision problem and, on the other hand, guarantees that such solutions satisfy the largest part of the group of engaged individuals as much as possible, mitigating potential disagreements. APOLLO’s resolution scheme is composed by different steps that are described in the following subsections (see Figure 1).
3.1.1. Problem definition (Framework)
This step allows defining the MCDM problem. Stakeholders, criteria, alternatives, and the expression domains that the stakeholders use to provide their preferences. In this application, we consider that stakeholders use linguistic expressions in order to facilitate the preference elicitation process, thus the expression domains are represented by fuzzy linguistic term sets, the label numbers of which can be selected by the user/analyst.
3.1.2. Knowledge domain assignment (Knowledge)
Although linguistic expression domains are created in the previous step, it is essential to match these domains to each participating stakeholder. In doing so, several linguistic scales can be defined, each one tailored to the knowledge/preference of each engaged decision maker.
3.1.3. Preference elicitation (Gathering)
At this stage, stakeholders provide their assessments by using linguistic expressions. In this version, stakeholders may use expressions represented by single linguistic terms, such as Good, Bad, High, or Very Low.
3.1.4. Multi-criteria solution (Rating)
This phase carries out the resolution of the MCDM problem. This version of APOLLO uses the 2-tuple TOPSIS method to solve the defined MCDM problem by following the steps introduced in Section 2.3.
3.1.5. Consensus measuring
This step allows us to measure the consensus and proximity level of the solution found in the previous stage. APOLLO calculates consensus based on the model presented in Section 2.4
If desired, a consensus reaching process (CRP) [36,37] can be applied to bring the experts’ assessments closer with one another and achieve an acceptable level of agreement in the group (consensus control) [38]. The initial experts’ preferences would then be modified through iterative rounds and used to obtain a consensual solution for the problem (feedback process), to conclude the CRP cycle [39].
3.2. Architecture
APOLLO has been developed using an Eclipse Rich Client Platform (RCP) developed by IBM and created for building desktop applications with richer functionality. The main advantage of this technology is the capability to extend, modify, and reuse the applications easily in different operative systems thanks to the components-based architecture. Components or also so-called plugins are small pieces of software interconnected with each other that compose the whole RCP application. The use of plugins allows connecting them to other RCP applications and increase their functionality without the need to have a full understanding of how the application works. APOLLO is composed by several plugins classified into different categories:
User interface: the plugins which belong to this category are used to visualize the user interface of the application (buttons, plots, etc.).
MCDM: the plugins included in this category represent all the information related with the MCDM problems and their resolution. Here we can find plugins to represent the different elements of the problems, for instance, experts, alternatives, criteria, or expressions domains. In addition, the MCDM models to solve the problem are also classified in this category. For this version of APOLLO, the 2-tuple TOPSIS is the selected MCDM method but others can be added.
Consensus: APOLLO solves MCDM problems by using MCDM methods but also incorporates plugins that measure the consensus level. In this way, the selection of the best alternatives is accompanied by a consensus level to obtain a more robust solution.
The APOLLO’s architecture is represented in Figure 2.

A group decision fuzzy tool in support of climate change policy making's (APOLLO) architecture.
4. CASE STUDY
In order to show the usefulness of APOLLO, we use it to solve a real MCDM problem related to the decarbonization of iron and steel production in Austria.
4.1. Background Information
Iron and steel is considered an energy-intensive industry [40], accounting for 4%–7% of the industrial CO2 emissions in the EU [41], while in 2017 contributed almost 16% of the industrial and 1.5% of the total GHG emissions [42]. In Austria, these shares are even higher, with iron and steel producing 65% of the industrial and 14% of the total GHG emissions in 2017, according to the UNFCCC Inventory, highlighting the importance of decarbonization of the sector as part of the country’s emissions mitigation targets. As seen in Figure 3, the emissions of the sector do not only represent a high share, but they steadily increased through time, despite the fluctuation of the total emissions and the obvious decrease from the 2005 level, even rebounding from the decrease caused by the economic crisis in 2008.

Total, Industrial and Iron and Steel greenhouse gas (GHG) emissions in Austria. Source: UNFCCC [42], own elaboration.
Part of the intensity of the iron and steel industry can be attributed to technological reasons for the production process. The dominant process for primary production is the energy-intensive Blast Furnace/Basic Oxygen Furnace route (BF-BOF), where iron ores are reduced to iron, using coke as a reducing agent [43]. The secondary steelmaking process is the Electric Arc Furnace (EAF) route which produces steel from recycled scrap, requiring a third of the energy needed in the BF/BOF route [44].
In Austria the majority of iron and steel produced is based on the BF/BOF route [45]. The dominance of BF-BOF compared to other European regions makes Austria one of the most sensitive countries to CO2 prices in the EU [46]. Therefore, radical innovations need to be implemented in the sector to be able to adapt to deep decarbonization strategies [47], since simple solutions like the Best Available Techniques have limitations [48]. Such cutting-edge technologies include hydrogen-based production that could drastically reduce emissions intertwined with renewable energy production [49]. However, actors are usually skeptical about large-scale transitions out of fear of the cost and risk associated with the adoption of radical innovations [50]. These fears need to be considered during the development of policies, since actively engaging stakeholders in the process could provide valuable insights on their point of view towards a “greener” industry [51]. This background constitutes the motivation of our study, showcasing why the Austrian iron and steel sector was selected as a case study.
4.2. Alternatives and Evaluation Criteria
In order to facilitate the transition pathway of the Austrian iron and steel industry, risks associated with this transition are prioritized through the engagement of stakeholders in an iterative co-creative process that will provide insights into what key actors of the system fear the most.
In our study, we focus on risks that cut across a number of dimensions, such as energy infrastructure, the political and institutional status, environmental issues related to end-use acceptance, financial markets, and technological innovation (Table 1), adapting from the clustering of risks performed in Bachner et al. [51] and Wolkinger et al. [52]
Most risks are intertwined with the need to achieve wide-scale diffusion of centralized and decentralized renewable energy sources, in order to support green hydrogen production to be used in industry. This is evident in the infrastructure cluster, where the challenges posed to the stability of the grid due to the increase of renewable generation [53] and storage limitations are analyzed. Importance is also given to the institutional level to manage policy-related risks and financially support technological innovation that will pave the way for a just transition that will be acceptable by the society despite lock-ins in the dominant regimes [54]. The list of risks is not exhaustive, given the multiplicity of the various risks that can hinder the envisaged transition pathway, but was considered by the stakeholders to be representative of the risks decelerating the energy transition.
The identified risks are evaluated against four criteria: (a) their likelihood to manifest; (b) the level of the perceived impact that they can have on the climate mitigation policy framework; (c) lack of state/societal capacity to mitigate them; and (d) level of concern.
| Group | Alternatives | Evaluation Criteria |
|---|---|---|
| Energy infrastructure | R1. Lack of transparency | C1. Likelihood to manifest |
| R2. Grid Instability | C2. Impact on policy | |
| R3. Lack of storage capacity | C3. Lack of mitigation capacity | |
| R4. Complicated investment procedures | C4. Level of concern | |
| Environmental/ acceptability |
R5. Social injustices | |
| R6. Insufficient consideration of lifestyles | ||
| R7. Resource consumption overlooked | ||
| R8. Social resistance against investments | ||
| R9. Lack of investment framework | ||
| Political/ institutional framework |
R10. Non-evidence-based regulatory framework | |
| R11. Short-sighted energy/climate planning | ||
| R12. Market distortions | ||
| R13. Lack of political leadership | ||
| R14. Fluctuation of CO2 prices | ||
| Financial | R15. Non-coordination at the EU level | |
| R16. Uneven distribution of transition costs | ||
| R17. Non-engaging/unstable markets | ||
| R18. Narrow consideration of competition | ||
| R19. Price risks due to new technologies | ||
| Innovation and technology | R20. Limited funding capacity | |
| R21. Bad timing of new industry technologies | ||
| R22. Technological lock-ins in iron and steel | ||
| R23. Little integration across multiple sectors | ||
| R24. Lack of information flows | ||
| R25. Imperfect picture of transition | ||
Risk classification and evaluation criteria.
4.3. Stakeholder Input
Based on the stakeholder dialogue format described in Ref. [51], ten stakeholders (E1…E10) from the Austrian iron and steel sector were engaged in the process through bilateral interviews and workshops.
Initially the stakeholders were asked to assess the importance of the four evaluation criteria, using a 5-term linguistic scale {None (N), Low (L), Medium (M), High (H), Extreme (E)}. The evaluations are presented in Figure 4.
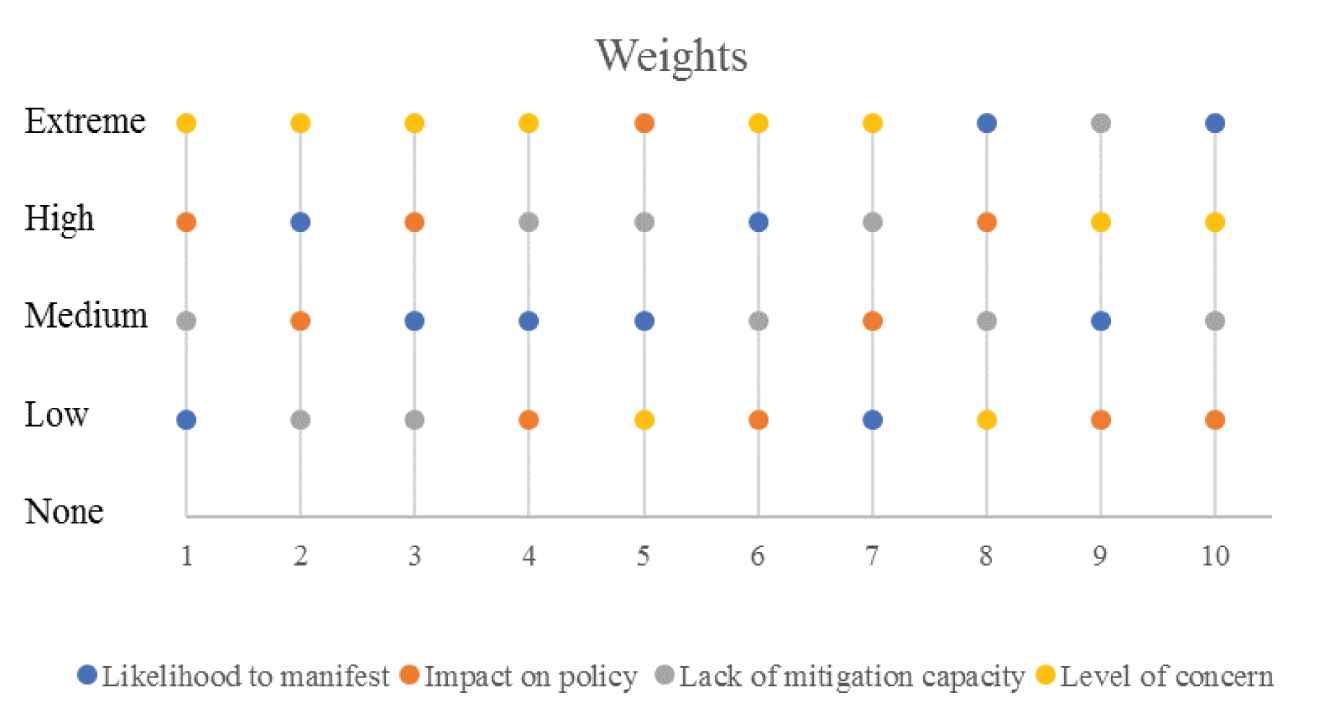
Criteria weights assigned by the ten stakeholders.
Despite significant variance in the responses, the majority of the stakeholders consider the level of concern over each risk to be an important evaluation factor, with six of them weighting concern with extreme importance, two with high importance and only two considered it of low importance.
In the next step, stakeholders were asked to evaluate each alternative/risk against these criteria answering to the questions in Table 2.
| Evaluation Criteria | Question | Linguistic Scale of the Answers |
|---|---|---|
| C1. Likelihood to manifest | What is the likelihood for the following risks to occur? | {Very unlikely, Unlikely, As likely as not, Likely, Very Likely} |
| C2. Impact on policy | If the following risks were to occur, what would be the extent of their impact? | {Limited, Considerable, Great, Extreme, Catastrophic} |
| C3. Lack of mitigation capacity | If the following risk were to occur, how would you estimate the capacity of relevant actors to mitigate them? | {None, Low, Medium, High, Extreme} |
| C4. Level of concern | How worried are you about following risks? | {Not worried, A little worried, Somewhat worried, Very worried, Extremely worried} |
Questions asked to the stakeholders for the evaluation of each risk against the four criteria.
The responses of the stakeholders are then converted in the same scale used for the weights, {None, Low, Medium, High, Extreme}, while the answers for Criteria 3 are appropriately adjusted to reflect the lack of capacity.
Based on the adjusted answers, the distribution of the assessments for each term of the linguistic scale is presented in Figure 5. Most of the experts’ answers are concentrated around medium and neighboring terms.

Distribution of the experts’ assessments for each linguistic term.
However, the experts seemed more reluctant to use the higher scales, since “none” received almost double the answers of “extreme,” while “low” received a higher number of responses than “high.” This indicates that the experts showcased a moderate behavior being less willing to use stricter terms.
4.4. Results
4.4.1. Experts’ individual solutions
After initial assessments, the 2-tuple TOPSIS model described in Section 2.3 is applied to the answers of each expert independently, in order to calculate the rank and the score of each alternative. In Table 3, the assessments and results of 2-tuple TOPSIS are presented for Expert 1; a similar process is followed for the rest of the experts.
| C1 | C2 | C3 | C4 | Results | |
|---|---|---|---|---|---|
| Weights | L | H | M | E | |
| R1 | M | L | L | L | 0.92 |
| R2 | E | H | L | M | 2.77 |
| R3 | H | M | N | M | 1.85 |
| R4 | H | H | M | M | 2.92 |
| R5 | H | L | N | L | 0.77 |
| R6 | H | L | N | L | 0.77 |
| R7 | M | L | L | L | 0.92 |
| R8 | H | H | L | M | 2.62 |
| R9 | E | H | L | H | 3.38 |
| R10 | M | M | M | M | 2.31 |
| R11 | H | L | M | M | 2.00 |
| R12 | L | N | L | L | 0.31 |
| R13 | H | M | L | H | 2.77 |
| R14 | H | M | M | M | 2.46 |
| R15 | H | H | L | H | 3.23 |
| R16 | H | M | M | M | 2.46 |
| R17 | H | M | M | M | 2.46 |
| R18 | H | M | H | M | 2.77 |
| R19 | H | L | L | M | 1.69 |
| R20 | M | M | M | M | 2.31 |
| R21 | H | H | L | M | 2.62 |
| R22 | M | L | L | L | 0.92 |
| R23 | H | M | L | H | 2.77 |
| R24 | E | H | M | M | 3.08 |
| R25 | H | M | M | M | 2.46 |
Assessments and results for Expert 1.
In Figure 6, the results of the 2-tuple TOPSIS for each expert are presented. Despite general similarities among the results, significant differences between individual choices exist. For example, Expert 4 considers alternative R22 “Lock-ins due to capacity mechanisms” to be the most important risk with an evaluation of (Extreme, −0.19), while Expert 3 considers it to be the risk with the lowest importance and a score of (Low, −0.45). These differences illustrate that the stakeholder pool is well diversified, mitigating possible biases in the collective solution.
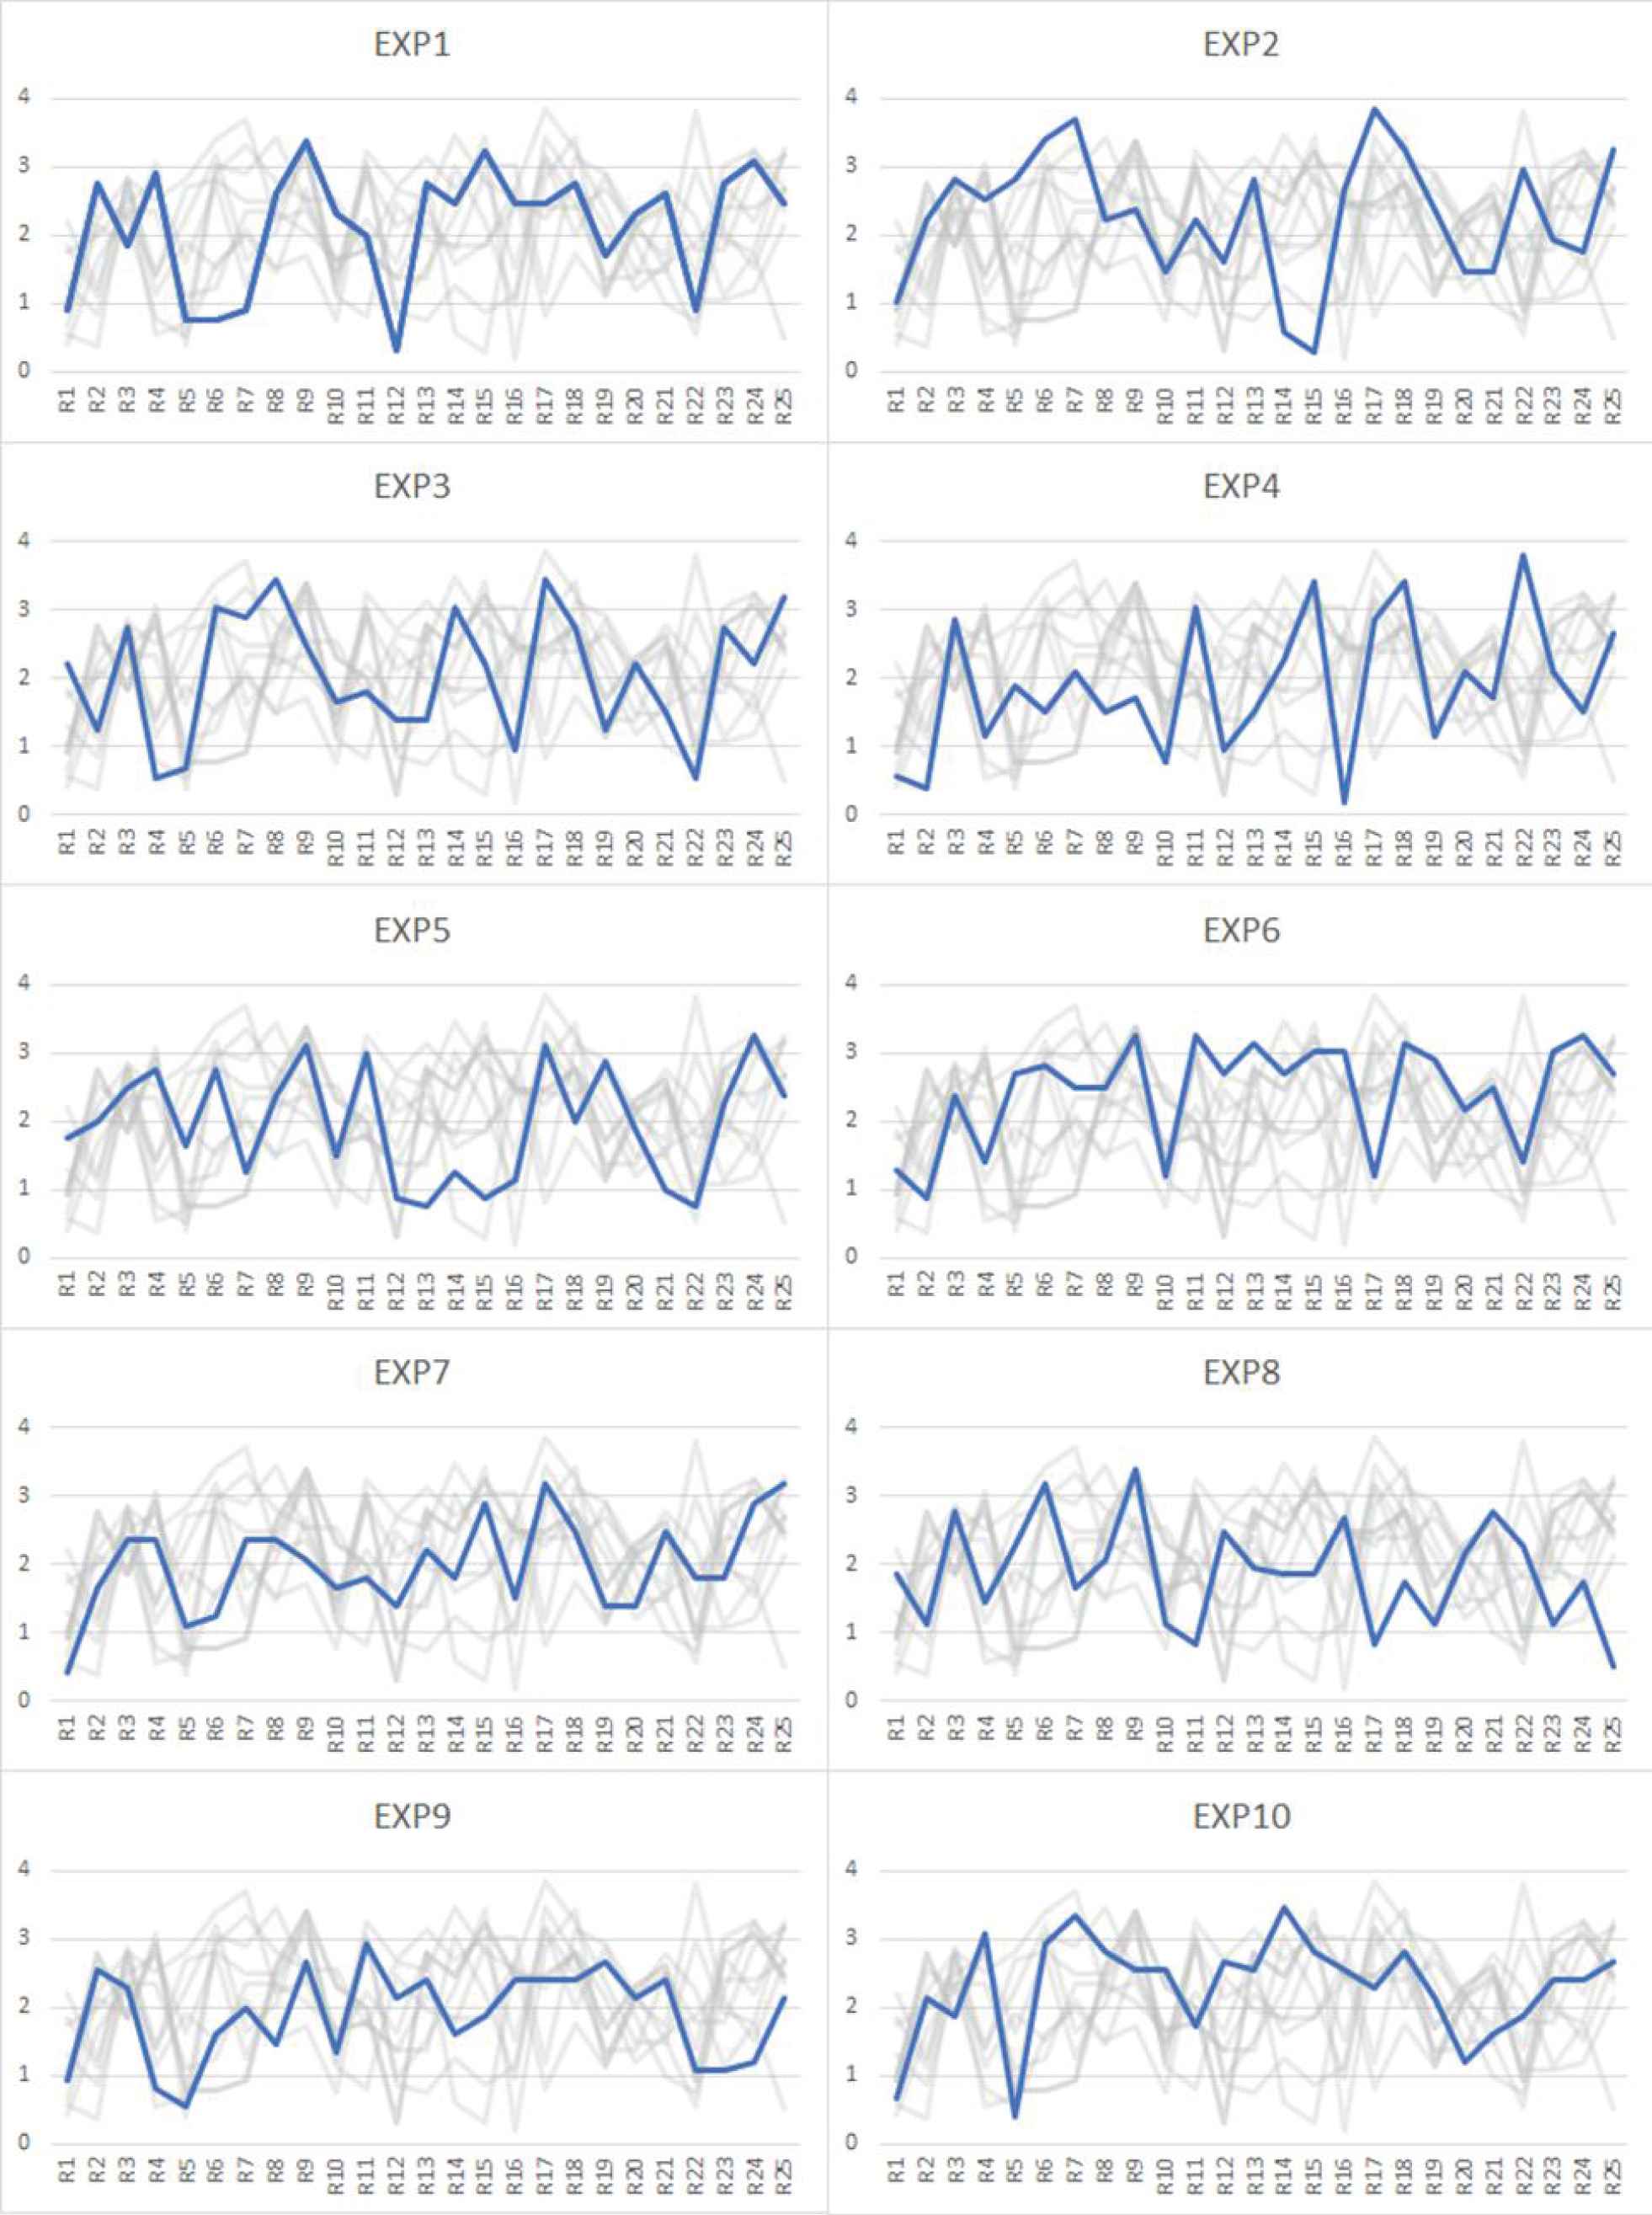
Results of 2-tuple Technique for Order Preference by Similarity to Ideal Solution (TOPSIS) for each individual expert.
4.4.2. Collective solution
The results for each individual expert are used to create the new matrix to be used to calculate the collective solution of the group. In that case, the experts will play the role of equally weighted criteria. The 2-tuple TOPSIS is then run again to the new matrix (Table 4) to assess the importance of each alternative as a collective group.
| E1 | E2 | E3 | E4 | E5 | E6 | E7 | E8 | E9 | E10 | |
|---|---|---|---|---|---|---|---|---|---|---|
| R1 | 0.92 | 1.04 | 2.21 | 0.57 | 1.75 | 1.30 | 0.41 | 1.85 | 0.93 | 0.67 |
| R2 | 2.77 | 2.22 | 1.24 | 0.38 | 2.00 | 0.86 | 1.66 | 1.13 | 2.53 | 2.13 |
| R3 | 1.85 | 2.81 | 2.76 | 2.86 | 2.50 | 2.38 | 2.34 | 2.77 | 2.27 | 1.87 |
| R4 | 2.92 | 2.52 | 0.55 | 1.14 | 2.75 | 1.41 | 2.34 | 1.44 | 0.80 | 3.07 |
| R5 | 0.77 | 2.81 | 0.69 | 1.90 | 1.63 | 2.70 | 1.10 | 2.26 | 0.53 | 0.40 |
| R6 | 0.77 | 3.41 | 3.03 | 1.52 | 2.75 | 2.81 | 1.24 | 3.18 | 1.60 | 2.93 |
| R7 | 0.92 | 3.70 | 2.90 | 2.10 | 1.25 | 2.49 | 2.34 | 1.64 | 2.00 | 3.33 |
| R8 | 2.62 | 2.22 | 3.45 | 1.52 | 2.38 | 2.49 | 2.34 | 2.05 | 1.47 | 2.80 |
| R9 | 3.38 | 2.37 | 2.48 | 1.71 | 3.13 | 3.24 | 2.07 | 3.38 | 2.67 | 2.53 |
| R10 | 2.31 | 1.48 | 1.66 | 0.76 | 1.50 | 1.19 | 1.66 | 1.13 | 1.33 | 2.53 |
| R11 | 2.00 | 2.22 | 1.79 | 3.05 | 3.00 | 3.24 | 1.79 | 0.82 | 2.93 | 1.73 |
| R12 | 0.31 | 1.63 | 1.38 | 0.95 | 0.88 | 2.70 | 1.38 | 2.46 | 2.13 | 2.67 |
| R13 | 2.77 | 2.81 | 1.38 | 1.52 | 0.75 | 3.14 | 2.21 | 1.95 | 2.40 | 2.53 |
| R14 | 2.46 | 0.59 | 3.03 | 2.29 | 1.25 | 2.70 | 1.79 | 1.85 | 1.60 | 3.47 |
| R15 | 3.23 | 0.30 | 2.21 | 3.43 | 0.88 | 3.03 | 2.90 | 1.85 | 1.87 | 2.80 |
| R16 | 2.46 | 2.67 | 0.97 | 0.19 | 1.13 | 3.03 | 1.52 | 2.67 | 2.40 | 2.53 |
| R17 | 2.46 | 3.85 | 3.45 | 2.86 | 3.13 | 1.19 | 3.17 | 0.82 | 2.40 | 2.27 |
| R18 | 2.77 | 3.26 | 2.76 | 3.43 | 2.00 | 3.14 | 2.48 | 1.74 | 2.40 | 2.80 |
| R19 | 1.69 | 2.37 | 1.24 | 1.14 | 2.88 | 2.92 | 1.38 | 1.13 | 2.67 | 2.13 |
| R20 | 2.31 | 1.48 | 2.21 | 2.10 | 1.88 | 2.16 | 1.38 | 2.15 | 2.13 | 1.20 |
| R21 | 2.62 | 1.48 | 1.52 | 1.71 | 1.00 | 2.49 | 2.48 | 2.77 | 2.40 | 1.60 |
| R22 | 0.92 | 2.96 | 0.55 | 3.81 | 0.75 | 1.41 | 1.79 | 2.26 | 1.07 | 1.87 |
| R23 | 2.77 | 1.93 | 2.76 | 2.10 | 2.25 | 3.03 | 1.79 | 1.13 | 1.07 | 2.40 |
| R24 | 3.08 | 1.78 | 2.21 | 1.52 | 3.25 | 3.24 | 2.90 | 1.74 | 1.20 | 2.40 |
| R25 | 2.46 | 3.26 | 3.17 | 2.67 | 2.38 | 2.70 | 3.17 | 0.51 | 2.13 | 2.67 |
New decision matrix for the collective solution.
The ranking of the alternatives according to the second 2-tuple TOPSIS are presented in Table 5. Out of 25 risks examined, 8 were evaluated in the scale of “High,” the majority fluctuates around medium values, while only 3 received a “Low” score. Despite the moderate answers of the experts who avoided higher rates as discussed in Section 4.3, the percentage of high-importance risks indicate a broad concern of the stakeholders for the envisaged transition. Specifically, the risks with the higher importance with almost identical scores are the “Lack of investment framework” and the “Narrow consideration of competition.” The performance of these risks indicative a request from the experts to the state to develop a coherent strategy that will address the high investments costs of the transition and deal with competitiveness issues especially from major exporting countries, like China, that can offer cheaper commodities due to lower energy efficiency investments [55] and the slower development of a universal carbon market [56]. This is further established by the high performance of the risk “Imperfect picture of transition,” leading to the conclusion that the design of a clear transitional pathway that addresses the aforementioned concerns is vital
| Ranking | Alternative | 2-tuple TOPSIS Linguistic |
|---|---|---|
| 1 | R9 | (High, 0.04) |
| 2 | R18 | (High, 0.02) |
| 3 | R17 | (High, −0.15) |
| 4 | R25 | (High, −0.21) |
| 5 | R3 | (High, −0.31) |
| 6 | R8 | (High, −0.46) |
| 7 | R24 | (High, −0.46) |
| 8 | R6 | (High, −0.47) |
| 9 | R7 | (Medium, 0.45) |
| 10 | R11 | (Medium, 0.44) |
| 11 | R15 | (Medium, 0.42) |
| 12 | R13 | (Medium, 0.29) |
| 13 | R23 | (Medium, 0.25) |
| 14 | R14 | (Medium, 0.23) |
| 15 | R21s | (Medium, 0.09) |
| 16 | R16 | (Medium, 0.02) |
| 17 | R19 | (Medium, 0.02) |
| 18 | R20 | (Medium, −0.05) |
| 19 | R4 | (Medium, −0.06) |
| 20 | R22 | (Medium, −0.27) |
| 21 | R2 | (Medium, −0.34) |
| 22 | R12 | (Medium, −0.40) |
| 23 | R10 | (Low, 0.47) |
| 24 | R5 | (Low, 0.37) |
| 25 | R1 | (Low, −0.06) |
TOPSIS, Technique for Order Preference by Similarity to Ideal Solution.
Final ranking of risks based on the collective solution.
In Figure 7, the results are presented following the allocation of the risks to the groups described in Table 1.
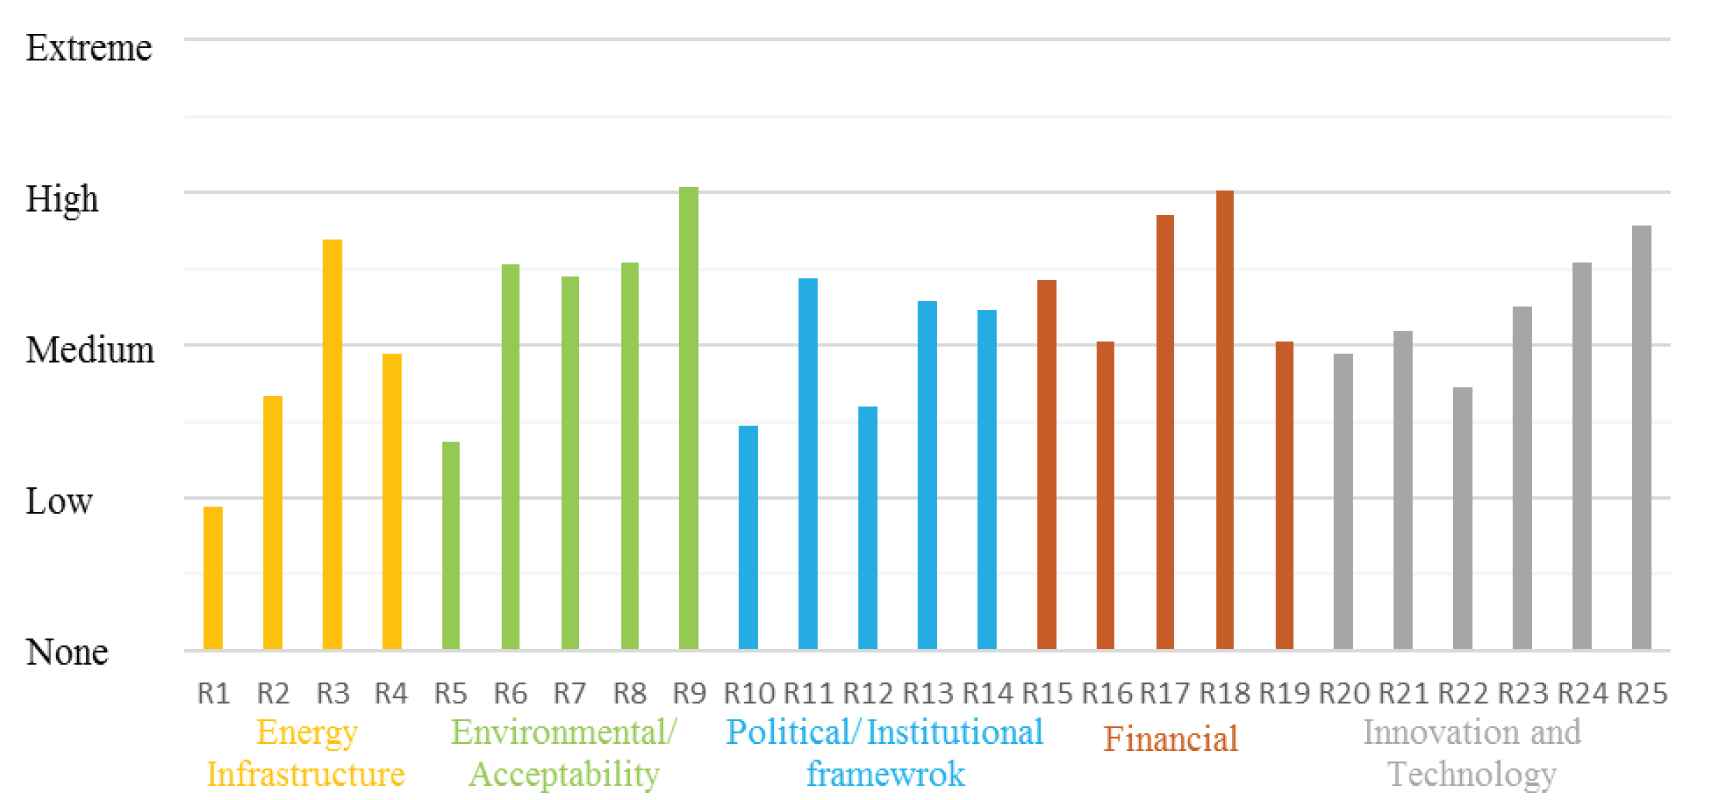
Clustered results of the collective solution.
From an infrastructural perspective, the “Lack of storage capacity” is considered the most important risk, since it is associated with the ability of the grid to maintain high shares of renewable energy productions. The procedures for investments in infrastructure and the stability of the grid perform slightly below medium, showcasing that, if the storage capacity is improved, the stakeholders are confident about the efficiency of the infrastructure economically and technologically. The transparency of the infrastructural procedures concerns stakeholders the least, not only in the same cluster, but over the complete set of alternatives, which indicates that, if the financial, technological, and social aspects of the transition are determined, it will be easier to adapt to procedural requirements.
In the environmental cluster, apart from the lack of an investment framework, consumption of resources received attention, since the activities of the iron and steel industry commence from the iron ores, as discussed in Section 4.1. Significant concern also exists over the behavior of the end-users both through “Insufficient consideration of lifestyles” and “Social resistance against investments.” Interestingly, however, the risk of “Social Injustices” that could arise in a transition and affect the local communities received low importance, ending in the second to last place. Despite being concerned over the resistance they may face over the transition of the sector, stakeholders lack the understanding or the will to address the primal reasons that can cause resistance from the community. The importance of understanding the negative impacts, such as job losses, in the process of developing the plan requested by the stakeholders should be a key aspect of a “just transition” [57], built on a social dialogue that includes all interested parties [58].
Regarding the political/institutional framework, the balanced results indicate that there are some concerns over “Fluctuation of CO2 prices” and the “Lack of political leadership” that should not be neglected, but they do not raise immediate threats. On this cluster “Short-sighted energy/climate planning” seems to be the most important risk, with the stakeholders fearing that the current plans lack long-term vision. On the other hand, the stakeholders believe that “Market distortions” and the “Non-evidence-based regulatory framework” do not constitute significant risks, placing them in the lower positions of the ranking.
Having discussed the “Narrow consideration of competition” which has been identified by stakeholders as one of the top two risks, “Nonengaging/unstable markets” also received a comparably high score, establishing the financial cluster as an important factor of the risks associated with the transition. Industries like iron and steel that provide supplies for other major industries are bound to the stability of these markets and especially their reluctancy of adopting cleaner solutions [59]. This is associated with the “Price risks due to new technologies,” since low-carbon products may cause higher prices, which may lead to “Uneven distribution of transition costs,” two risks that both received medium importance. Financial coordination among the EU countries is also an aspect identified as fairly important by the stakeholders to outbalance the competitive advantage of countries like China, as previously discussed.
In the innovation and technology group, we discussed the importance of developing a clear picture of the envisaged transition, with the clustered results also indicating this picture should incorporate effective information flow channels. In the innovation system of iron and steel, these networks will allow cooperation in the distribution of knowledge and implementation of innovative projects [60]. “Technological lock-ins in iron and steel,” “Limited funding capacity,” “Bad timing of new industry technologies,” and “Little integration across multiple sectors” are risks of medium importance that should be taken into account, as part of this broader strategy.
4.4.3. Consensus level
To calculate the consensus level of the experts compared to the global solution we use the methodology proposed in Section 2.4 and then compare the results with the original method proposed by Ref. [31]. The results are shown in Table 6 and Figure 8, where for both models a value of
| Herrera-Viedma et al. [31] | Proposed Methodology | ||
|---|---|---|---|
| Proximity level | EXP1 | 94.4 | 84.4 |
| EXP2 | 58.3 | 83.1 | |
| EXP3 | 66.3 | 85.6 | |
| EXP4 | 55.9 | 82.8 | |
| EXP5 | 91.5 | 84.3 | |
| EXP6 | 94.9 | 86.3 | |
| EXP7 | 60.1 | 89.1 | |
| EXP8 | 92.9 | 79.4 | |
| EXP9 | 90.8 | 84.6 | |
| EXP10 | 64.7 | 86.9 | |
| Consensus measure | 77.0 | 84.6 | |
Consensus measure and proximity levels of individual solutions compared to the collective.
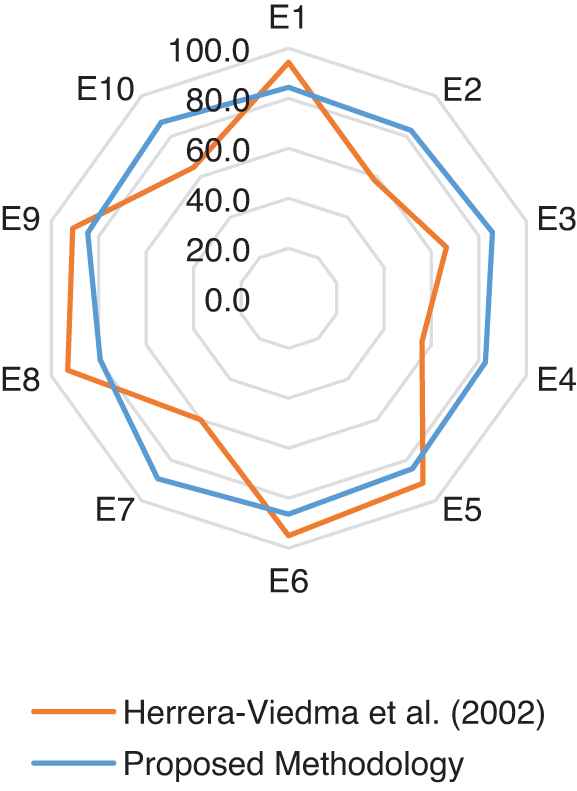
Proximity level of each expert.
From the results, it is showcased that the proposed consensus model is less rigorous than the initial methodology both in terms of the total consensus level and the variance of the proximity of each expert.
Our method results to a consensus level of 84.6% compared to the 77% level of the initial model. The main reason for this difference derives from the way Herrera-Viedma et al. calculate the dissimilarity, which is based on the position in the rankings of the collective and the experts’ solutions, whereas in the proposed method the scores of TOPSIS are used. In this case study, many alternatives where concentrated around the “medium” scale. For that reason, calculating dissimilarity simply based on the position can exaggerate the existing differences. For example, as we can see on Table 5, the positions from 6 to 11 in the collective solution are separated by only a 0.12 difference in the five-term scale. Therefore, no strong preference can be deduced, rather than merely a tendency. However, the 5-place distance between the rankings of these risks in a total of 25 alternatives can strongly increase the dissimilarity level. This exaggeration is mitigated in the proposed methodology, since the 2-tuple TOPSIS results are used, taking into consideration the exact distance in the assessment of the individual expert and the collective solution, thus using all the available information to calculate the consensus level.
For the proximity levels of each expert to the collective solution, the results show less variance in the proposed methodology compared to the initial partially due to the exaggeration explained above, but also because of the choice and use of the OWA operator, a bias already recognized by Herrera-Viedma et al. Specifically, by using the value of
As seen in Figure 5 the experts collectively showed a moderate behavior toward lower grades. For example, Expert 9’s solutions show a low deviation with most of them slightly fluctuating around medium values, as seen in Figure 6. However, both consensus models gave the expert a high consensus percentage due to the fact that many alternatives in the collective solutions were also rated around medium. Both models need to consider this bias toward moderate behavior and not punish experts that are more willing to use the full extent of the linguistic scale to better express the existing differences among the alternatives.
5. CONCLUSIONS
In this research, APOLLO, a fuzzy decision support tool is presented to deal with MCDM problems in climate change and policy issues. Stakeholder engagement processes are enabled by using linguistic variables which are more similar to the way experts think. Therefore, it is easier for them to provide the initial feedback and understand the final results derived by the tool. On the first stage, APOLLO uses an adaptation of the 2-tuple TOPSIS [22] to analyze the initial assessments and calculate the ranking and the evaluations of the alternatives for each expert independently. These evaluations are then used as input of the next 2-tuple TOPSIS calculation to find the collective solution of the group of experts [23].
However, the assessments of the experts may include significant dissimilarities, which threaten the acceptance of the final solution. To increase robustness of the solution, APOLLO incorporates a new consensus measuring model that builds on Ref. [31]. The contribution of the model lies on the fact that it uses the 2-tuple TOPSIS evaluations to weight the distances between the experts and the collective solution. From that perspective, each alternative is given the necessary importance for the calculation of consensus and proximity, limiting rigorous assessments.
The added value of APOLLO lies in it constituting a complete tool to perform risk assessments and solve broader problems of DM related to sustainability and decarbonization policies, as its features are tailored to the specificities of the domain (in terms of types of alternatives and criteria, need for large number of stakeholders, and requirements for socially just action driven by consensus). The tool provides robust solutions through measuring consensus among experts, and results that are comprehensible to all audiences and thus all stakeholder groups, making it easier for them to trust the analysis and convert findings into concrete actions.
The tool and the proposed framework are used in an Austrian case study, where stakeholders evaluate the importance of potential risks threatening the low-carbon transition of the iron and steel industry.
We showcase that despite the generally moderate initial answers provided by the stakeholders, many risks received a final evaluation of “high” based on the 5-scale term used for in linguistic model. This indicates that there is a broad concern over the sustainable transition of the sector. Experts agreed with a consensus level of 85% that the most important risks threatening the transition refer to the “Lack of investment framework” and the “Narrow consideration of competition,” closely followed by the “Nonengaging/unstable markets” and the “Imperfect picture of the transition.” These results can be interpreted as a plea from the experts to policymakers to create a coherent and clear transformational strategy that provides financial resources toward low-carbon technologies that are associated with increased shares of RES production, while also dealing with competition from emerging powerhouses. Regarding the system’s ability to manage the high penetration of RES, storage capacity is another risk evaluated as important from the experts.
In our study, a key limitation was that the experts evaluated the alternatives only once, which eliminated the possibility to perform a complete CRP, by providing them with feedback to alter their initial assessments. Therefore, APOLLO can be enhanced to incorporate a CRP cycle [39], which can be tested in a multiple-round stakeholder engagement case study to achieve a higher level of agreement in the group [38]. As part of consensus measuring, the moderate behavior should be formally examined, since current models may punish an expert that deviates from median values. However, such an expert can provide insights along the entire scale used, instead of fluctuating around median values. APOLLO can also be coupled with evolutionary approaches like the “multi-level perspective” [62] to create a holistic framework that captures both the qualitative aspects of innovation in a transition and quantitative multi-criteria risk assessment.
CONFLICTS OF INTEREST
The authors have declared no conflicts of interest.
AUTHORS' CONTRIBUTIONS
Conceptualization, Alexandros Nikas, Konstantinos Koasidis, Haris Doukas; research literature, Alexandros Nikas, Konstantinos Koasidis, Álvaro Labella; methodology, Konstantinos Koasidis, Alexandros Nikas, Álvaro Labella; software development, Álvaro Labella; data curation, Konstantinos Koasidis, Apostolos Arsenopoulos, formal analysis, Konstantinos Koasidis, Álvaro Labella; writing—original draft preparation, Konstantinos Koasidis, Alexandros Nikas, Álvaro Labella; writing—review and editing, Alexandros Nikas, Konstantinos Koasidis, Haris Doukas; funding acquisition, Haris Doukas. All authors have read and agreed to the published version of the manuscript.
ACKNOWLEDGMENTS
The authors would like to thank Mr. Christos Petkidis for his copyediting work. This work was supported by the H2020 European Commission Project “PARIS REINFORCE,” under grant Agreement No. 820846. The sole responsibility for the content of this paper lies with the authors; the paper does not necessarily reflect the opinion of the European Commission.
REFERENCES
Cite this article
TY  - JOUR
AU  - Álvaro Labella
AU  - Konstantinos Koasidis
AU  - Alexandros Nikas
AU  - Apostolos Arsenopoulos
AU  - Haris Doukas
PY  - 2020
DA  - 2020/10/01
TI  - APOLLO: A Fuzzy Multi-criteria Group Decision-Making Tool in Support of Climate Policy
JO  - International Journal of Computational Intelligence Systems
SP  - 1539
EP  - 1553
VL  - 13
IS  - 1
SN  - 1875-6883
UR  - https://doi.org/10.2991/ijcis.d.200924.002
DO  - 10.2991/ijcis.d.200924.002
ID  - Labella2020
ER  -